
|
|||||
|
 | |
| |
| |
| |
| |
| |
|
Gene: FKBP1A |
Gene summary for FKBP1A |
| Gene information | Species | Human | Gene symbol | FKBP1A | Gene ID | 2280 |
| Gene name | FKBP prolyl isomerase 1A | |
| Gene Alias | FKBP-12 | |
| Cytomap | 20p13 | |
| Gene Type | protein-coding | GO ID | GO:0000413 | UniProtAcc | P62942 |
Top |
Malignant transformation analysis |
| Identification of the aberrant gene expression in precancerous and cancerous lesions by comparing the gene expression of stem-like cells in diseased tissues with normal stem cells |
| Entrez ID | Symbol | Replicates | Species | Organ | Tissue | Adj P-value | Log2FC | Malignancy |
| 2280 | FKBP1A | GSM4909280 | Human | Breast | Precancer | 2.88e-04 | -5.53e-01 | 0.0305 |
| 2280 | FKBP1A | GSM4909287 | Human | Breast | IDC | 2.16e-02 | -2.88e-01 | 0.2057 |
| 2280 | FKBP1A | GSM4909294 | Human | Breast | IDC | 7.64e-08 | -1.70e-01 | 0.2022 |
| 2280 | FKBP1A | GSM4909296 | Human | Breast | IDC | 1.09e-10 | -3.15e-01 | 0.1524 |
| 2280 | FKBP1A | GSM4909297 | Human | Breast | IDC | 1.65e-22 | -2.53e-01 | 0.1517 |
| 2280 | FKBP1A | GSM4909301 | Human | Breast | IDC | 6.99e-09 | -3.59e-01 | 0.1577 |
| 2280 | FKBP1A | GSM4909304 | Human | Breast | IDC | 2.97e-16 | -5.19e-01 | 0.1636 |
| 2280 | FKBP1A | GSM4909308 | Human | Breast | IDC | 5.52e-13 | 4.58e-01 | 0.158 |
| 2280 | FKBP1A | GSM4909311 | Human | Breast | IDC | 5.12e-40 | -3.15e-01 | 0.1534 |
| 2280 | FKBP1A | GSM4909312 | Human | Breast | IDC | 1.77e-40 | 5.33e-01 | 0.1552 |
| 2280 | FKBP1A | GSM4909316 | Human | Breast | IDC | 1.71e-04 | 1.73e-02 | 0.21 |
| 2280 | FKBP1A | GSM4909318 | Human | Breast | IDC | 9.20e-04 | 3.14e-01 | 0.2031 |
| 2280 | FKBP1A | GSM4909319 | Human | Breast | IDC | 1.48e-57 | -4.19e-01 | 0.1563 |
| 2280 | FKBP1A | GSM4909320 | Human | Breast | IDC | 1.82e-17 | -7.62e-01 | 0.1575 |
| 2280 | FKBP1A | GSM4909321 | Human | Breast | IDC | 1.89e-22 | -3.10e-01 | 0.1559 |
| 2280 | FKBP1A | brca1 | Human | Breast | Precancer | 1.96e-15 | 4.85e-01 | -0.0338 |
| 2280 | FKBP1A | brca2 | Human | Breast | Precancer | 1.87e-02 | 2.21e-01 | -0.024 |
| 2280 | FKBP1A | M1 | Human | Breast | IDC | 6.06e-08 | -4.71e-01 | 0.1577 |
| 2280 | FKBP1A | M2 | Human | Breast | IDC | 1.89e-09 | 4.08e-01 | 0.21 |
| 2280 | FKBP1A | NCCBC14 | Human | Breast | DCIS | 1.60e-15 | -4.06e-01 | 0.2021 |
| Page: 1 2 3 4 5 6 7 8 9 10 11 12 13 14 15 |
| Tissue | Expression Dynamics | Abbreviation |
| Breast | 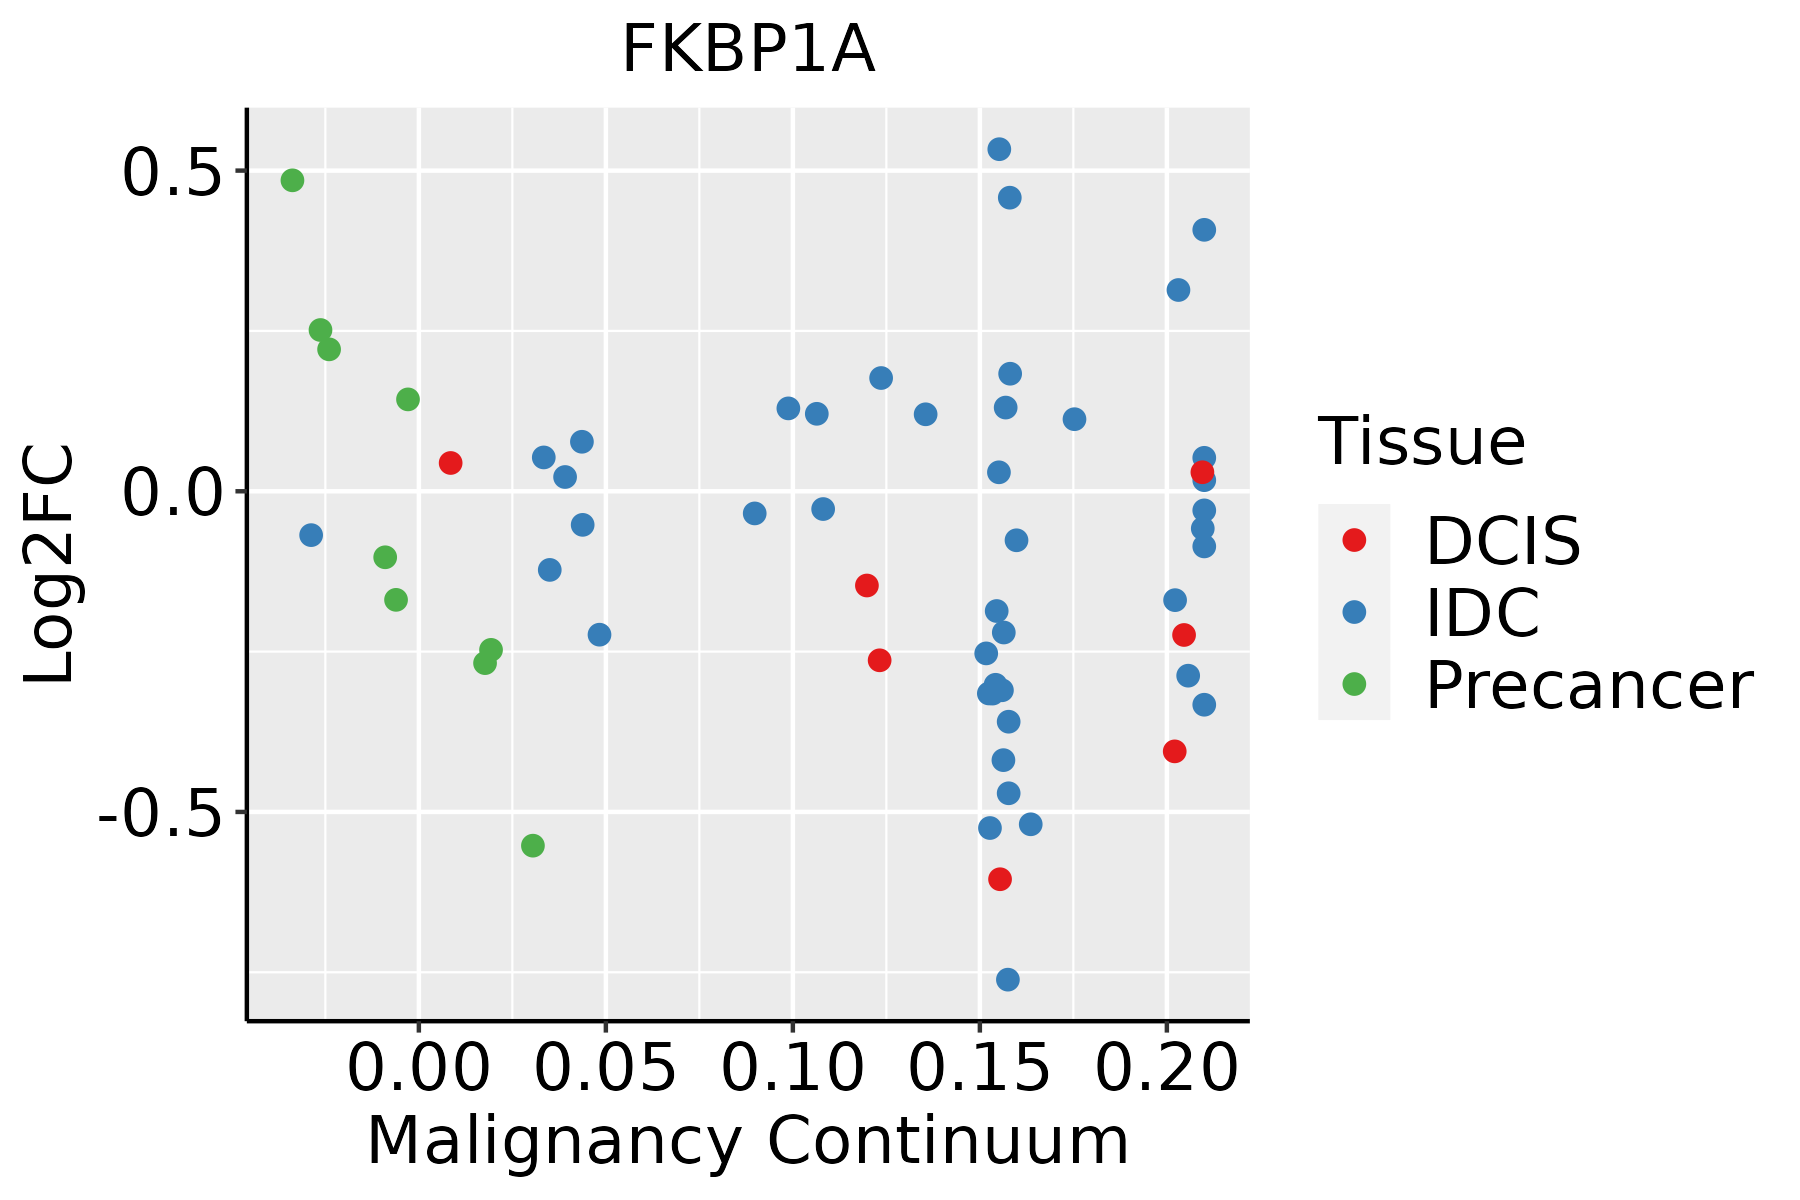 | IDC: Invasive ductal carcinoma |
| DCIS: Ductal carcinoma in situ | ||
| Precancer(BRCA1-mut): Precancerous lesion from BRCA1 mutation carriers | ||
| Cervix |  | CC: Cervix cancer |
| HSIL_HPV: HPV-infected high-grade squamous intraepithelial lesions | ||
| N_HPV: HPV-infected normal cervix | ||
| Colorectum (GSE201348) | 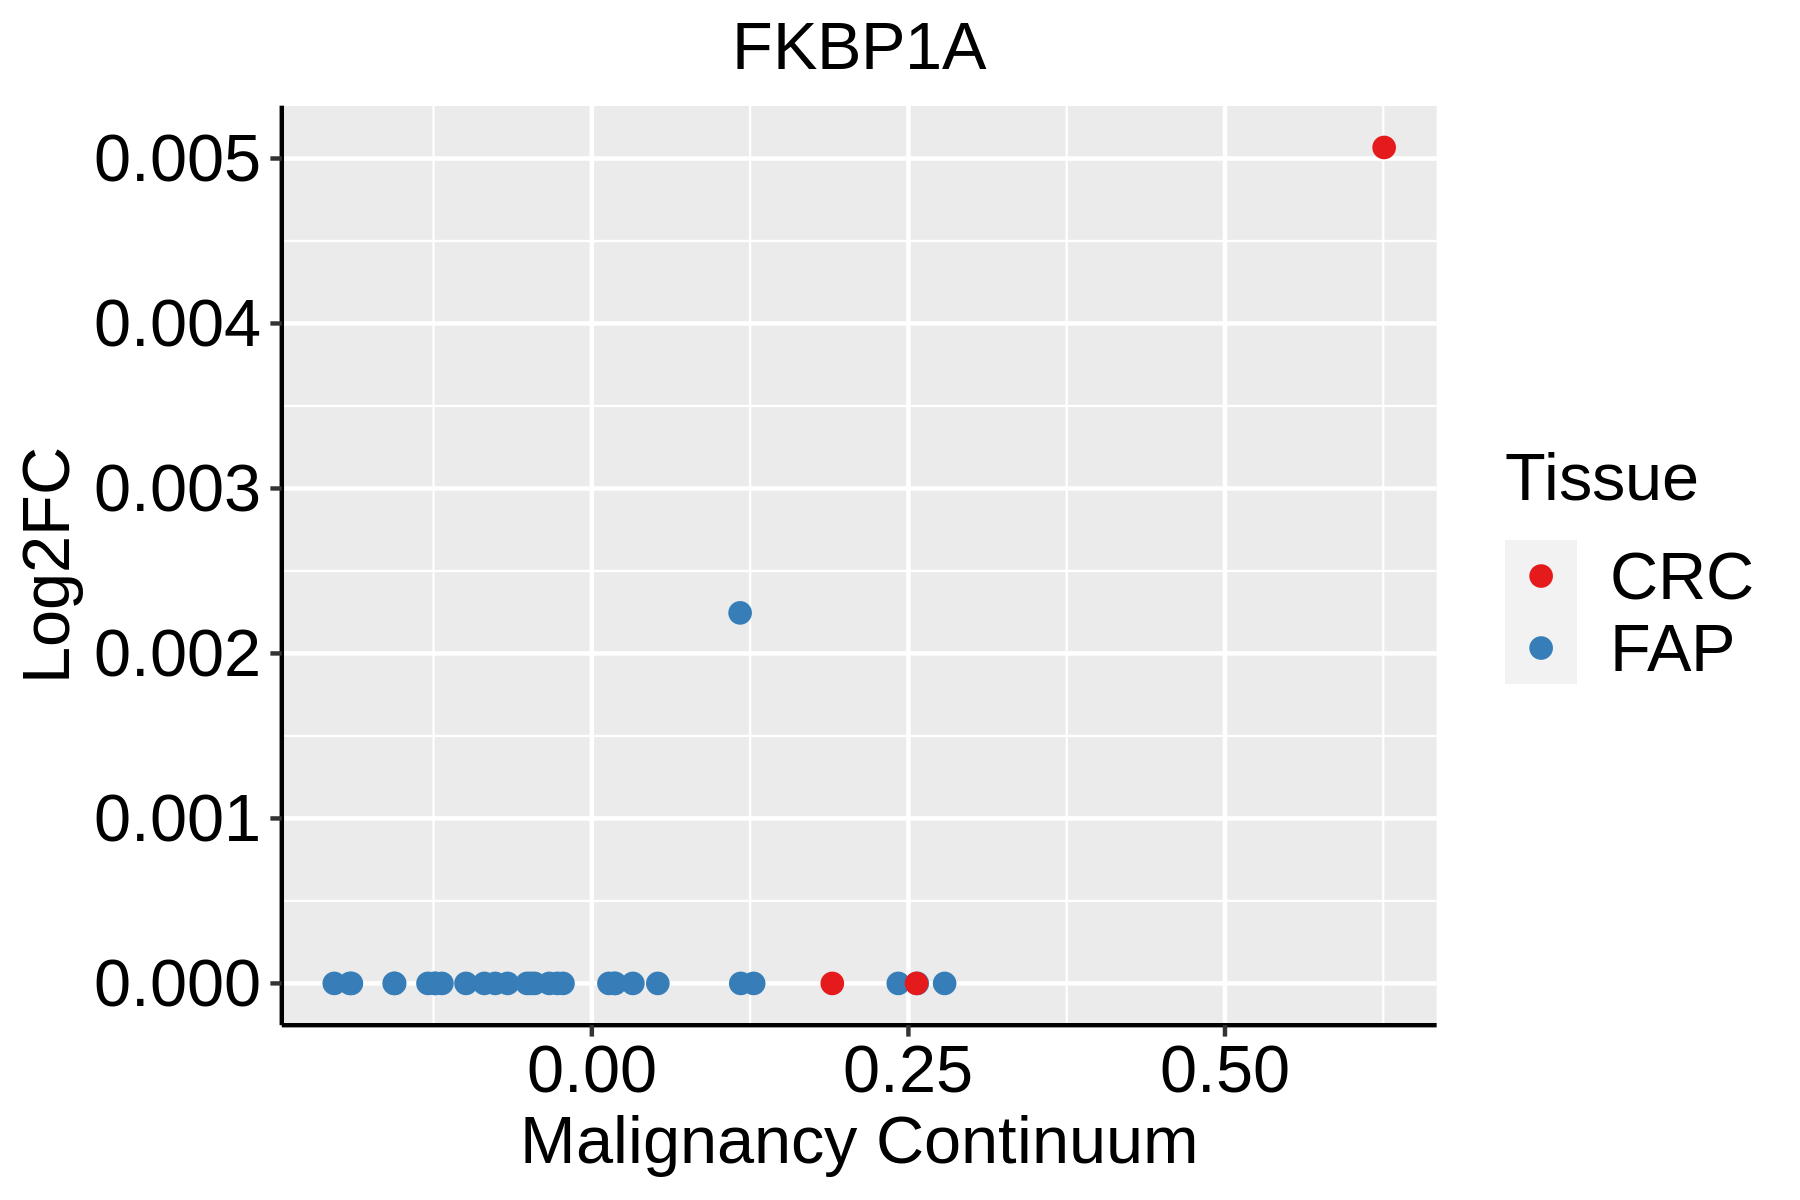 | FAP: Familial adenomatous polyposis |
| CRC: Colorectal cancer | ||
| Colorectum (HTA11) |  | AD: Adenomas |
| SER: Sessile serrated lesions | ||
| MSI-H: Microsatellite-high colorectal cancer | ||
| MSS: Microsatellite stable colorectal cancer | ||
| Endometrium |  | AEH: Atypical endometrial hyperplasia |
| EEC: Endometrioid Cancer | ||
| Esophagus | 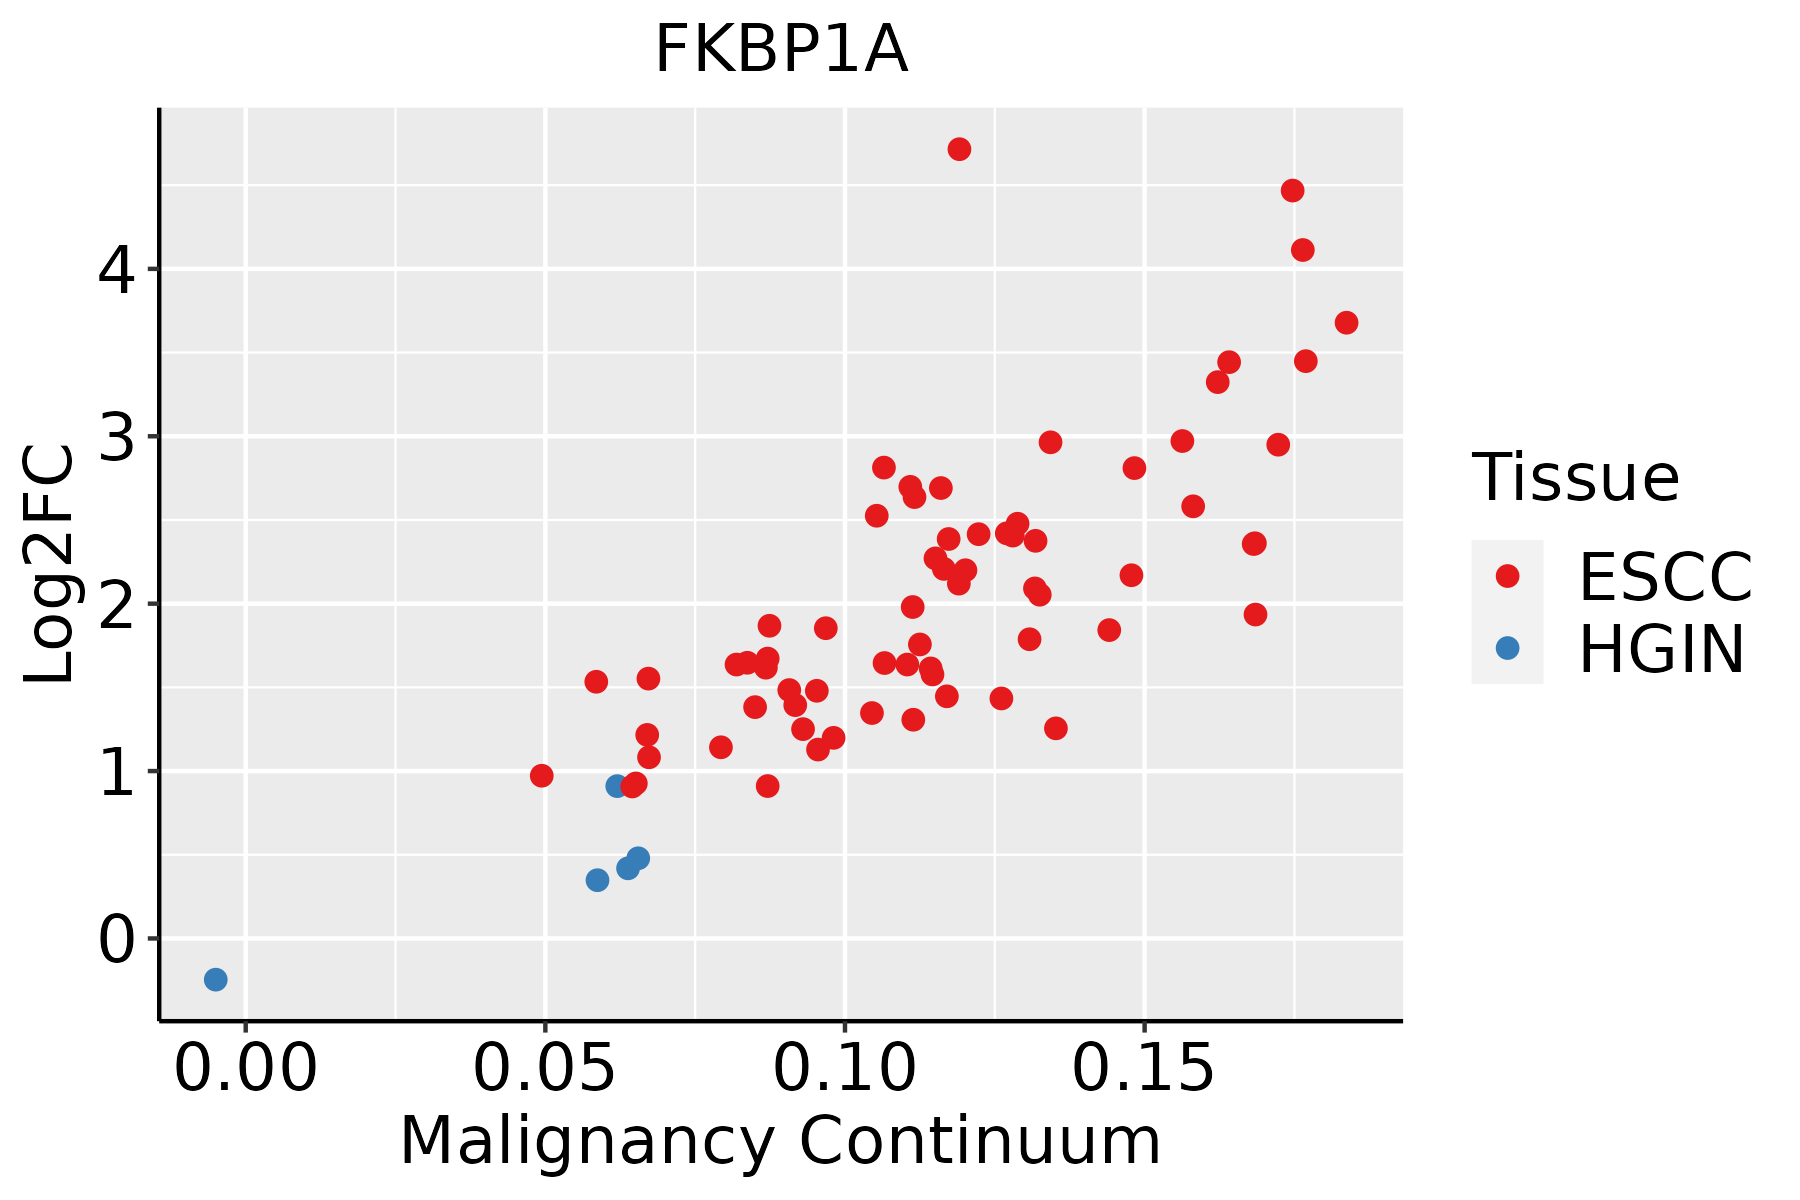 | ESCC: Esophageal squamous cell carcinoma |
| HGIN: High-grade intraepithelial neoplasias | ||
| LGIN: Low-grade intraepithelial neoplasias | ||
| GC | 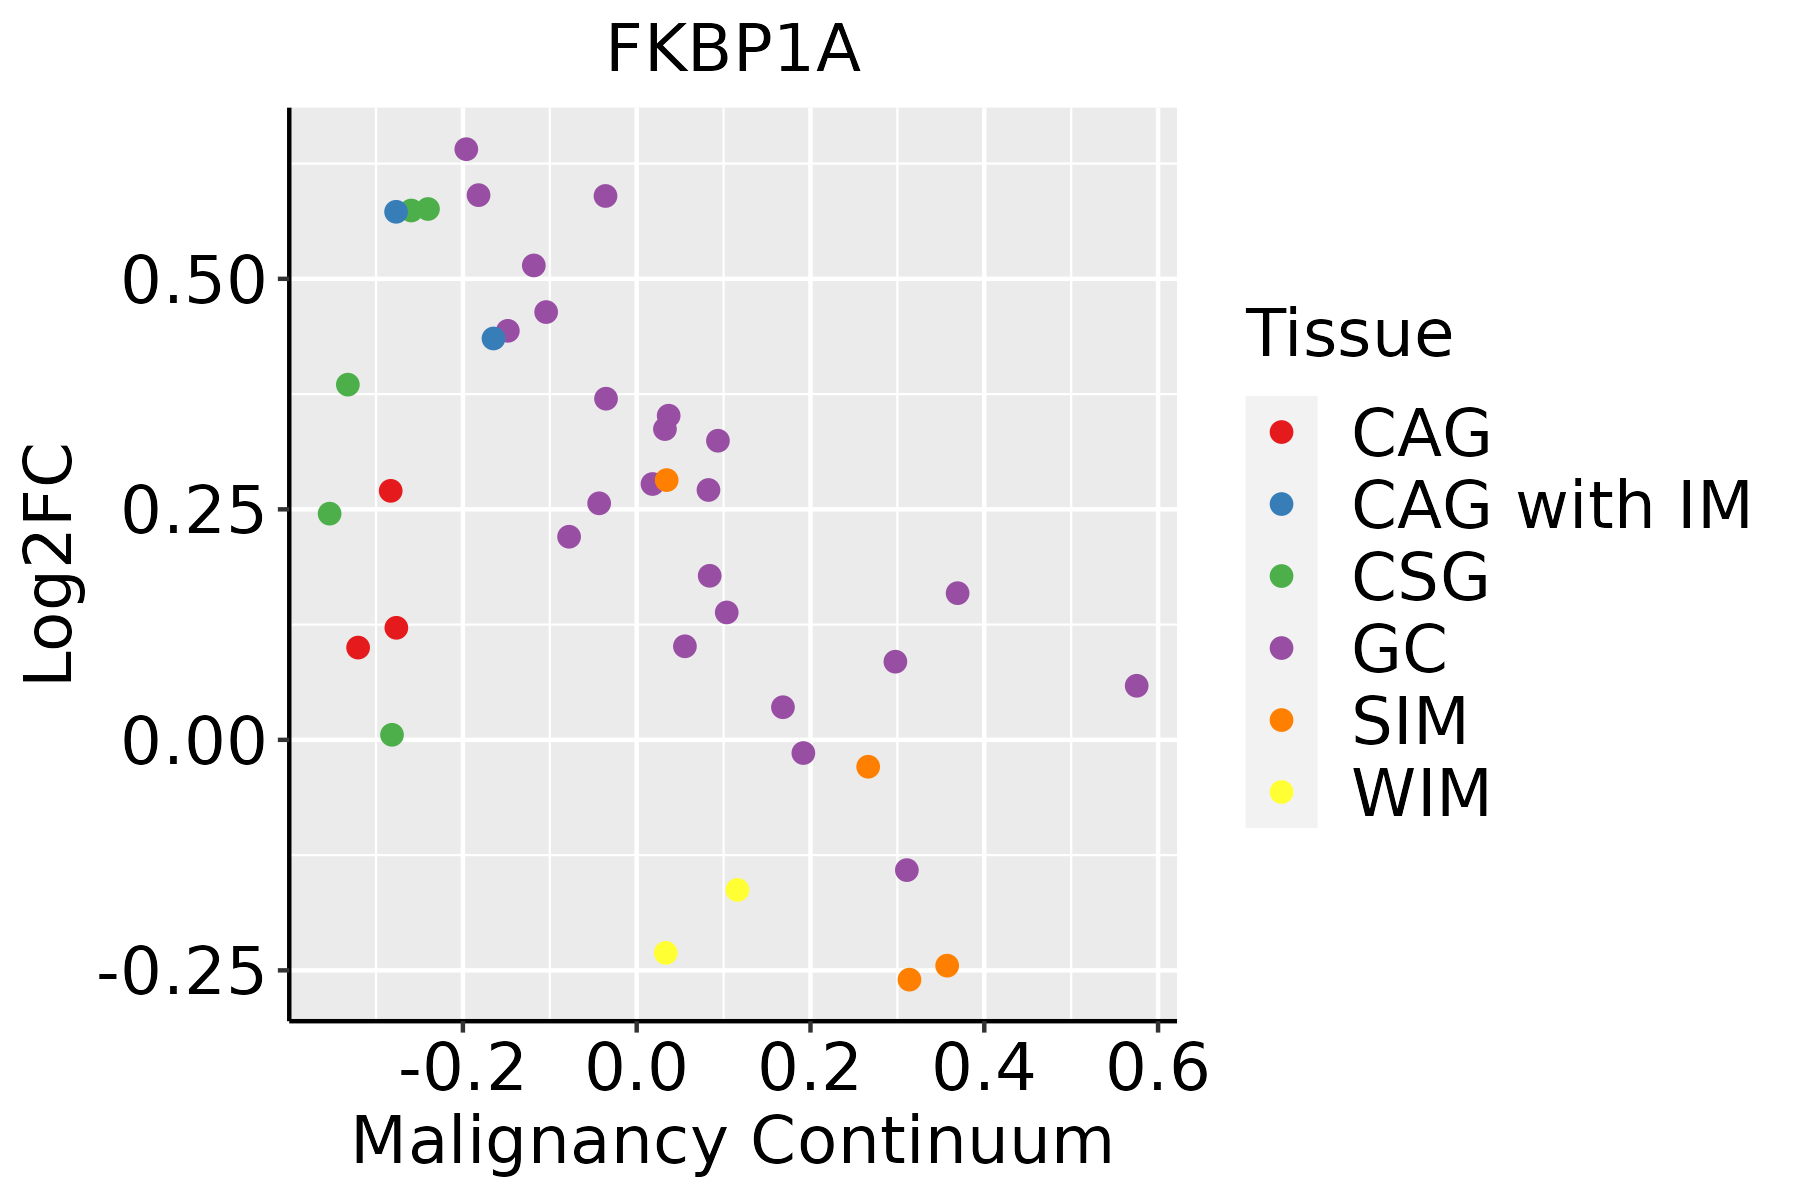 | CAG: Chronic atrophic gastritis |
| CAG with IM: Chronic atrophic gastritis with intestinal metaplasia | ||
| CSG: Chronic superficial gastritis | ||
| GC: Gastric cancer | ||
| SIM: Severe intestinal metaplasia | ||
| WIM: Wild intestinal metaplasia | ||
| Liver | 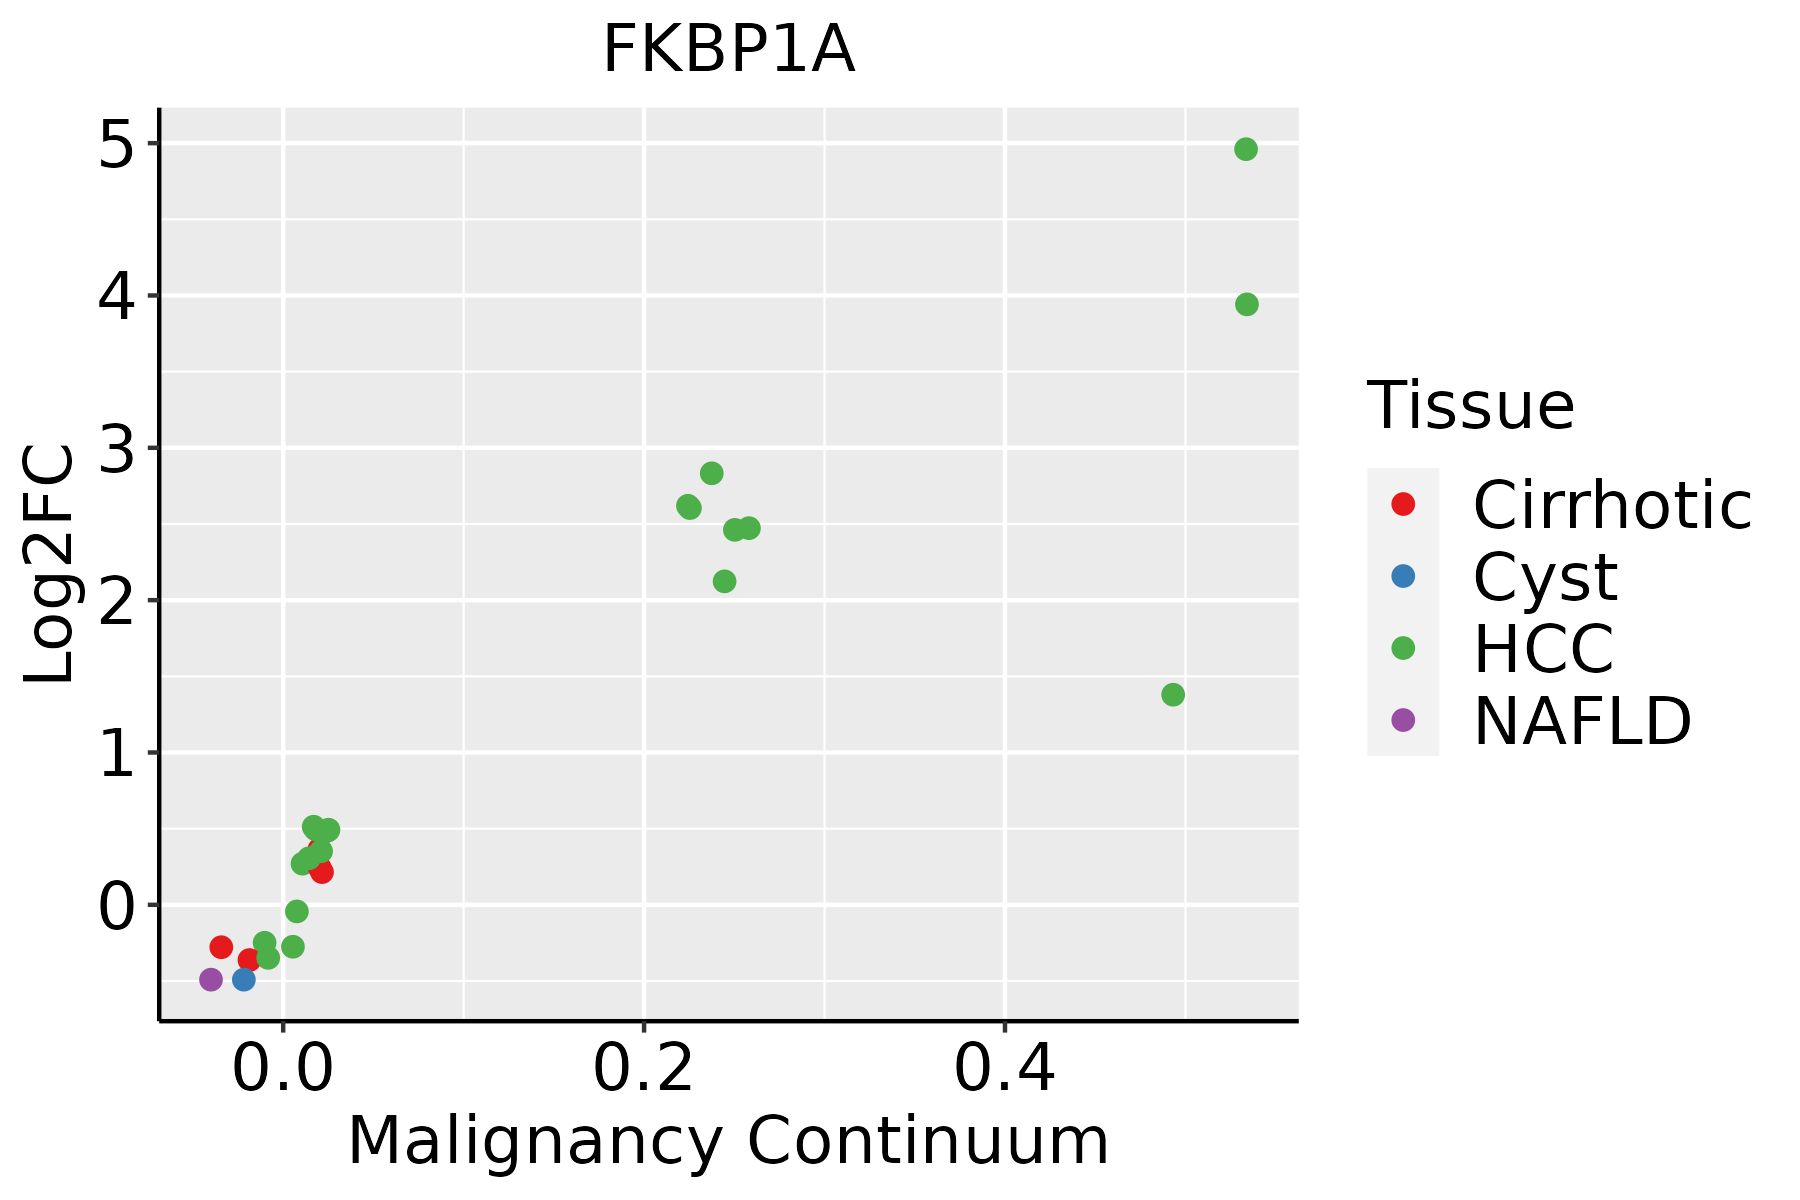 | HCC: Hepatocellular carcinoma |
| NAFLD: Non-alcoholic fatty liver disease | ||
| Oral Cavity |  | EOLP: Erosive Oral lichen planus |
| LP: leukoplakia | ||
| NEOLP: Non-erosive oral lichen planus | ||
| OSCC: Oral squamous cell carcinoma | ||
| Prostate | 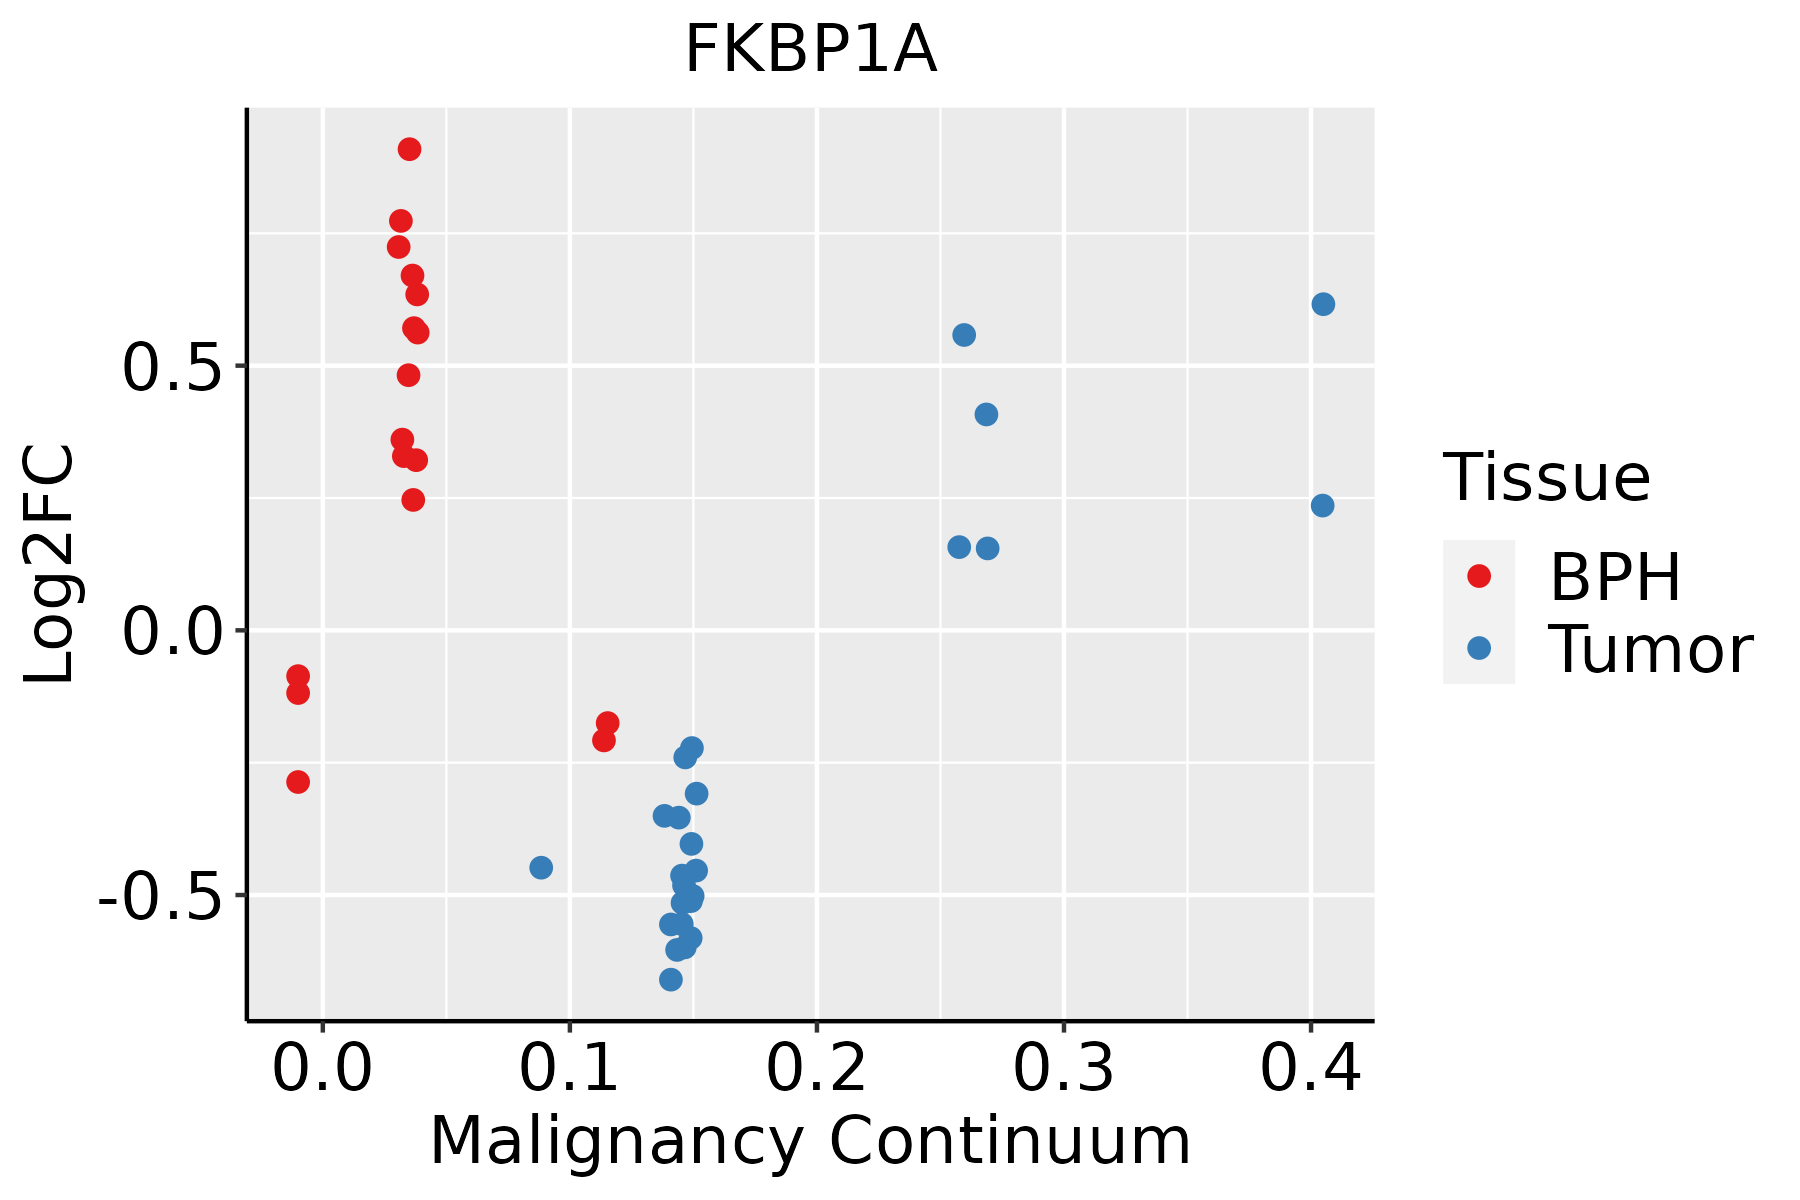 | BPH: Benign Prostatic Hyperplasia |
| Skin |  | AK: Actinic keratosis |
| cSCC: Cutaneous squamous cell carcinoma | ||
| SCCIS:squamous cell carcinoma in situ | ||
| Thyroid |  | ATC: Anaplastic thyroid cancer |
| HT: Hashimoto's thyroiditis | ||
| PTC: Papillary thyroid cancer |
| ∗log2FC in expression of this searched gene in stem-like cells from each diseased tissue sample relative to stem-like cells in normal samples in each tissue plotted against the malignancy continuum. Samples are colored based on if they are from different disease stage. |
Top |
Malignant transformation related pathway analysis |
| Find out the enriched GO biological processes and KEGG pathways involved in transition from healthy to precancer to cancer |
| Tissue | Disease Stage | Enriched GO biological Processes |
| Colorectum | AD |  |
| Colorectum | SER |  |
| Colorectum | MSS |  |
| Colorectum | MSI-H |  |
| Colorectum | FAP |  |
| ∗Top 15 enriched GO BP terms are showed in the bar plot of each disease state in each tissue. Each row represents a significant GO biological process which is colored according to the -log10(p.adjust). |
| Page: 1 2 3 4 5 6 7 8 9 |
| GO ID | Tissue | Disease Stage | Description | Gene Ratio | Bg Ratio | pvalue | p.adjust | Count |
| GO:00064578 | Breast | Precancer | protein folding | 43/1080 | 212/18723 | 3.48e-13 | 7.45e-11 | 43 |
| GO:00064588 | Breast | Precancer | 'de novo' protein folding | 16/1080 | 43/18723 | 8.14e-10 | 6.92e-08 | 16 |
| GO:00610778 | Breast | Precancer | chaperone-mediated protein folding | 19/1080 | 67/18723 | 4.22e-09 | 3.28e-07 | 19 |
| GO:19033209 | Breast | Precancer | regulation of protein modification by small protein conjugation or removal | 38/1080 | 242/18723 | 1.71e-08 | 1.17e-06 | 38 |
| GO:00513468 | Breast | Precancer | negative regulation of hydrolase activity | 50/1080 | 379/18723 | 3.85e-08 | 2.34e-06 | 50 |
| GO:00313969 | Breast | Precancer | regulation of protein ubiquitination | 33/1080 | 210/18723 | 1.45e-07 | 7.82e-06 | 33 |
| GO:00420268 | Breast | Precancer | protein refolding | 10/1080 | 23/18723 | 2.25e-07 | 1.13e-05 | 10 |
| GO:00510989 | Breast | Precancer | regulation of binding | 44/1080 | 363/18723 | 2.59e-06 | 8.65e-05 | 44 |
| GO:00512358 | Breast | Precancer | maintenance of location | 40/1080 | 327/18723 | 5.85e-06 | 1.71e-04 | 40 |
| GO:00516519 | Breast | Precancer | maintenance of location in cell | 30/1080 | 214/18723 | 5.91e-06 | 1.71e-04 | 30 |
| GO:00421107 | Breast | Precancer | T cell activation | 52/1080 | 487/18723 | 1.37e-05 | 3.42e-04 | 52 |
| GO:19900005 | Breast | Precancer | amyloid fibril formation | 9/1080 | 34/18723 | 9.66e-05 | 1.80e-03 | 9 |
| GO:00510999 | Breast | Precancer | positive regulation of binding | 23/1080 | 173/18723 | 1.58e-04 | 2.68e-03 | 23 |
| GO:00353049 | Breast | Precancer | regulation of protein dephosphorylation | 14/1080 | 90/18723 | 6.16e-04 | 7.72e-03 | 14 |
| GO:00182085 | Breast | Precancer | peptidyl-proline modification | 10/1080 | 58/18723 | 1.62e-03 | 1.65e-02 | 10 |
| GO:00353086 | Breast | Precancer | negative regulation of protein dephosphorylation | 7/1080 | 34/18723 | 2.84e-03 | 2.49e-02 | 7 |
| GO:00605374 | Breast | Precancer | muscle tissue development | 37/1080 | 403/18723 | 3.60e-03 | 2.98e-02 | 37 |
| GO:00109596 | Breast | Precancer | regulation of metal ion transport | 37/1080 | 406/18723 | 4.07e-03 | 3.22e-02 | 37 |
| GO:00147063 | Breast | Precancer | striated muscle tissue development | 35/1080 | 384/18723 | 5.10e-03 | 3.83e-02 | 35 |
| GO:00436667 | Breast | Precancer | regulation of phosphoprotein phosphatase activity | 9/1080 | 58/18723 | 5.67e-03 | 4.08e-02 | 9 |
| Page: 1 2 3 4 5 6 7 8 9 10 11 12 13 14 15 16 17 18 19 20 21 22 23 24 25 26 27 28 29 30 31 32 33 34 35 36 37 38 39 40 41 42 43 44 45 46 47 48 49 50 51 52 53 54 |
| Pathway ID | Tissue | Disease Stage | Description | Gene Ratio | Bg Ratio | pvalue | p.adjust | qvalue | Count |
| Page: 1 |
Top |
Cell-cell communication analysis |
| Identification of potential cell-cell interactions between two cell types and their ligand-receptor pairs for different disease states |
| Ligand | Receptor | LRpair | Pathway | Tissue | Disease Stage |
| Page: 1 |
Top |
Single-cell gene regulatory network inference analysis |
| Find out the significant the regulons (TFs) and the target genes of each regulon across cell types for different disease states |
| TF | Cell Type | Tissue | Disease Stage | Target Gene | RSS | Regulon Activity |
| ∗The dot plots of a searched regulon are shown for all cell subpopulations in each disease state of each tissue based on the regulon specific score inferred using pySCENIC and by calculating the average expression. |
| Page: 1 |
Top |
Somatic mutation of malignant transformation related genes |
| Annotation of somatic variants for genes involved in malignant transformation |
| Hugo Symbol | Variant Class | Variant Classification | dbSNP RS | HGVSc | HGVSp | HGVSp Short | SWISSPROT | BIOTYPE | SIFT | PolyPhen | Tumor Sample Barcode | Tissue | Histology | Sex | Age | Stage | Therapy Types | Drugs | Outcome |
| FKBP1A | SNV | Missense_Mutation | novel | c.206N>G | p.Val69Gly | p.V69G | P62942 | protein_coding | deleterious(0) | possibly_damaging(0.747) | TCGA-A8-A08H-01 | Breast | breast invasive carcinoma | Female | >=65 | I/II | Unknown | Unknown | SD |
| FKBP1A | SNV | Missense_Mutation | c.298N>C | p.Phe100Leu | p.F100L | P62942 | protein_coding | deleterious(0) | probably_damaging(0.982) | TCGA-G4-6628-01 | Colorectum | colon adenocarcinoma | Male | >=65 | I/II | Unknown | Unknown | SD | |
| FKBP1A | SNV | Missense_Mutation | c.116N>A | p.Ser39Tyr | p.S39Y | P62942 | protein_coding | deleterious(0) | probably_damaging(0.994) | TCGA-T9-A92H-01 | Colorectum | colon adenocarcinoma | Male | >=65 | I/II | Unknown | Unknown | PD | |
| FKBP1A | SNV | Missense_Mutation | c.116N>G | p.Ser39Cys | p.S39C | P62942 | protein_coding | deleterious(0) | probably_damaging(0.976) | TCGA-CL-5917-01 | Colorectum | rectum adenocarcinoma | Female | >=65 | III/IV | Unknown | Unknown | SD | |
| FKBP1A | SNV | Missense_Mutation | c.173N>A | p.Arg58Gln | p.R58Q | P62942 | protein_coding | tolerated(0.12) | benign(0.309) | TCGA-AX-A05Z-01 | Endometrium | uterine corpus endometrioid carcinoma | Female | <65 | III/IV | Chemotherapy | adriamycin | SD | |
| FKBP1A | SNV | Missense_Mutation | novel | c.253G>A | p.Ala85Thr | p.A85T | P62942 | protein_coding | deleterious(0.04) | benign(0.009) | TCGA-EO-A22T-01 | Endometrium | uterine corpus endometrioid carcinoma | Female | <65 | I/II | Unknown | Unknown | SD |
| FKBP1A | SNV | Missense_Mutation | novel | c.240T>G | p.Asp80Glu | p.D80E | P62942 | protein_coding | tolerated(0.16) | benign(0.029) | TCGA-FI-A2D5-01 | Endometrium | uterine corpus endometrioid carcinoma | Female | <65 | III/IV | Chemotherapy | carboplatinum | PD |
| FKBP1A | SNV | Missense_Mutation | novel | c.263N>G | p.His88Arg | p.H88R | P62942 | protein_coding | tolerated(0.22) | probably_damaging(0.981) | TCGA-66-2763-01 | Lung | lung squamous cell carcinoma | Female | <65 | I/II | Unknown | Unknown | SD |
| FKBP1A | SNV | Missense_Mutation | c.208N>T | p.Gly70Cys | p.G70C | P62942 | protein_coding | deleterious(0) | probably_damaging(0.987) | TCGA-CD-8529-01 | Stomach | stomach adenocarcinoma | Male | >=65 | III/IV | Chemotherapy | epirubicin | CR | |
| FKBP1A | SNV | Missense_Mutation | rs760096309 | c.121N>T | p.Arg41Trp | p.R41W | P62942 | protein_coding | deleterious(0.03) | probably_damaging(0.999) | TCGA-CD-8531-01 | Stomach | stomach adenocarcinoma | Female | >=65 | III/IV | Chemotherapy | epirubicin | CR |
| Page: 1 |
Top |
Related drugs of malignant transformation related genes |
| Identification of chemicals and drugs interact with genes involved in malignant transfromation |
| (DGIdb 4.0) |
| Entrez ID | Symbol | Category | Interaction Types | Drug Claim Name | Drug Name | PMIDs |
| 2280 | FKBP1A | DRUGGABLE GENOME, ENZYME, KINASE | inhibitor | CHEMBL3545142 | OLOCROLIMUS | |
| 2280 | FKBP1A | DRUGGABLE GENOME, ENZYME, KINASE | SCY-641 | RUCLOSPORIN | ||
| 2280 | FKBP1A | DRUGGABLE GENOME, ENZYME, KINASE | AP1903 | RIMIDUCID | ||
| 2280 | FKBP1A | DRUGGABLE GENOME, ENZYME, KINASE | Rapamycin | SIROLIMUS | ||
| 2280 | FKBP1A | DRUGGABLE GENOME, ENZYME, KINASE | SIROLIMUS | SIROLIMUS | ||
| 2280 | FKBP1A | DRUGGABLE GENOME, ENZYME, KINASE | inhibitor | CHEMBL413 | SIROLIMUS | |
| 2280 | FKBP1A | DRUGGABLE GENOME, ENZYME, KINASE | TACROLIMUS | TACROLIMUS | ||
| 2280 | FKBP1A | DRUGGABLE GENOME, ENZYME, KINASE | AZD-8055 | AZD-8055 | 23375793 | |
| 2280 | FKBP1A | DRUGGABLE GENOME, ENZYME, KINASE | inhibitor | 178102653 | SIROLIMUS | |
| 2280 | FKBP1A | DRUGGABLE GENOME, ENZYME, KINASE | EVEROLIMUS | EVEROLIMUS | 24836070 |
| Page: 1 2 3 |

Copyright 2023-Present -The University of Texas Health Science Center at Houston |