
|
|||||
|
 | |
| |
| |
| |
| |
| |
|
Gene: FKBP15 |
Gene summary for FKBP15 |
| Gene information | Species | Human | Gene symbol | FKBP15 | Gene ID | 23307 |
| Gene name | FKBP prolyl isomerase family member 15 | |
| Gene Alias | FKBP133 | |
| Cytomap | 9q32 | |
| Gene Type | protein-coding | GO ID | GO:0000413 | UniProtAcc | Q5T1M5 |
Top |
Malignant transformation analysis |
| Identification of the aberrant gene expression in precancerous and cancerous lesions by comparing the gene expression of stem-like cells in diseased tissues with normal stem cells |
| Entrez ID | Symbol | Replicates | Species | Organ | Tissue | Adj P-value | Log2FC | Malignancy |
| 23307 | FKBP15 | LZE4T | Human | Esophagus | ESCC | 6.63e-05 | 2.03e-01 | 0.0811 |
| 23307 | FKBP15 | LZE7T | Human | Esophagus | ESCC | 3.51e-03 | 1.47e-01 | 0.0667 |
| 23307 | FKBP15 | LZE20T | Human | Esophagus | ESCC | 1.15e-08 | 2.62e-01 | 0.0662 |
| 23307 | FKBP15 | LZE24T | Human | Esophagus | ESCC | 3.60e-11 | 2.23e-01 | 0.0596 |
| 23307 | FKBP15 | P1T-E | Human | Esophagus | ESCC | 3.92e-03 | 2.12e-01 | 0.0875 |
| 23307 | FKBP15 | P2T-E | Human | Esophagus | ESCC | 1.12e-24 | 3.29e-01 | 0.1177 |
| 23307 | FKBP15 | P4T-E | Human | Esophagus | ESCC | 3.49e-16 | 2.68e-01 | 0.1323 |
| 23307 | FKBP15 | P5T-E | Human | Esophagus | ESCC | 2.60e-21 | 3.71e-01 | 0.1327 |
| 23307 | FKBP15 | P8T-E | Human | Esophagus | ESCC | 4.71e-11 | 1.37e-01 | 0.0889 |
| 23307 | FKBP15 | P9T-E | Human | Esophagus | ESCC | 1.10e-05 | 1.40e-01 | 0.1131 |
| 23307 | FKBP15 | P10T-E | Human | Esophagus | ESCC | 4.38e-12 | 2.26e-01 | 0.116 |
| 23307 | FKBP15 | P11T-E | Human | Esophagus | ESCC | 3.72e-12 | 4.36e-01 | 0.1426 |
| 23307 | FKBP15 | P12T-E | Human | Esophagus | ESCC | 5.14e-06 | 1.79e-01 | 0.1122 |
| 23307 | FKBP15 | P15T-E | Human | Esophagus | ESCC | 1.21e-16 | 2.76e-01 | 0.1149 |
| 23307 | FKBP15 | P16T-E | Human | Esophagus | ESCC | 5.93e-08 | 1.29e-01 | 0.1153 |
| 23307 | FKBP15 | P17T-E | Human | Esophagus | ESCC | 8.55e-05 | 1.93e-01 | 0.1278 |
| 23307 | FKBP15 | P20T-E | Human | Esophagus | ESCC | 5.50e-07 | 1.61e-01 | 0.1124 |
| 23307 | FKBP15 | P21T-E | Human | Esophagus | ESCC | 7.22e-20 | 2.90e-01 | 0.1617 |
| 23307 | FKBP15 | P22T-E | Human | Esophagus | ESCC | 1.36e-09 | 1.03e-01 | 0.1236 |
| 23307 | FKBP15 | P23T-E | Human | Esophagus | ESCC | 4.28e-14 | 1.70e-01 | 0.108 |
| Page: 1 2 3 4 5 |
| Tissue | Expression Dynamics | Abbreviation |
| Esophagus | 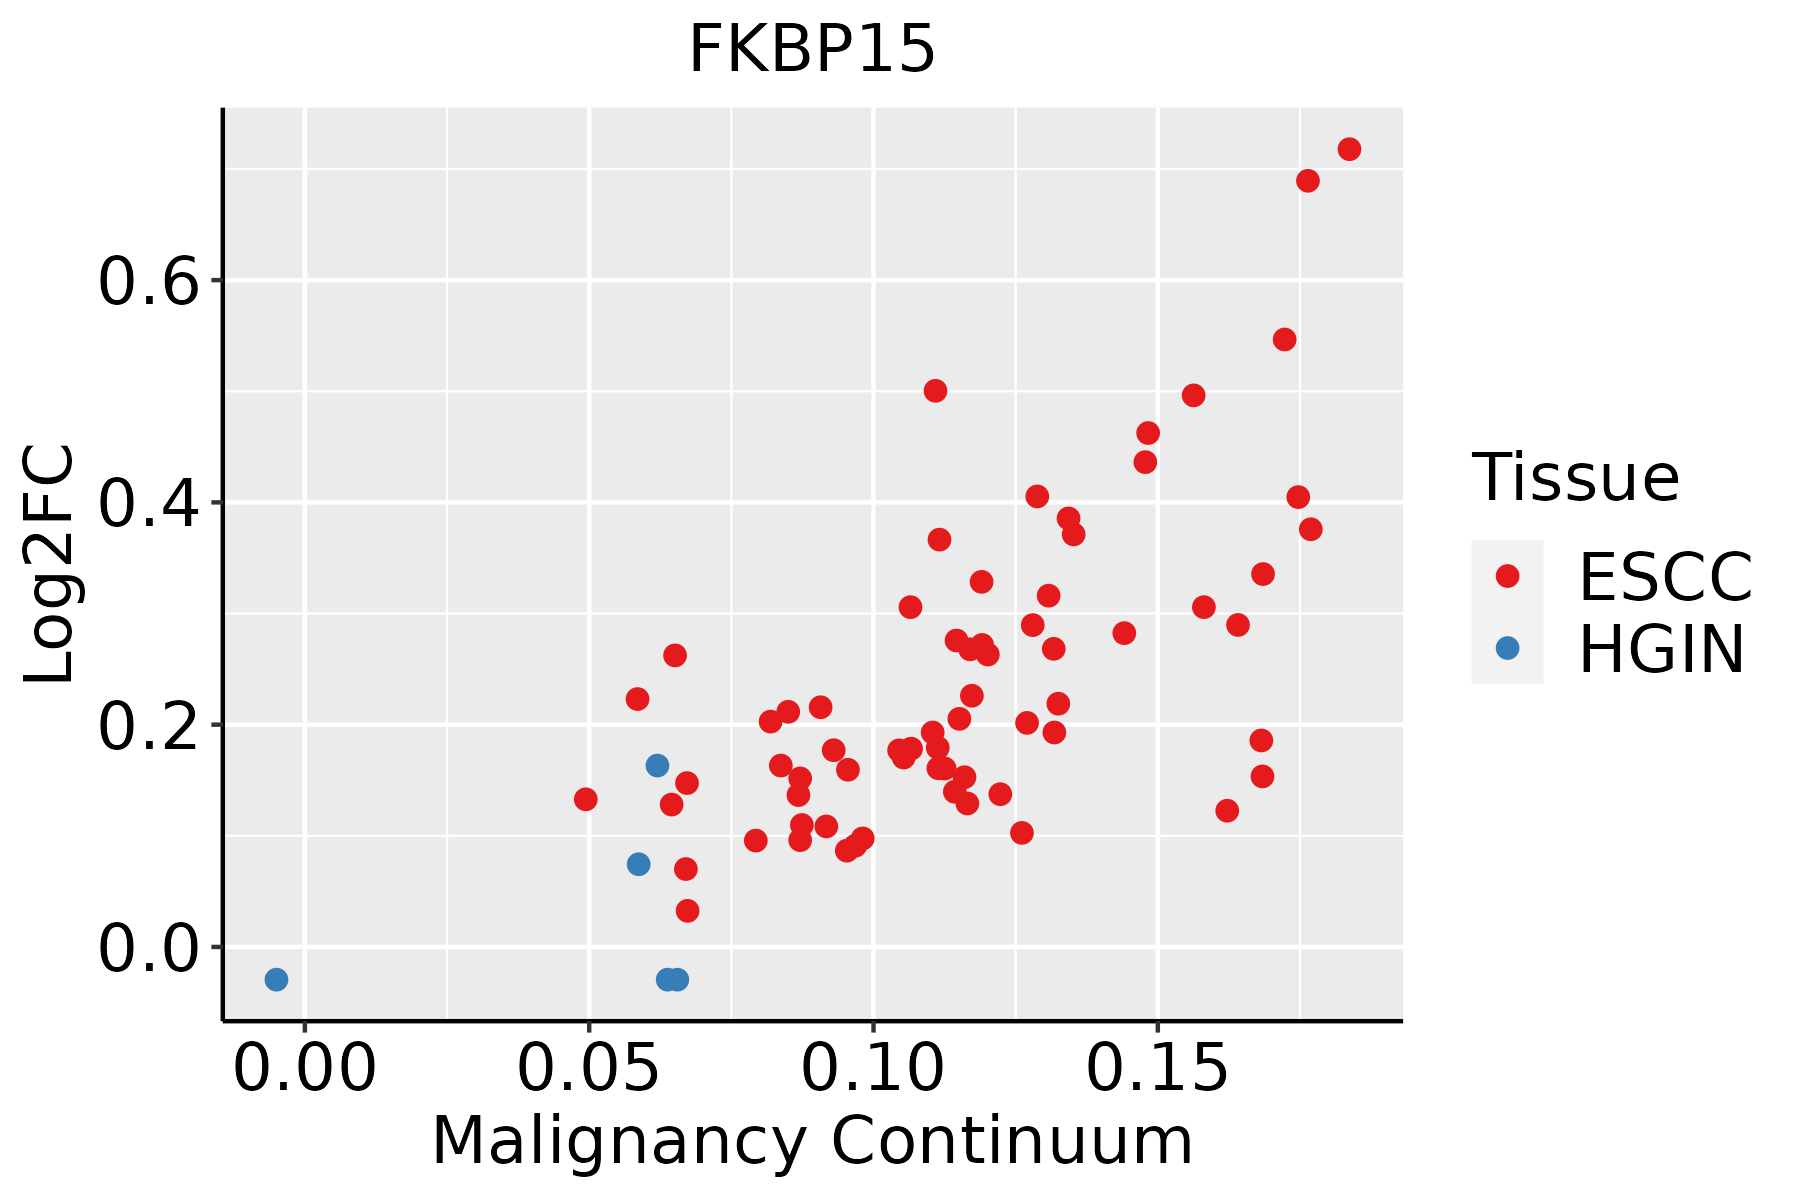 | ESCC: Esophageal squamous cell carcinoma |
| HGIN: High-grade intraepithelial neoplasias | ||
| LGIN: Low-grade intraepithelial neoplasias | ||
| Oral Cavity | 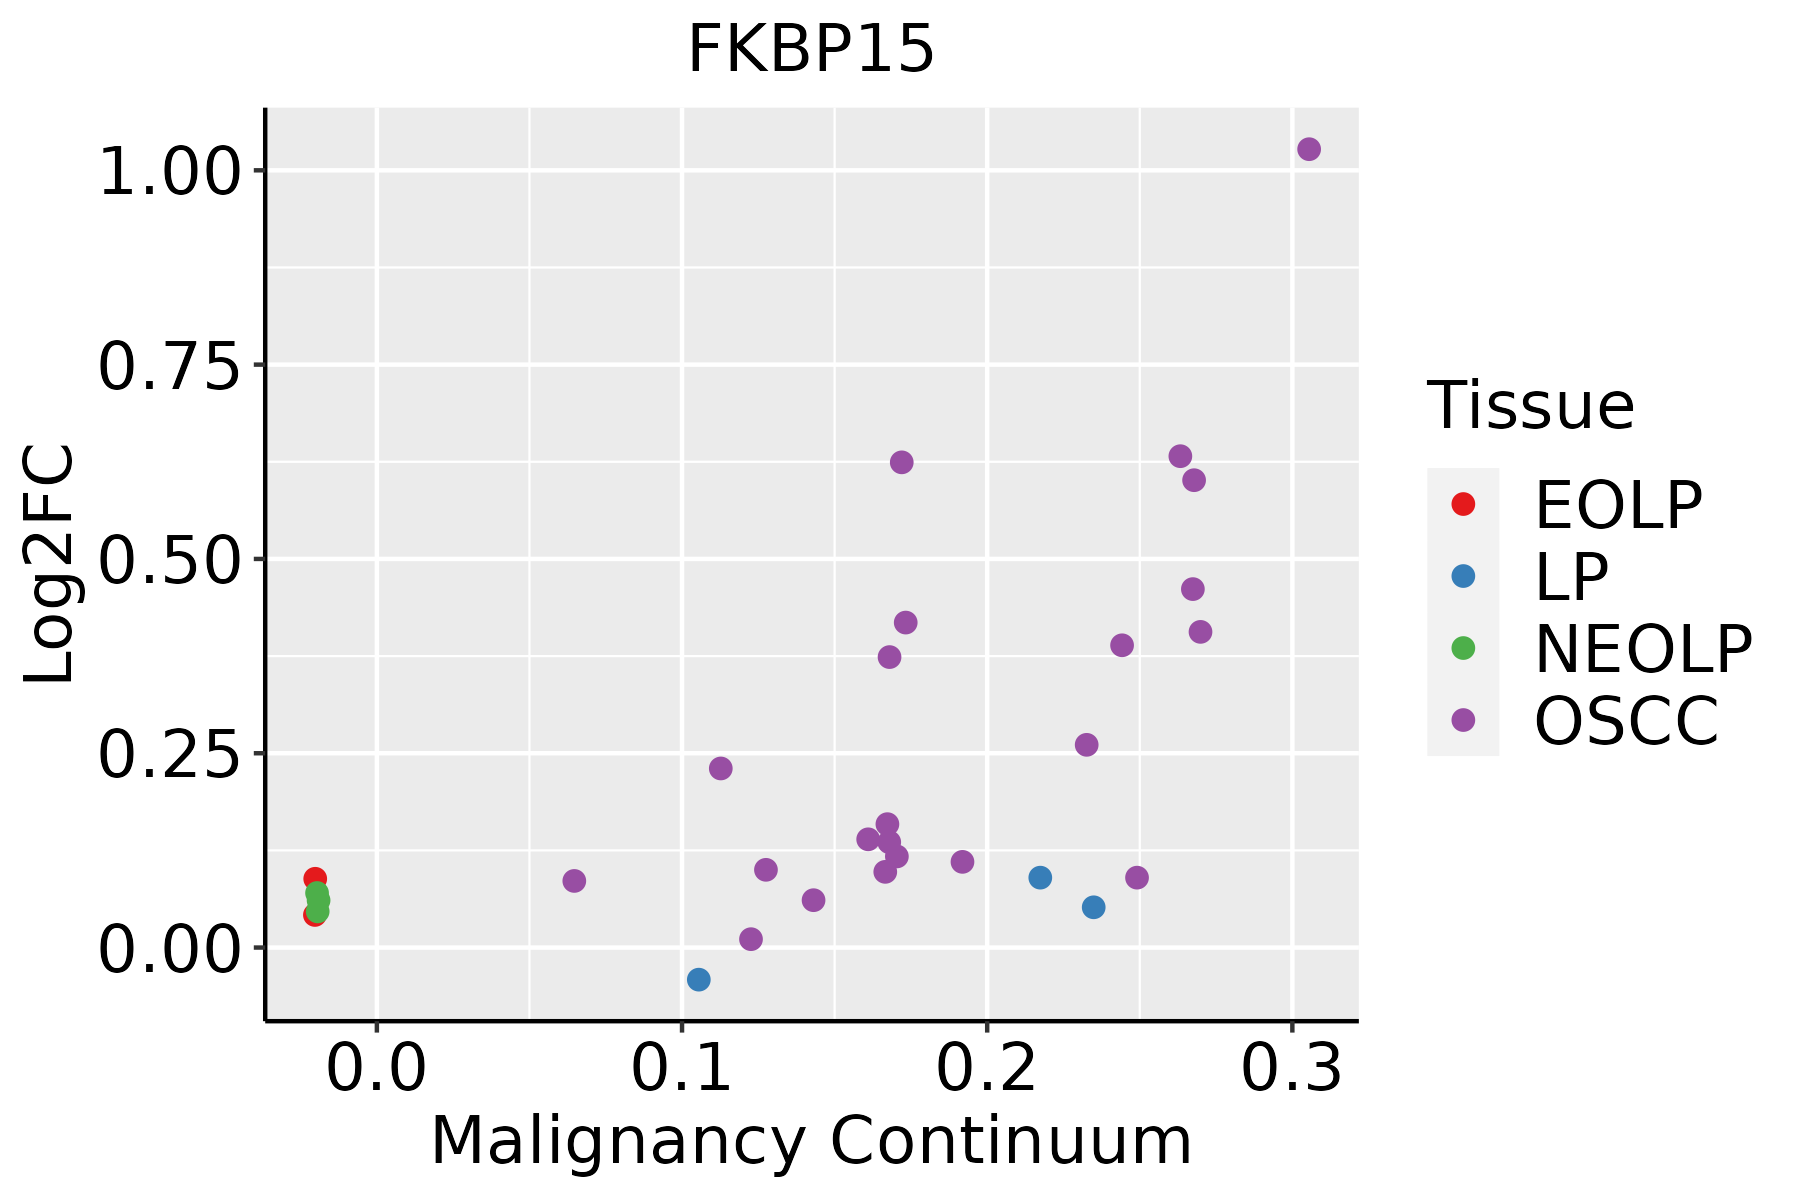 | EOLP: Erosive Oral lichen planus |
| LP: leukoplakia | ||
| NEOLP: Non-erosive oral lichen planus | ||
| OSCC: Oral squamous cell carcinoma | ||
| Skin | 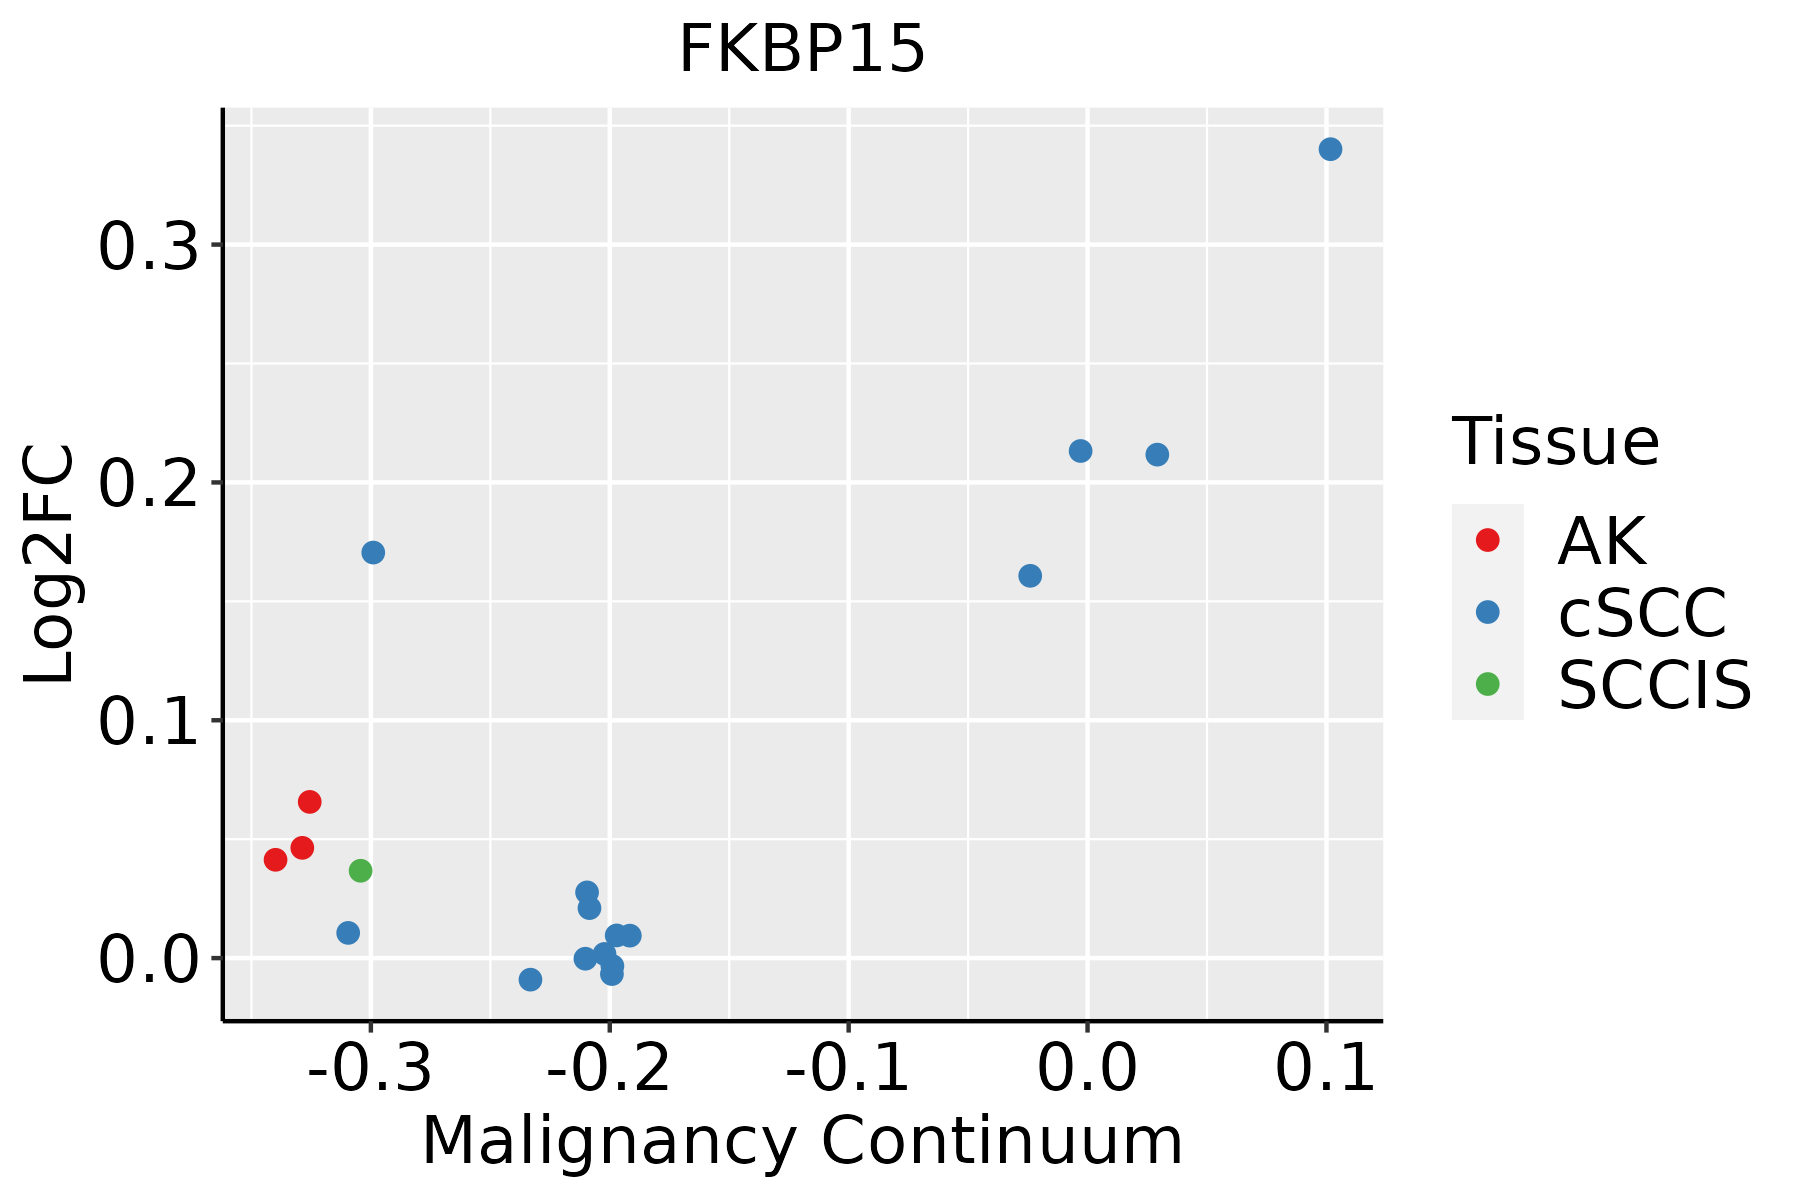 | AK: Actinic keratosis |
| cSCC: Cutaneous squamous cell carcinoma | ||
| SCCIS:squamous cell carcinoma in situ | ||
| Thyroid | 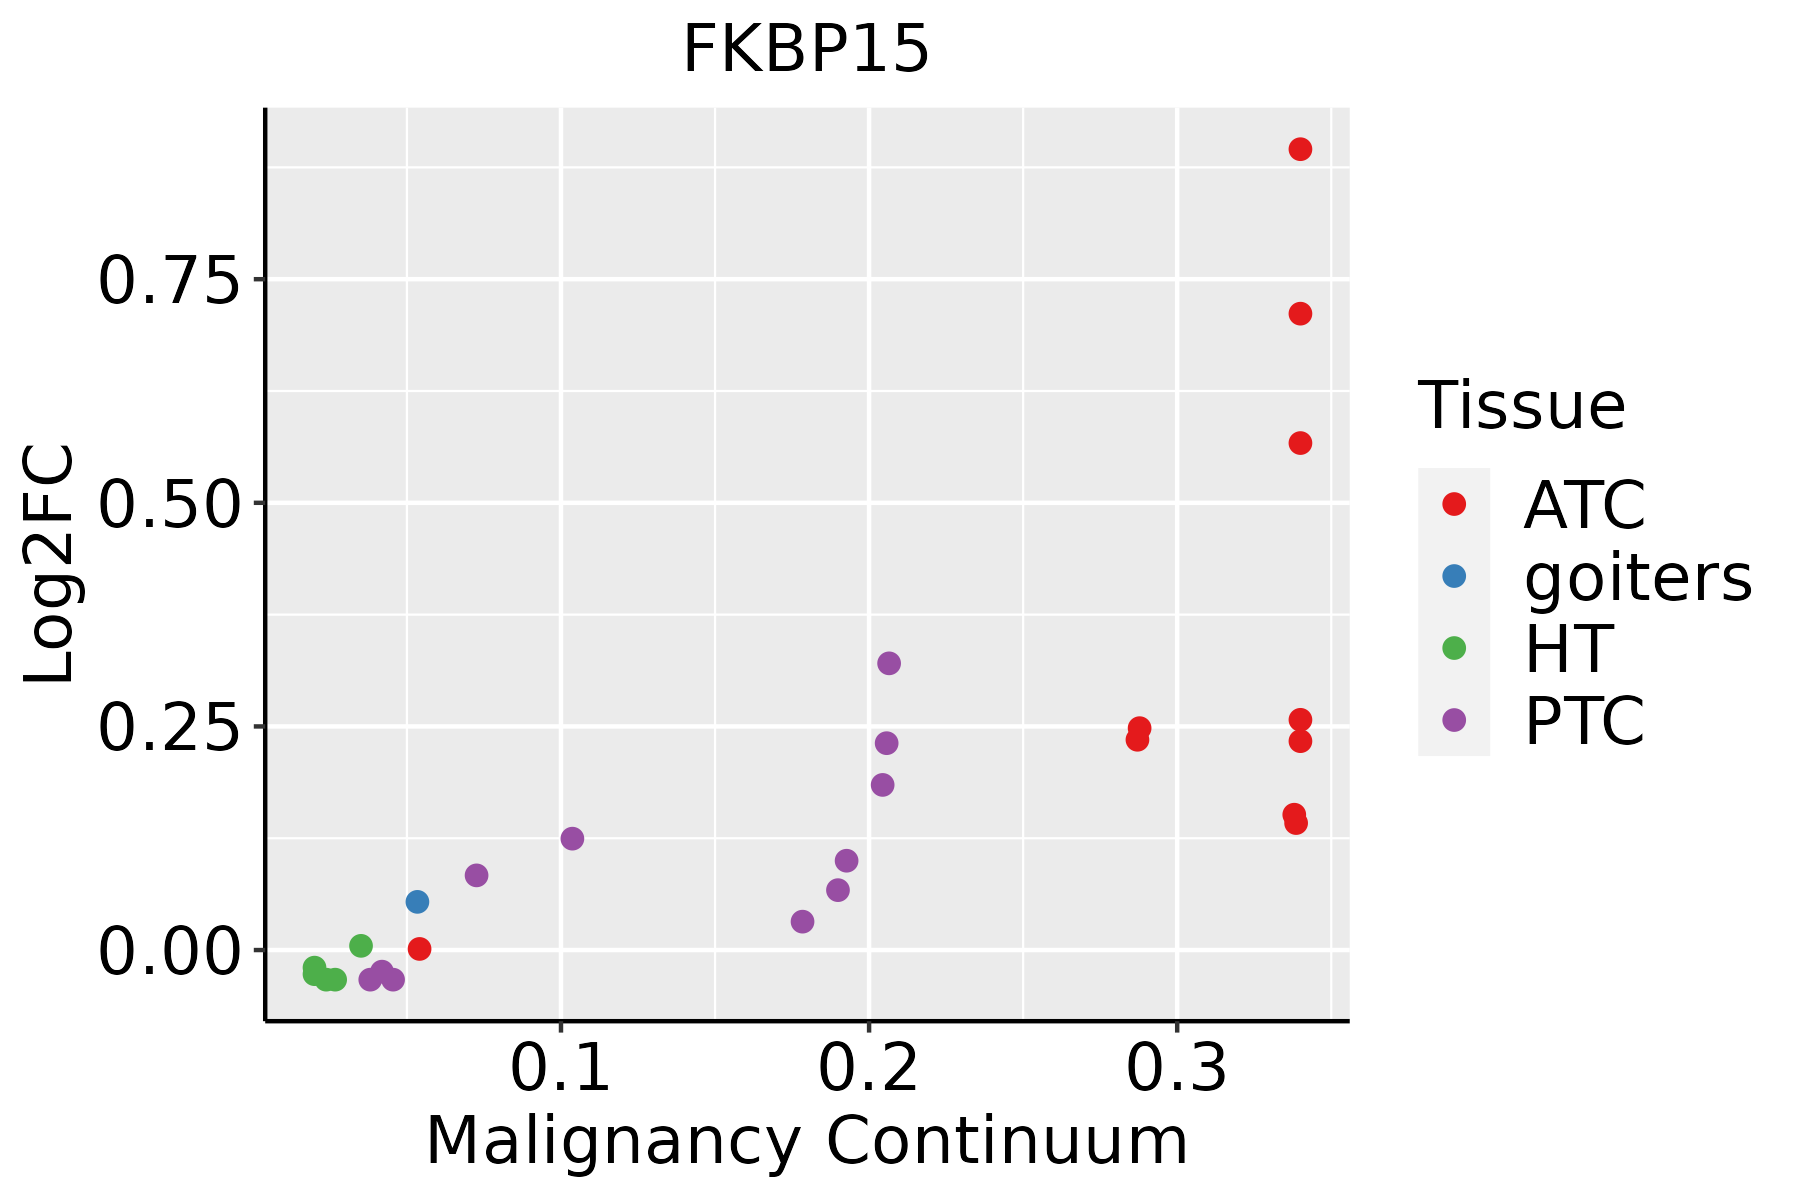 | ATC: Anaplastic thyroid cancer |
| HT: Hashimoto's thyroiditis | ||
| PTC: Papillary thyroid cancer |
| ∗log2FC in expression of this searched gene in stem-like cells from each diseased tissue sample relative to stem-like cells in normal samples in each tissue plotted against the malignancy continuum. Samples are colored based on if they are from different disease stage. |
Top |
Malignant transformation related pathway analysis |
| Find out the enriched GO biological processes and KEGG pathways involved in transition from healthy to precancer to cancer |
| Tissue | Disease Stage | Enriched GO biological Processes |
| Colorectum | AD |  |
| Colorectum | SER |  |
| Colorectum | MSS |  |
| Colorectum | MSI-H |  |
| Colorectum | FAP |  |
| ∗Top 15 enriched GO BP terms are showed in the bar plot of each disease state in each tissue. Each row represents a significant GO biological process which is colored according to the -log10(p.adjust). |
| Page: 1 2 3 4 5 6 7 8 9 |
| GO ID | Tissue | Disease Stage | Description | Gene Ratio | Bg Ratio | pvalue | p.adjust | Count |
| GO:001820816 | Esophagus | ESCC | peptidyl-proline modification | 46/8552 | 58/18723 | 1.59e-07 | 2.51e-06 | 46 |
| GO:000041313 | Esophagus | ESCC | protein peptidyl-prolyl isomerization | 32/8552 | 42/18723 | 5.52e-05 | 4.27e-04 | 32 |
| GO:00182088 | Oral cavity | OSCC | peptidyl-proline modification | 42/7305 | 58/18723 | 2.49e-07 | 3.92e-06 | 42 |
| GO:00004134 | Oral cavity | OSCC | protein peptidyl-prolyl isomerization | 28/7305 | 42/18723 | 2.61e-04 | 1.67e-03 | 28 |
| GO:001820810 | Skin | cSCC | peptidyl-proline modification | 37/4864 | 58/18723 | 1.53e-09 | 5.82e-08 | 37 |
| GO:00004136 | Skin | cSCC | protein peptidyl-prolyl isomerization | 26/4864 | 42/18723 | 9.92e-07 | 1.78e-05 | 26 |
| GO:001820817 | Thyroid | PTC | peptidyl-proline modification | 42/5968 | 58/18723 | 2.71e-10 | 8.91e-09 | 42 |
| GO:00004137 | Thyroid | PTC | protein peptidyl-prolyl isomerization | 30/5968 | 42/18723 | 1.65e-07 | 3.13e-06 | 30 |
| GO:001820818 | Thyroid | ATC | peptidyl-proline modification | 42/6293 | 58/18723 | 1.70e-09 | 4.21e-08 | 42 |
| GO:000041314 | Thyroid | ATC | protein peptidyl-prolyl isomerization | 30/6293 | 42/18723 | 6.06e-07 | 8.44e-06 | 30 |
| Page: 1 |
| Pathway ID | Tissue | Disease Stage | Description | Gene Ratio | Bg Ratio | pvalue | p.adjust | qvalue | Count |
| Page: 1 |
Top |
Cell-cell communication analysis |
| Identification of potential cell-cell interactions between two cell types and their ligand-receptor pairs for different disease states |
| Ligand | Receptor | LRpair | Pathway | Tissue | Disease Stage |
| Page: 1 |
Top |
Single-cell gene regulatory network inference analysis |
| Find out the significant the regulons (TFs) and the target genes of each regulon across cell types for different disease states |
| TF | Cell Type | Tissue | Disease Stage | Target Gene | RSS | Regulon Activity |
| ∗The dot plots of a searched regulon are shown for all cell subpopulations in each disease state of each tissue based on the regulon specific score inferred using pySCENIC and by calculating the average expression. |
| Page: 1 |
Top |
Somatic mutation of malignant transformation related genes |
| Annotation of somatic variants for genes involved in malignant transformation |
| Hugo Symbol | Variant Class | Variant Classification | dbSNP RS | HGVSc | HGVSp | HGVSp Short | SWISSPROT | BIOTYPE | SIFT | PolyPhen | Tumor Sample Barcode | Tissue | Histology | Sex | Age | Stage | Therapy Types | Drugs | Outcome |
| FKBP15 | SNV | Missense_Mutation | novel | c.685N>T | p.Arg229Cys | p.R229C | Q5T1M5 | protein_coding | deleterious(0) | probably_damaging(1) | TCGA-AN-A046-01 | Breast | breast invasive carcinoma | Female | >=65 | I/II | Unknown | Unknown | SD |
| FKBP15 | SNV | Missense_Mutation | c.211A>G | p.Thr71Ala | p.T71A | Q5T1M5 | protein_coding | tolerated(1) | benign(0) | TCGA-AN-A0AK-01 | Breast | breast invasive carcinoma | Female | >=65 | I/II | Unknown | Unknown | SD | |
| FKBP15 | SNV | Missense_Mutation | novel | c.847G>C | p.Glu283Gln | p.E283Q | Q5T1M5 | protein_coding | deleterious(0) | probably_damaging(1) | TCGA-AN-A0AR-01 | Breast | breast invasive carcinoma | Female | <65 | I/II | Unknown | Unknown | SD |
| FKBP15 | SNV | Missense_Mutation | rs745583940 | c.2294N>A | p.Arg765His | p.R765H | Q5T1M5 | protein_coding | deleterious(0) | possibly_damaging(0.886) | TCGA-AO-A1KP-01 | Breast | breast invasive carcinoma | Female | >=65 | I/II | Chemotherapy | fluorouracil | SD |
| FKBP15 | SNV | Missense_Mutation | c.1768N>C | p.Glu590Gln | p.E590Q | Q5T1M5 | protein_coding | deleterious(0.04) | probably_damaging(0.998) | TCGA-AR-A1AO-01 | Breast | breast invasive carcinoma | Female | <65 | I/II | Chemotherapy | doxorubicin | SD | |
| FKBP15 | SNV | Missense_Mutation | c.2228N>C | p.Leu743Pro | p.L743P | Q5T1M5 | protein_coding | deleterious(0) | probably_damaging(0.957) | TCGA-BH-A0HA-01 | Breast | breast invasive carcinoma | Female | <65 | I/II | Unknown | Unknown | SD | |
| FKBP15 | SNV | Missense_Mutation | rs374222379 | c.427T>C | p.Tyr143His | p.Y143H | Q5T1M5 | protein_coding | deleterious(0.01) | probably_damaging(0.998) | TCGA-D8-A140-01 | Breast | breast invasive carcinoma | Female | <65 | I/II | Chemotherapy | doxorubicin+cyclophosphamid | SD |
| FKBP15 | deletion | In_Frame_Del | novel | c.2969_2992delNNNNNNNNNNNNNNNNNNNNNNNN | p.Glu990_Gln997del | p.E990_Q997del | Q5T1M5 | protein_coding | TCGA-A2-A04P-01 | Breast | breast invasive carcinoma | Female | <65 | III/IV | Chemotherapy | taxol | PD | ||
| FKBP15 | insertion | Nonsense_Mutation | novel | c.1955_1956insAACAAGCTAGAGCTGATGATGGTTCTCTTGTTCCTAAGAAC | p.Ser653ThrfsTer3 | p.S653Tfs*3 | Q5T1M5 | protein_coding | TCGA-B6-A0IK-01 | Breast | breast invasive carcinoma | Female | <65 | III/IV | Unknown | Unknown | PD | ||
| FKBP15 | insertion | Nonsense_Mutation | novel | c.3528_3529insGCTTAGCCCCACATTGGAATGCTGAAGCCTTAGTTTTCCC | p.Leu1177AlafsTer2 | p.L1177Afs*2 | Q5T1M5 | protein_coding | TCGA-BH-A0HU-01 | Breast | breast invasive carcinoma | Female | <65 | I/II | Chemotherapy | docetaxel | SD |
| Page: 1 2 3 4 5 6 7 8 9 10 11 |
Top |
Related drugs of malignant transformation related genes |
| Identification of chemicals and drugs interact with genes involved in malignant transfromation |
| (DGIdb 4.0) |
| Entrez ID | Symbol | Category | Interaction Types | Drug Claim Name | Drug Name | PMIDs |
| Page: 1 |

Copyright 2023-Present -The University of Texas Health Science Center at Houston |