
|
|||||
|
 | |
| |
| |
| |
| |
| |
|
Gene: FKBP14 |
Gene summary for FKBP14 |
| Gene information | Species | Human | Gene symbol | FKBP14 | Gene ID | 55033 |
| Gene name | FKBP prolyl isomerase 14 | |
| Gene Alias | EDSKMH | |
| Cytomap | 7p14.3 | |
| Gene Type | protein-coding | GO ID | GO:0000413 | UniProtAcc | A0A090N7V8 |
Top |
Malignant transformation analysis |
| Identification of the aberrant gene expression in precancerous and cancerous lesions by comparing the gene expression of stem-like cells in diseased tissues with normal stem cells |
| Entrez ID | Symbol | Replicates | Species | Organ | Tissue | Adj P-value | Log2FC | Malignancy |
| 55033 | FKBP14 | LZE4T | Human | Esophagus | ESCC | 1.49e-11 | 3.55e-01 | 0.0811 |
| 55033 | FKBP14 | LZE8T | Human | Esophagus | ESCC | 3.11e-03 | 1.37e-01 | 0.067 |
| 55033 | FKBP14 | LZE24T | Human | Esophagus | ESCC | 7.81e-07 | 1.47e-01 | 0.0596 |
| 55033 | FKBP14 | P1T-E | Human | Esophagus | ESCC | 3.58e-06 | 3.62e-01 | 0.0875 |
| 55033 | FKBP14 | P2T-E | Human | Esophagus | ESCC | 1.08e-18 | 3.55e-01 | 0.1177 |
| 55033 | FKBP14 | P4T-E | Human | Esophagus | ESCC | 3.57e-16 | 4.69e-01 | 0.1323 |
| 55033 | FKBP14 | P8T-E | Human | Esophagus | ESCC | 3.61e-08 | 1.30e-01 | 0.0889 |
| 55033 | FKBP14 | P9T-E | Human | Esophagus | ESCC | 5.50e-07 | 1.74e-01 | 0.1131 |
| 55033 | FKBP14 | P10T-E | Human | Esophagus | ESCC | 4.71e-13 | 2.94e-01 | 0.116 |
| 55033 | FKBP14 | P11T-E | Human | Esophagus | ESCC | 2.31e-14 | 6.51e-01 | 0.1426 |
| 55033 | FKBP14 | P12T-E | Human | Esophagus | ESCC | 8.42e-12 | 2.07e-01 | 0.1122 |
| 55033 | FKBP14 | P15T-E | Human | Esophagus | ESCC | 3.85e-09 | 6.65e-02 | 0.1149 |
| 55033 | FKBP14 | P16T-E | Human | Esophagus | ESCC | 1.47e-15 | 2.87e-01 | 0.1153 |
| 55033 | FKBP14 | P17T-E | Human | Esophagus | ESCC | 2.11e-04 | 2.44e-01 | 0.1278 |
| 55033 | FKBP14 | P19T-E | Human | Esophagus | ESCC | 6.99e-04 | 5.12e-01 | 0.1662 |
| 55033 | FKBP14 | P20T-E | Human | Esophagus | ESCC | 1.66e-13 | 1.41e-01 | 0.1124 |
| 55033 | FKBP14 | P21T-E | Human | Esophagus | ESCC | 1.19e-15 | 3.64e-01 | 0.1617 |
| 55033 | FKBP14 | P22T-E | Human | Esophagus | ESCC | 2.04e-08 | 1.67e-01 | 0.1236 |
| 55033 | FKBP14 | P23T-E | Human | Esophagus | ESCC | 9.94e-15 | 3.21e-01 | 0.108 |
| 55033 | FKBP14 | P24T-E | Human | Esophagus | ESCC | 1.02e-14 | 1.38e-01 | 0.1287 |
| Page: 1 2 3 4 5 |
| Tissue | Expression Dynamics | Abbreviation |
| Esophagus |  | ESCC: Esophageal squamous cell carcinoma |
| HGIN: High-grade intraepithelial neoplasias | ||
| LGIN: Low-grade intraepithelial neoplasias | ||
| Liver | 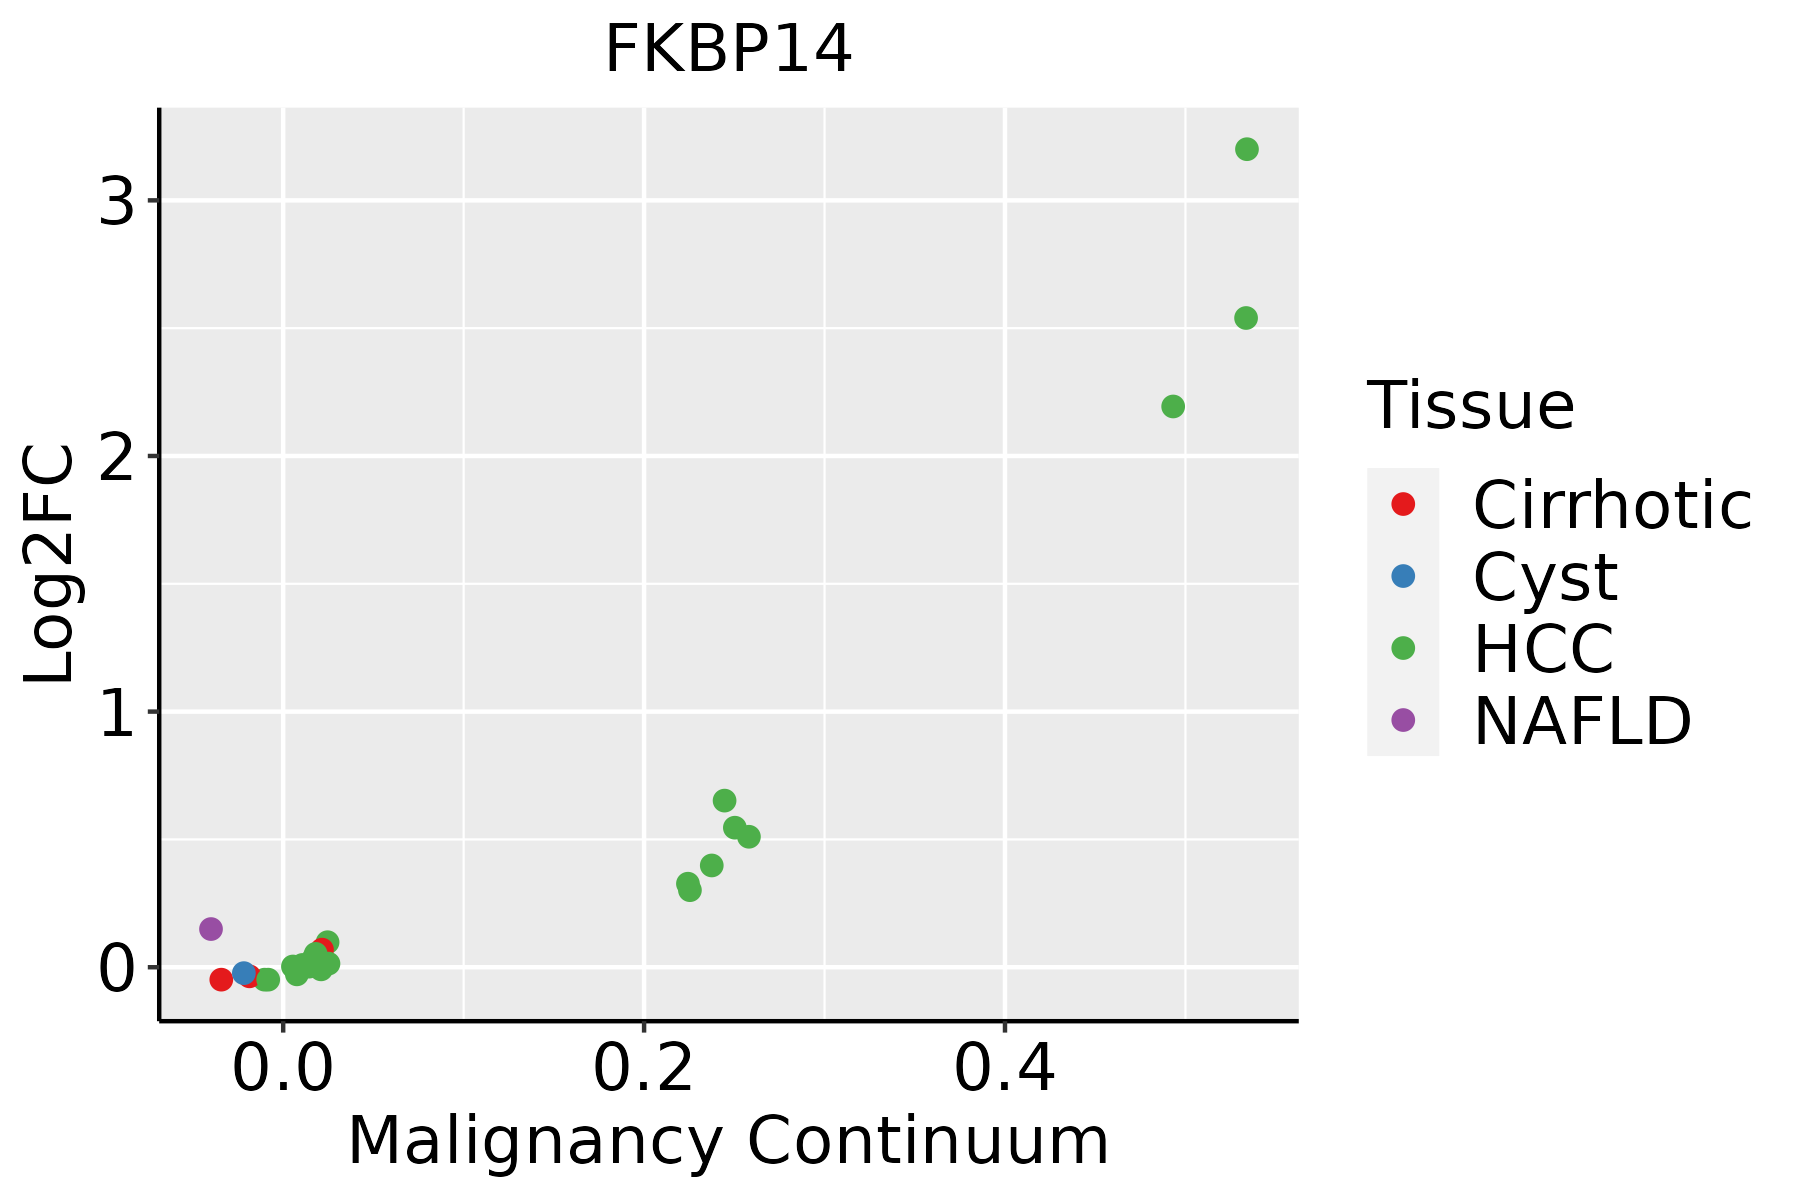 | HCC: Hepatocellular carcinoma |
| NAFLD: Non-alcoholic fatty liver disease | ||
| Oral Cavity | 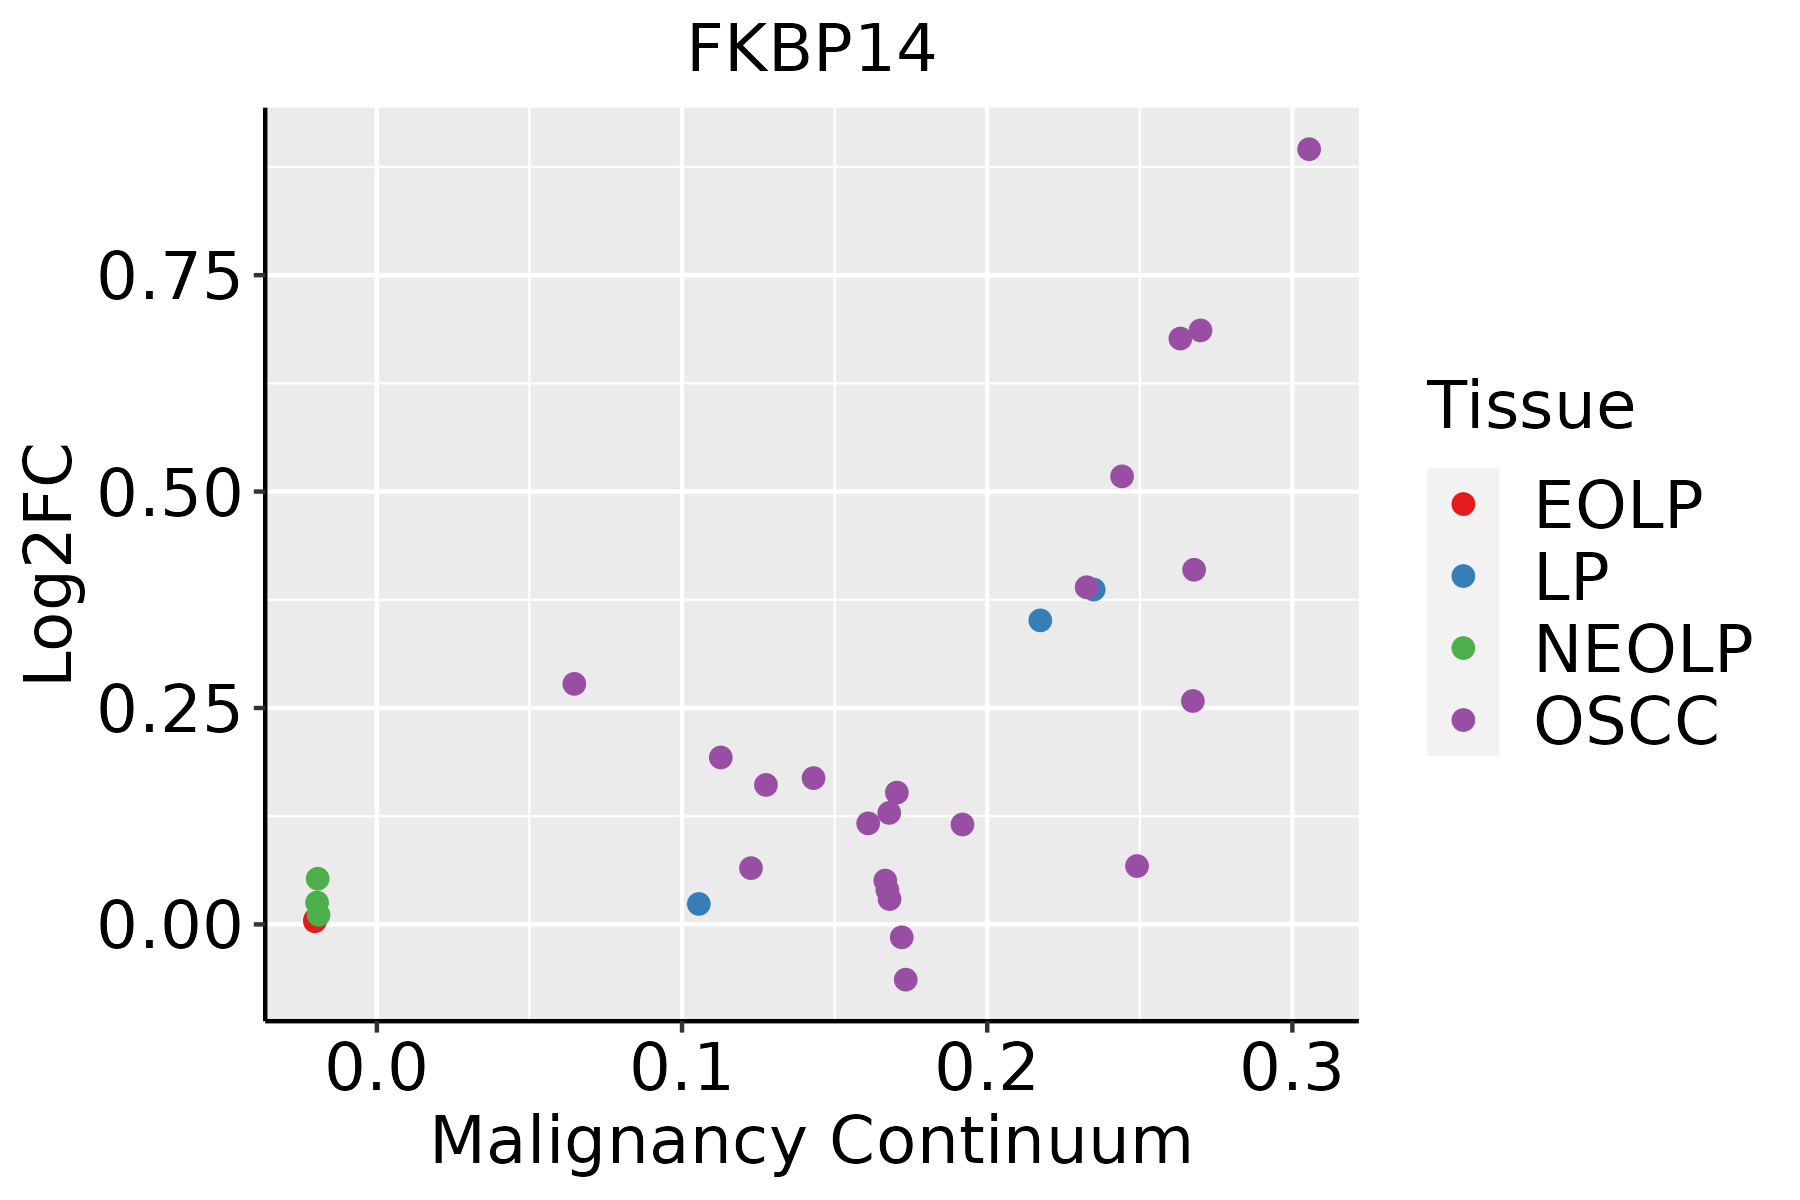 | EOLP: Erosive Oral lichen planus |
| LP: leukoplakia | ||
| NEOLP: Non-erosive oral lichen planus | ||
| OSCC: Oral squamous cell carcinoma | ||
| Thyroid |  | ATC: Anaplastic thyroid cancer |
| HT: Hashimoto's thyroiditis | ||
| PTC: Papillary thyroid cancer |
| ∗log2FC in expression of this searched gene in stem-like cells from each diseased tissue sample relative to stem-like cells in normal samples in each tissue plotted against the malignancy continuum. Samples are colored based on if they are from different disease stage. |
Top |
Malignant transformation related pathway analysis |
| Find out the enriched GO biological processes and KEGG pathways involved in transition from healthy to precancer to cancer |
| Tissue | Disease Stage | Enriched GO biological Processes |
| Colorectum | AD |  |
| Colorectum | SER |  |
| Colorectum | MSS |  |
| Colorectum | MSI-H |  |
| Colorectum | FAP |  |
| ∗Top 15 enriched GO BP terms are showed in the bar plot of each disease state in each tissue. Each row represents a significant GO biological process which is colored according to the -log10(p.adjust). |
| Page: 1 2 3 4 5 6 7 8 9 |
| GO ID | Tissue | Disease Stage | Description | Gene Ratio | Bg Ratio | pvalue | p.adjust | Count |
| GO:001820816 | Esophagus | ESCC | peptidyl-proline modification | 46/8552 | 58/18723 | 1.59e-07 | 2.51e-06 | 46 |
| GO:000041313 | Esophagus | ESCC | protein peptidyl-prolyl isomerization | 32/8552 | 42/18723 | 5.52e-05 | 4.27e-04 | 32 |
| GO:001820811 | Liver | HCC | peptidyl-proline modification | 42/7958 | 58/18723 | 3.73e-06 | 4.85e-05 | 42 |
| GO:00004131 | Liver | HCC | protein peptidyl-prolyl isomerization | 31/7958 | 42/18723 | 3.83e-05 | 3.80e-04 | 31 |
| GO:00182088 | Oral cavity | OSCC | peptidyl-proline modification | 42/7305 | 58/18723 | 2.49e-07 | 3.92e-06 | 42 |
| GO:00004134 | Oral cavity | OSCC | protein peptidyl-prolyl isomerization | 28/7305 | 42/18723 | 2.61e-04 | 1.67e-03 | 28 |
| GO:001820817 | Thyroid | PTC | peptidyl-proline modification | 42/5968 | 58/18723 | 2.71e-10 | 8.91e-09 | 42 |
| GO:00004137 | Thyroid | PTC | protein peptidyl-prolyl isomerization | 30/5968 | 42/18723 | 1.65e-07 | 3.13e-06 | 30 |
| GO:001820818 | Thyroid | ATC | peptidyl-proline modification | 42/6293 | 58/18723 | 1.70e-09 | 4.21e-08 | 42 |
| GO:000041314 | Thyroid | ATC | protein peptidyl-prolyl isomerization | 30/6293 | 42/18723 | 6.06e-07 | 8.44e-06 | 30 |
| Page: 1 |
| Pathway ID | Tissue | Disease Stage | Description | Gene Ratio | Bg Ratio | pvalue | p.adjust | qvalue | Count |
| Page: 1 |
Top |
Cell-cell communication analysis |
| Identification of potential cell-cell interactions between two cell types and their ligand-receptor pairs for different disease states |
| Ligand | Receptor | LRpair | Pathway | Tissue | Disease Stage |
| Page: 1 |
Top |
Single-cell gene regulatory network inference analysis |
| Find out the significant the regulons (TFs) and the target genes of each regulon across cell types for different disease states |
| TF | Cell Type | Tissue | Disease Stage | Target Gene | RSS | Regulon Activity |
| ∗The dot plots of a searched regulon are shown for all cell subpopulations in each disease state of each tissue based on the regulon specific score inferred using pySCENIC and by calculating the average expression. |
| Page: 1 |
Top |
Somatic mutation of malignant transformation related genes |
| Annotation of somatic variants for genes involved in malignant transformation |
| Hugo Symbol | Variant Class | Variant Classification | dbSNP RS | HGVSc | HGVSp | HGVSp Short | SWISSPROT | BIOTYPE | SIFT | PolyPhen | Tumor Sample Barcode | Tissue | Histology | Sex | Age | Stage | Therapy Types | Drugs | Outcome |
| FKBP14 | SNV | Missense_Mutation | novel | c.628G>C | p.Glu210Gln | p.E210Q | Q9NWM8 | protein_coding | deleterious(0) | probably_damaging(0.991) | TCGA-C5-A7UI-01 | Cervix | cervical & endocervical cancer | Female | <65 | I/II | Unknown | Unknown | SD |
| FKBP14 | SNV | Missense_Mutation | rs747727076 | c.404N>A | p.Arg135Gln | p.R135Q | Q9NWM8 | protein_coding | tolerated(0.4) | benign(0.259) | TCGA-AA-3510-01 | Colorectum | colon adenocarcinoma | Male | >=65 | I/II | Unknown | Unknown | SD |
| FKBP14 | SNV | Missense_Mutation | novel | c.361C>A | p.Pro121Thr | p.P121T | Q9NWM8 | protein_coding | deleterious(0) | probably_damaging(0.999) | TCGA-AA-3950-01 | Colorectum | colon adenocarcinoma | Female | >=65 | I/II | Unknown | Unknown | SD |
| FKBP14 | SNV | Missense_Mutation | c.550G>T | p.Val184Leu | p.V184L | Q9NWM8 | protein_coding | tolerated(0.53) | probably_damaging(0.992) | TCGA-CK-6751-01 | Colorectum | colon adenocarcinoma | Female | >=65 | I/II | Unknown | Unknown | SD | |
| FKBP14 | SNV | Missense_Mutation | c.160G>T | p.Gly54Cys | p.G54C | Q9NWM8 | protein_coding | deleterious(0) | probably_damaging(1) | TCGA-AG-A02N-01 | Colorectum | rectum adenocarcinoma | Male | >=65 | I/II | Chemotherapy | folinic | CR | |
| FKBP14 | SNV | Missense_Mutation | c.223N>T | p.Ile75Phe | p.I75F | Q9NWM8 | protein_coding | tolerated(0.72) | benign(0.104) | TCGA-EI-6508-01 | Colorectum | rectum adenocarcinoma | Female | <65 | III/IV | Chemotherapy | oxaliplatin | SD | |
| FKBP14 | SNV | Missense_Mutation | rs747727076 | c.404G>A | p.Arg135Gln | p.R135Q | Q9NWM8 | protein_coding | tolerated(0.4) | benign(0.259) | TCGA-A5-A2K5-01 | Endometrium | uterine corpus endometrioid carcinoma | Female | >=65 | I/II | Unknown | Unknown | SD |
| FKBP14 | SNV | Missense_Mutation | c.84A>C | p.Lys28Asn | p.K28N | Q9NWM8 | protein_coding | deleterious(0) | benign(0.386) | TCGA-AP-A056-01 | Endometrium | uterine corpus endometrioid carcinoma | Female | <65 | I/II | Unknown | Unknown | SD | |
| FKBP14 | SNV | Missense_Mutation | novel | c.580N>A | p.Asp194Asn | p.D194N | Q9NWM8 | protein_coding | tolerated(0.14) | probably_damaging(0.999) | TCGA-AX-A06F-01 | Endometrium | uterine corpus endometrioid carcinoma | Female | <65 | III/IV | Chemotherapy | carboplatin | SD |
| FKBP14 | SNV | Missense_Mutation | c.47C>A | p.Ser16Tyr | p.S16Y | Q9NWM8 | protein_coding | tolerated(1) | benign(0) | TCGA-AX-A0J0-01 | Endometrium | uterine corpus endometrioid carcinoma | Female | <65 | I/II | Unknown | Unknown | SD |
| Page: 1 2 3 |
Top |
Related drugs of malignant transformation related genes |
| Identification of chemicals and drugs interact with genes involved in malignant transfromation |
| (DGIdb 4.0) |
| Entrez ID | Symbol | Category | Interaction Types | Drug Claim Name | Drug Name | PMIDs |
| Page: 1 |

Copyright 2023-Present -The University of Texas Health Science Center at Houston |