
|
|||||
|
 | |
| |
| |
| |
| |
| |
|
Gene: FKBP10 |
Gene summary for FKBP10 |
| Gene information | Species | Human | Gene symbol | FKBP10 | Gene ID | 60681 |
| Gene name | FKBP prolyl isomerase 10 | |
| Gene Alias | BRKS1 | |
| Cytomap | 17q21.2 | |
| Gene Type | protein-coding | GO ID | GO:0000413 | UniProtAcc | A0A024R1W3 |
Top |
Malignant transformation analysis |
| Identification of the aberrant gene expression in precancerous and cancerous lesions by comparing the gene expression of stem-like cells in diseased tissues with normal stem cells |
| Entrez ID | Symbol | Replicates | Species | Organ | Tissue | Adj P-value | Log2FC | Malignancy |
| 60681 | FKBP10 | HTA11_2487_2000001011 | Human | Colorectum | SER | 1.14e-02 | 1.98e-01 | -0.1808 |
| 60681 | FKBP10 | HTA11_696_2000001011 | Human | Colorectum | AD | 3.61e-02 | 1.02e-01 | -0.1464 |
| 60681 | FKBP10 | HTA11_4255_2000001011 | Human | Colorectum | SER | 3.40e-03 | 3.08e-01 | 0.0446 |
| 60681 | FKBP10 | HTA11_8622_2000001021 | Human | Colorectum | SER | 8.37e-05 | 2.47e-01 | 0.0528 |
| 60681 | FKBP10 | HTA11_6818_2000001021 | Human | Colorectum | AD | 1.37e-04 | 1.94e-01 | 0.0588 |
| 60681 | FKBP10 | HTA11_99999965062_69753 | Human | Colorectum | MSI-H | 7.89e-03 | 3.79e-01 | 0.3487 |
| 60681 | FKBP10 | HTA11_99999965104_69814 | Human | Colorectum | MSS | 1.05e-22 | 6.06e-01 | 0.281 |
| 60681 | FKBP10 | HTA11_99999973899_84307 | Human | Colorectum | MSS | 3.94e-18 | 7.20e-01 | 0.2585 |
| 60681 | FKBP10 | HTA11_99999974143_84620 | Human | Colorectum | MSS | 3.80e-25 | 4.66e-01 | 0.3005 |
| 60681 | FKBP10 | A015-C-006 | Human | Colorectum | FAP | 3.48e-02 | 2.68e-01 | -0.0994 |
| 60681 | FKBP10 | AEH-subject1 | Human | Endometrium | AEH | 9.86e-33 | -5.13e-01 | -0.3059 |
| 60681 | FKBP10 | AEH-subject2 | Human | Endometrium | AEH | 1.72e-30 | -4.86e-01 | -0.2525 |
| 60681 | FKBP10 | AEH-subject3 | Human | Endometrium | AEH | 6.15e-20 | -4.91e-01 | -0.2576 |
| 60681 | FKBP10 | AEH-subject4 | Human | Endometrium | AEH | 4.39e-18 | -4.30e-01 | -0.2657 |
| 60681 | FKBP10 | AEH-subject5 | Human | Endometrium | AEH | 1.14e-23 | -5.01e-01 | -0.2953 |
| 60681 | FKBP10 | EEC-subject1 | Human | Endometrium | EEC | 5.44e-23 | -4.99e-01 | -0.2682 |
| 60681 | FKBP10 | EEC-subject2 | Human | Endometrium | EEC | 7.46e-29 | -5.17e-01 | -0.2607 |
| 60681 | FKBP10 | EEC-subject3 | Human | Endometrium | EEC | 1.02e-31 | -4.92e-01 | -0.2525 |
| 60681 | FKBP10 | EEC-subject4 | Human | Endometrium | EEC | 4.78e-26 | -5.04e-01 | -0.2571 |
| 60681 | FKBP10 | EEC-subject5 | Human | Endometrium | EEC | 6.96e-32 | -5.16e-01 | -0.249 |
| Page: 1 2 3 4 5 |
| Tissue | Expression Dynamics | Abbreviation |
| Colorectum (GSE201348) |  | FAP: Familial adenomatous polyposis |
| CRC: Colorectal cancer | ||
| Colorectum (HTA11) |  | AD: Adenomas |
| SER: Sessile serrated lesions | ||
| MSI-H: Microsatellite-high colorectal cancer | ||
| MSS: Microsatellite stable colorectal cancer | ||
| Endometrium | 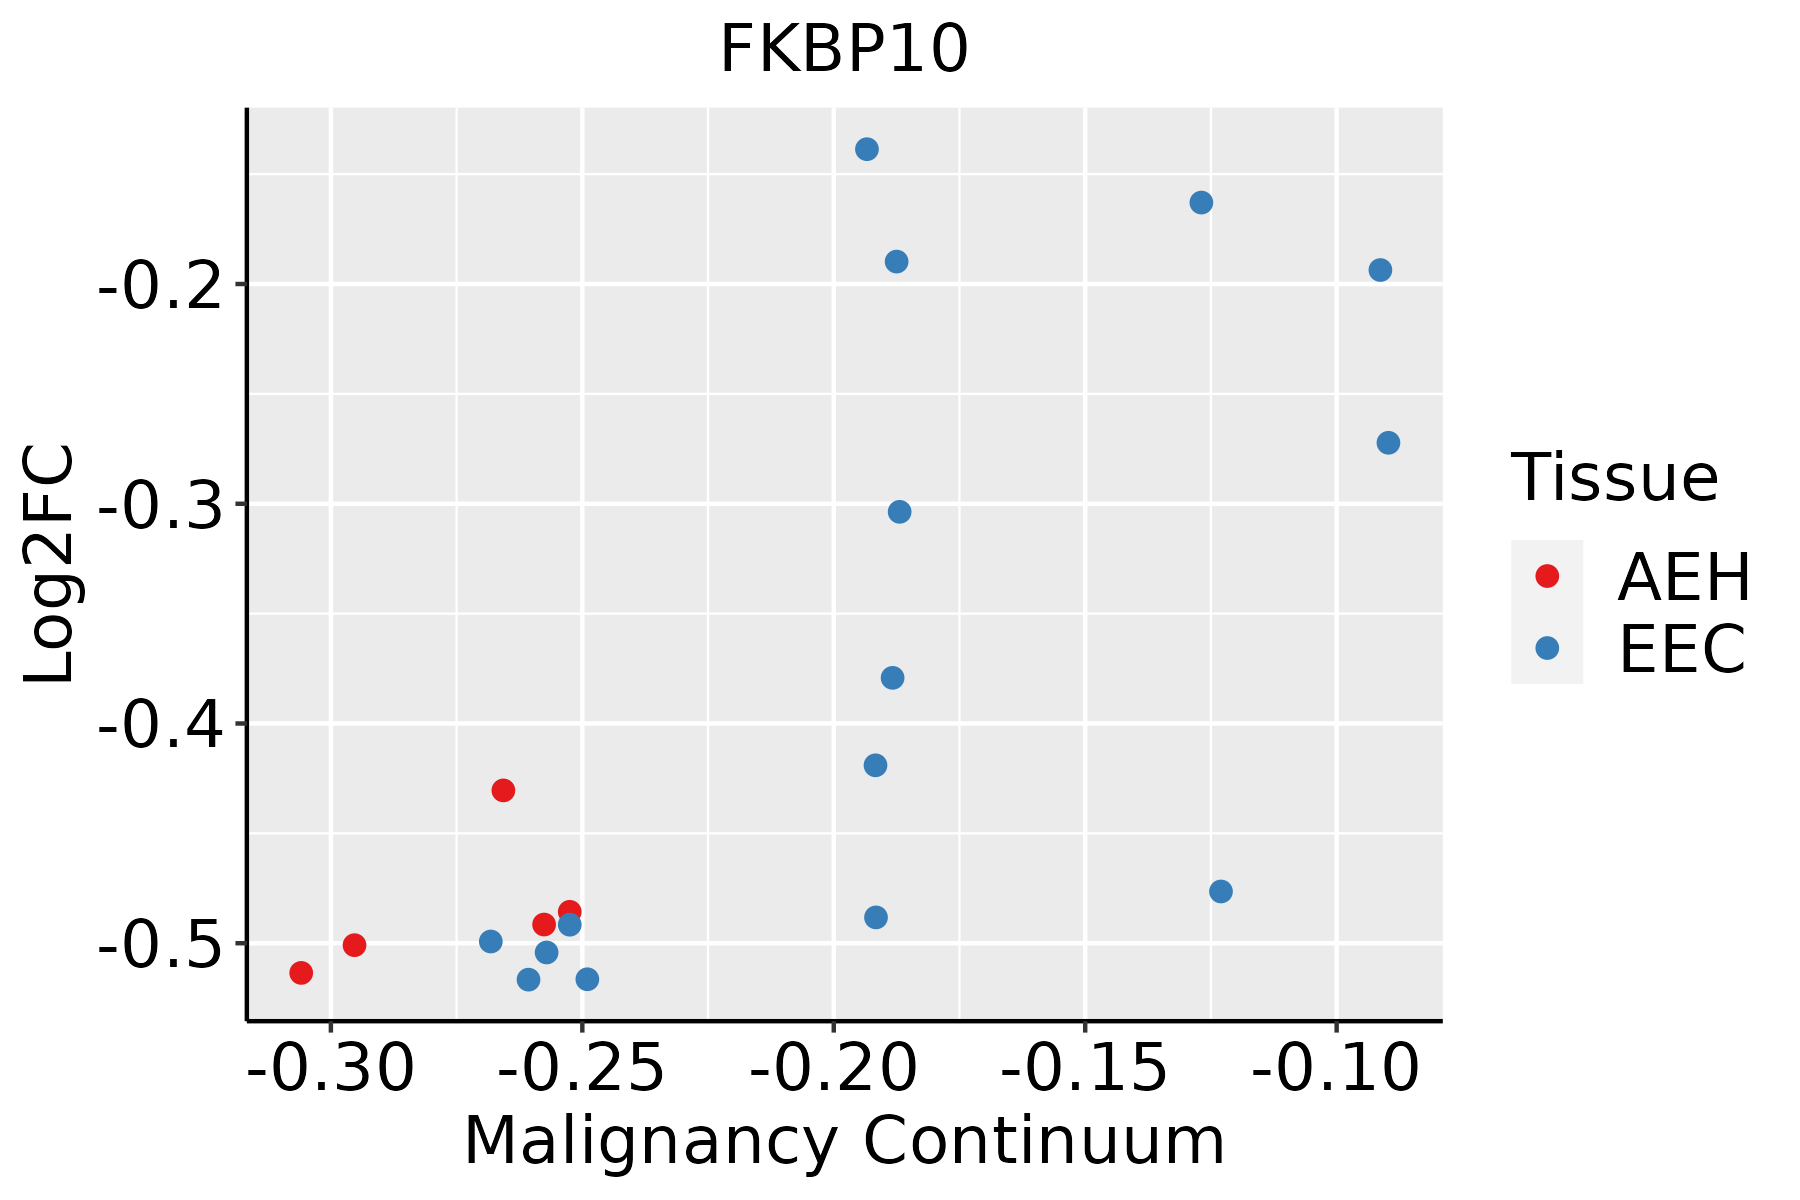 | AEH: Atypical endometrial hyperplasia |
| EEC: Endometrioid Cancer | ||
| Esophagus | 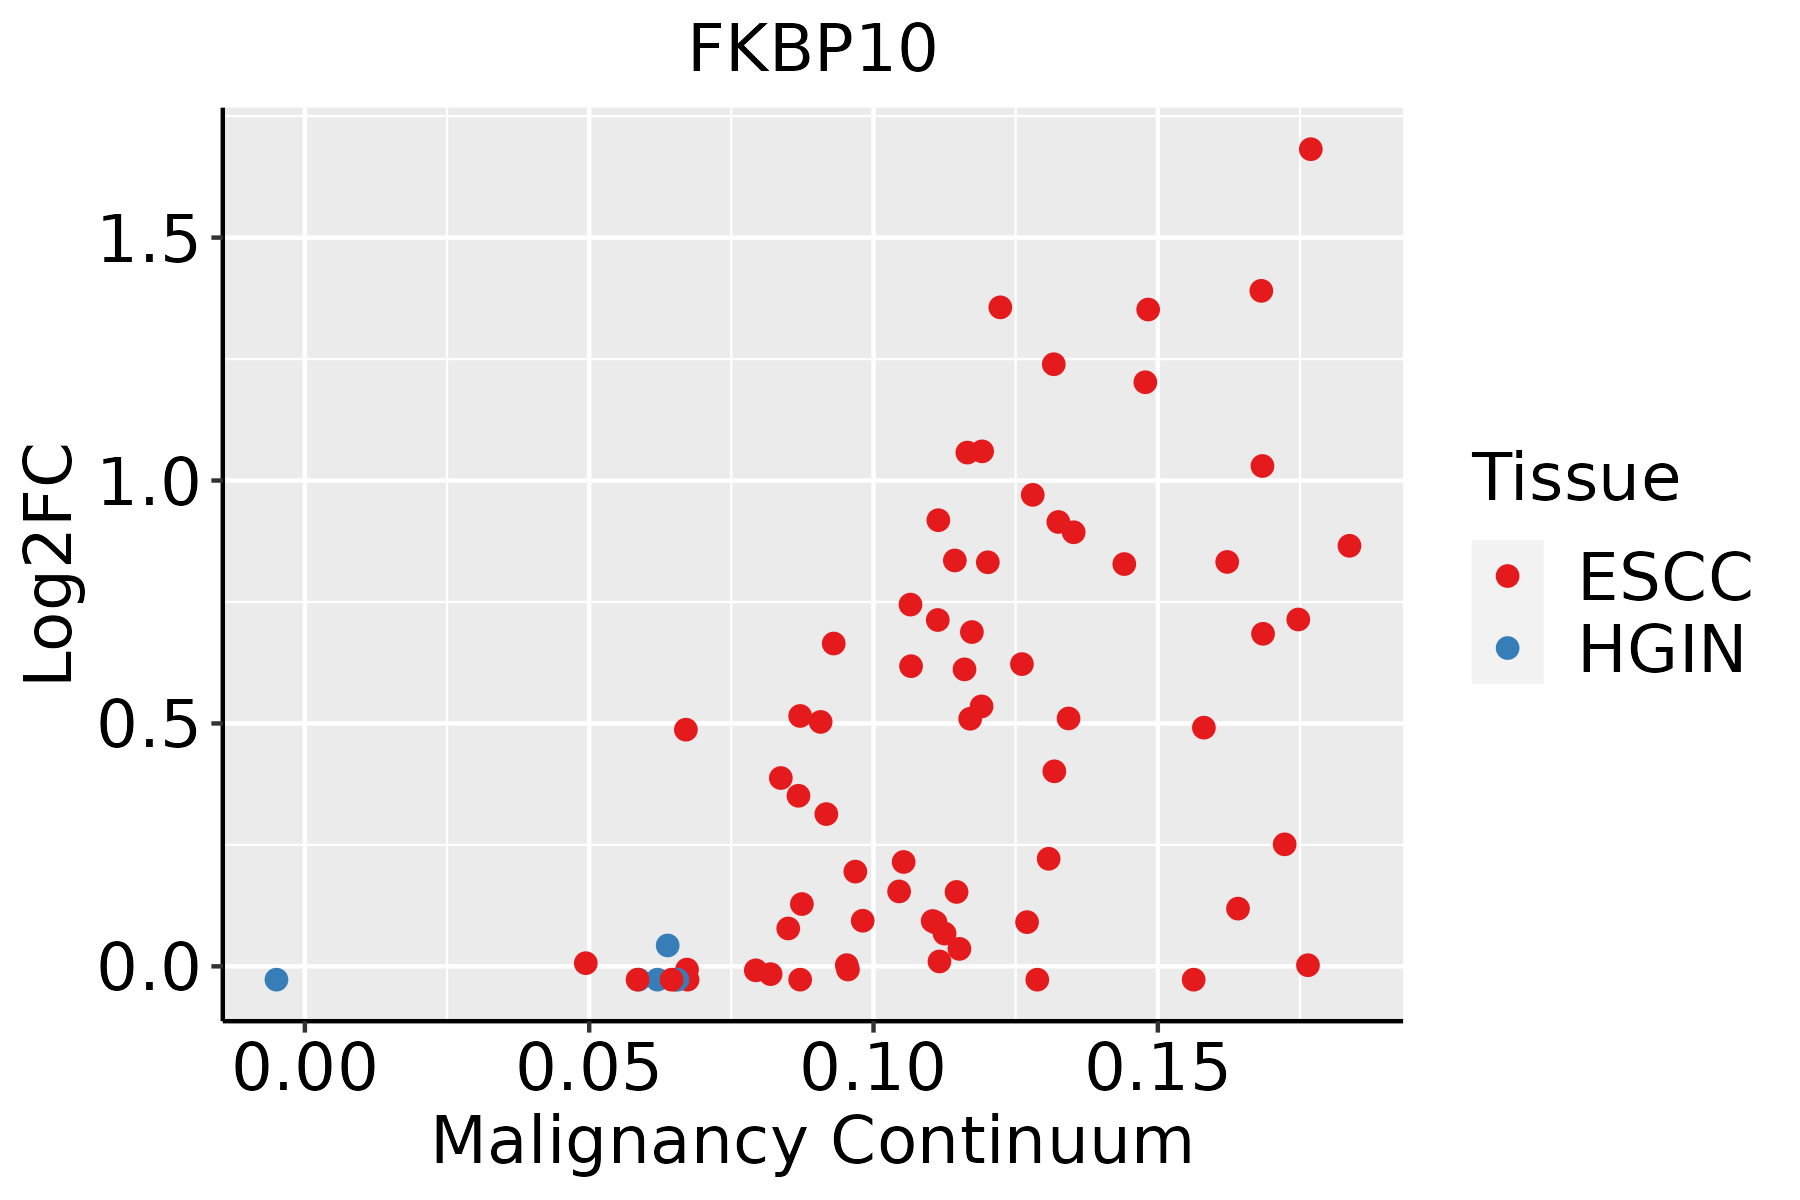 | ESCC: Esophageal squamous cell carcinoma |
| HGIN: High-grade intraepithelial neoplasias | ||
| LGIN: Low-grade intraepithelial neoplasias | ||
| Liver |  | HCC: Hepatocellular carcinoma |
| NAFLD: Non-alcoholic fatty liver disease | ||
| Oral Cavity |  | EOLP: Erosive Oral lichen planus |
| LP: leukoplakia | ||
| NEOLP: Non-erosive oral lichen planus | ||
| OSCC: Oral squamous cell carcinoma | ||
| Thyroid |  | ATC: Anaplastic thyroid cancer |
| HT: Hashimoto's thyroiditis | ||
| PTC: Papillary thyroid cancer |
| ∗log2FC in expression of this searched gene in stem-like cells from each diseased tissue sample relative to stem-like cells in normal samples in each tissue plotted against the malignancy continuum. Samples are colored based on if they are from different disease stage. |
Top |
Malignant transformation related pathway analysis |
| Find out the enriched GO biological processes and KEGG pathways involved in transition from healthy to precancer to cancer |
| Tissue | Disease Stage | Enriched GO biological Processes |
| Colorectum | AD |  |
| Colorectum | SER |  |
| Colorectum | MSS |  |
| Colorectum | MSI-H |  |
| Colorectum | FAP |  |
| ∗Top 15 enriched GO BP terms are showed in the bar plot of each disease state in each tissue. Each row represents a significant GO biological process which is colored according to the -log10(p.adjust). |
| Page: 1 2 3 4 5 6 7 8 9 |
| GO ID | Tissue | Disease Stage | Description | Gene Ratio | Bg Ratio | pvalue | p.adjust | Count |
| GO:0042060 | Colorectum | AD | wound healing | 128/3918 | 422/18723 | 2.73e-06 | 7.89e-05 | 128 |
| GO:0001701 | Colorectum | AD | in utero embryonic development | 110/3918 | 367/18723 | 2.36e-05 | 4.62e-04 | 110 |
| GO:00420601 | Colorectum | SER | wound healing | 97/2897 | 422/18723 | 2.69e-05 | 7.30e-04 | 97 |
| GO:00017011 | Colorectum | SER | in utero embryonic development | 77/2897 | 367/18723 | 2.77e-03 | 2.48e-02 | 77 |
| GO:00420602 | Colorectum | MSS | wound healing | 119/3467 | 422/18723 | 5.93e-07 | 2.24e-05 | 119 |
| GO:00017012 | Colorectum | MSS | in utero embryonic development | 99/3467 | 367/18723 | 3.71e-05 | 7.10e-04 | 99 |
| GO:00420603 | Colorectum | MSI-H | wound healing | 47/1319 | 422/18723 | 1.23e-03 | 2.00e-02 | 47 |
| GO:00420604 | Colorectum | FAP | wound healing | 99/2622 | 422/18723 | 9.50e-08 | 6.33e-06 | 99 |
| GO:00017013 | Colorectum | FAP | in utero embryonic development | 81/2622 | 367/18723 | 1.58e-05 | 4.10e-04 | 81 |
| GO:004206016 | Endometrium | AEH | wound healing | 91/2100 | 422/18723 | 4.85e-10 | 4.61e-08 | 91 |
| GO:00017019 | Endometrium | AEH | in utero embryonic development | 73/2100 | 367/18723 | 7.18e-07 | 2.63e-05 | 73 |
| GO:00004133 | Endometrium | AEH | protein peptidyl-prolyl isomerization | 13/2100 | 42/18723 | 4.74e-04 | 4.91e-03 | 13 |
| GO:00182086 | Endometrium | AEH | peptidyl-proline modification | 16/2100 | 58/18723 | 4.75e-04 | 4.91e-03 | 16 |
| GO:0030199 | Endometrium | AEH | collagen fibril organization | 14/2100 | 61/18723 | 6.65e-03 | 3.91e-02 | 14 |
| GO:004206017 | Endometrium | EEC | wound healing | 92/2168 | 422/18723 | 1.12e-09 | 9.58e-08 | 92 |
| GO:000170114 | Endometrium | EEC | in utero embryonic development | 75/2168 | 367/18723 | 5.86e-07 | 2.16e-05 | 75 |
| GO:000041311 | Endometrium | EEC | protein peptidyl-prolyl isomerization | 14/2168 | 42/18723 | 1.69e-04 | 2.10e-03 | 14 |
| GO:001820813 | Endometrium | EEC | peptidyl-proline modification | 17/2168 | 58/18723 | 2.11e-04 | 2.54e-03 | 17 |
| GO:00301991 | Endometrium | EEC | collagen fibril organization | 14/2168 | 61/18723 | 8.76e-03 | 4.74e-02 | 14 |
| GO:001820514 | Esophagus | ESCC | peptidyl-lysine modification | 259/8552 | 376/18723 | 3.90e-20 | 5.26e-18 | 259 |
| Page: 1 2 3 4 |
| Pathway ID | Tissue | Disease Stage | Description | Gene Ratio | Bg Ratio | pvalue | p.adjust | qvalue | Count |
| Page: 1 |
Top |
Cell-cell communication analysis |
| Identification of potential cell-cell interactions between two cell types and their ligand-receptor pairs for different disease states |
| Ligand | Receptor | LRpair | Pathway | Tissue | Disease Stage |
| Page: 1 |
Top |
Single-cell gene regulatory network inference analysis |
| Find out the significant the regulons (TFs) and the target genes of each regulon across cell types for different disease states |
| TF | Cell Type | Tissue | Disease Stage | Target Gene | RSS | Regulon Activity |
| ∗The dot plots of a searched regulon are shown for all cell subpopulations in each disease state of each tissue based on the regulon specific score inferred using pySCENIC and by calculating the average expression. |
| Page: 1 |
Top |
Somatic mutation of malignant transformation related genes |
| Annotation of somatic variants for genes involved in malignant transformation |
| Hugo Symbol | Variant Class | Variant Classification | dbSNP RS | HGVSc | HGVSp | HGVSp Short | SWISSPROT | BIOTYPE | SIFT | PolyPhen | Tumor Sample Barcode | Tissue | Histology | Sex | Age | Stage | Therapy Types | Drugs | Outcome |
| FKBP10 | SNV | Missense_Mutation | c.1459G>A | p.Asp487Asn | p.D487N | Q96AY3 | protein_coding | tolerated(0.22) | benign(0.029) | TCGA-A2-A0SY-01 | Breast | breast invasive carcinoma | Female | <65 | III/IV | Hormone Therapy | arimidex | SD | |
| FKBP10 | insertion | Frame_Shift_Ins | novel | c.1236_1237insACATTGCTGCGCCCGCCCCACTGCCCCCGCAT | p.Gly413ThrfsTer34 | p.G413Tfs*34 | Q96AY3 | protein_coding | TCGA-A8-A08H-01 | Breast | breast invasive carcinoma | Female | >=65 | I/II | Unknown | Unknown | SD | ||
| FKBP10 | SNV | Missense_Mutation | novel | c.1180N>A | p.Glu394Lys | p.E394K | Q96AY3 | protein_coding | tolerated(0.89) | benign(0.02) | TCGA-DS-A1OB-01 | Cervix | cervical & endocervical cancer | Female | <65 | I/II | Chemotherapy | carboplatin | PD |
| FKBP10 | SNV | Missense_Mutation | rs782653042 | c.407C>T | p.Pro136Leu | p.P136L | Q96AY3 | protein_coding | deleterious(0) | probably_damaging(0.909) | TCGA-EA-A3HQ-01 | Cervix | cervical & endocervical cancer | Female | <65 | I/II | Unknown | Unknown | SD |
| FKBP10 | SNV | Missense_Mutation | novel | c.901N>G | p.Thr301Ala | p.T301A | Q96AY3 | protein_coding | deleterious(0.03) | benign(0.05) | TCGA-EA-A3HU-01 | Cervix | cervical & endocervical cancer | Female | <65 | I/II | Unknown | Unknown | SD |
| FKBP10 | SNV | Missense_Mutation | rs142507953 | c.311G>A | p.Arg104Gln | p.R104Q | Q96AY3 | protein_coding | tolerated(0.8) | benign(0.234) | TCGA-EK-A3GK-01 | Cervix | cervical & endocervical cancer | Female | <65 | I/II | Unknown | Unknown | SD |
| FKBP10 | SNV | Missense_Mutation | c.1340G>A | p.Cys447Tyr | p.C447Y | Q96AY3 | protein_coding | deleterious(0) | probably_damaging(1) | TCGA-JX-A3Q0-01 | Cervix | cervical & endocervical cancer | Female | <65 | III/IV | Unknown | Unknown | SD | |
| FKBP10 | SNV | Missense_Mutation | rs577855172 | c.1322N>T | p.Thr441Met | p.T441M | Q96AY3 | protein_coding | tolerated(0.28) | benign(0.017) | TCGA-ZJ-AAX4-01 | Cervix | cervical & endocervical cancer | Female | >=65 | I/II | Unknown | Unknown | SD |
| FKBP10 | SNV | Missense_Mutation | novel | c.148C>A | p.His50Asn | p.H50N | Q96AY3 | protein_coding | tolerated(0.28) | benign(0.065) | TCGA-AA-3877-01 | Colorectum | colon adenocarcinoma | Female | >=65 | I/II | Unknown | Unknown | SD |
| FKBP10 | SNV | Missense_Mutation | rs782261801 | c.715N>A | p.Glu239Lys | p.E239K | Q96AY3 | protein_coding | tolerated(0.08) | probably_damaging(0.985) | TCGA-AA-A01P-01 | Colorectum | colon adenocarcinoma | Female | >=65 | III/IV | Unknown | Unknown | PD |
| Page: 1 2 3 4 5 |
Top |
Related drugs of malignant transformation related genes |
| Identification of chemicals and drugs interact with genes involved in malignant transfromation |
| (DGIdb 4.0) |
| Entrez ID | Symbol | Category | Interaction Types | Drug Claim Name | Drug Name | PMIDs |
| Page: 1 |

Copyright 2023-Present -The University of Texas Health Science Center at Houston |