
|
|||||
|
 | |
| |
| |
| |
| |
| |
|
Gene: FJX1 |
Gene summary for FJX1 |
| Gene information | Species | Human | Gene symbol | FJX1 | Gene ID | 24147 |
| Gene name | four-jointed box kinase 1 | |
| Gene Alias | FJX1 | |
| Cytomap | 11p13 | |
| Gene Type | protein-coding | GO ID | GO:0001654 | UniProtAcc | Q86VR8 |
Top |
Malignant transformation analysis |
| Identification of the aberrant gene expression in precancerous and cancerous lesions by comparing the gene expression of stem-like cells in diseased tissues with normal stem cells |
| Entrez ID | Symbol | Replicates | Species | Organ | Tissue | Adj P-value | Log2FC | Malignancy |
| 24147 | FJX1 | AEH-subject1 | Human | Endometrium | AEH | 7.37e-13 | -4.02e-01 | -0.3059 |
| 24147 | FJX1 | AEH-subject2 | Human | Endometrium | AEH | 3.45e-11 | -3.73e-01 | -0.2525 |
| 24147 | FJX1 | AEH-subject3 | Human | Endometrium | AEH | 1.29e-06 | -3.54e-01 | -0.2576 |
| 24147 | FJX1 | AEH-subject4 | Human | Endometrium | AEH | 1.01e-09 | -3.90e-01 | -0.2657 |
| 24147 | FJX1 | AEH-subject5 | Human | Endometrium | AEH | 1.55e-14 | -4.11e-01 | -0.2953 |
| 24147 | FJX1 | EEC-subject1 | Human | Endometrium | EEC | 9.55e-17 | -4.24e-01 | -0.2682 |
| 24147 | FJX1 | EEC-subject2 | Human | Endometrium | EEC | 1.76e-15 | -4.03e-01 | -0.2607 |
| 24147 | FJX1 | EEC-subject3 | Human | Endometrium | EEC | 2.44e-18 | -4.26e-01 | -0.2525 |
| 24147 | FJX1 | EEC-subject4 | Human | Endometrium | EEC | 2.05e-18 | -4.28e-01 | -0.2571 |
| 24147 | FJX1 | EEC-subject5 | Human | Endometrium | EEC | 7.10e-17 | -4.30e-01 | -0.249 |
| 24147 | FJX1 | GSM5276934 | Human | Endometrium | EEC | 6.35e-14 | 5.98e-01 | -0.0913 |
| 24147 | FJX1 | GSM5276935 | Human | Endometrium | EEC | 4.90e-03 | -3.41e-01 | -0.123 |
| 24147 | FJX1 | GSM5276937 | Human | Endometrium | EEC | 2.27e-34 | 9.98e-01 | -0.0897 |
| 24147 | FJX1 | GSM6177620_NYU_UCEC1_lib1_lib1 | Human | Endometrium | EEC | 1.46e-13 | -3.78e-01 | -0.1869 |
| 24147 | FJX1 | GSM6177620_NYU_UCEC1_lib2_lib2 | Human | Endometrium | EEC | 4.14e-16 | -4.37e-01 | -0.1875 |
| 24147 | FJX1 | GSM6177620_NYU_UCEC1_lib3_lib3 | Human | Endometrium | EEC | 1.53e-16 | -4.04e-01 | -0.1883 |
| 24147 | FJX1 | GSM6177621_NYU_UCEC2_lib1_lib1 | Human | Endometrium | EEC | 1.60e-18 | -4.37e-01 | -0.1934 |
| 24147 | FJX1 | GSM6177622_NYU_UCEC3_lib1_lib1 | Human | Endometrium | EEC | 2.41e-12 | -3.65e-01 | -0.1917 |
| 24147 | FJX1 | GSM6177622_NYU_UCEC3_lib2_lib2 | Human | Endometrium | EEC | 6.28e-19 | -3.49e-01 | -0.1916 |
| 24147 | FJX1 | C04 | Human | Oral cavity | OSCC | 2.17e-21 | 9.84e-01 | 0.2633 |
| Page: 1 2 3 |
| Tissue | Expression Dynamics | Abbreviation |
| Endometrium | 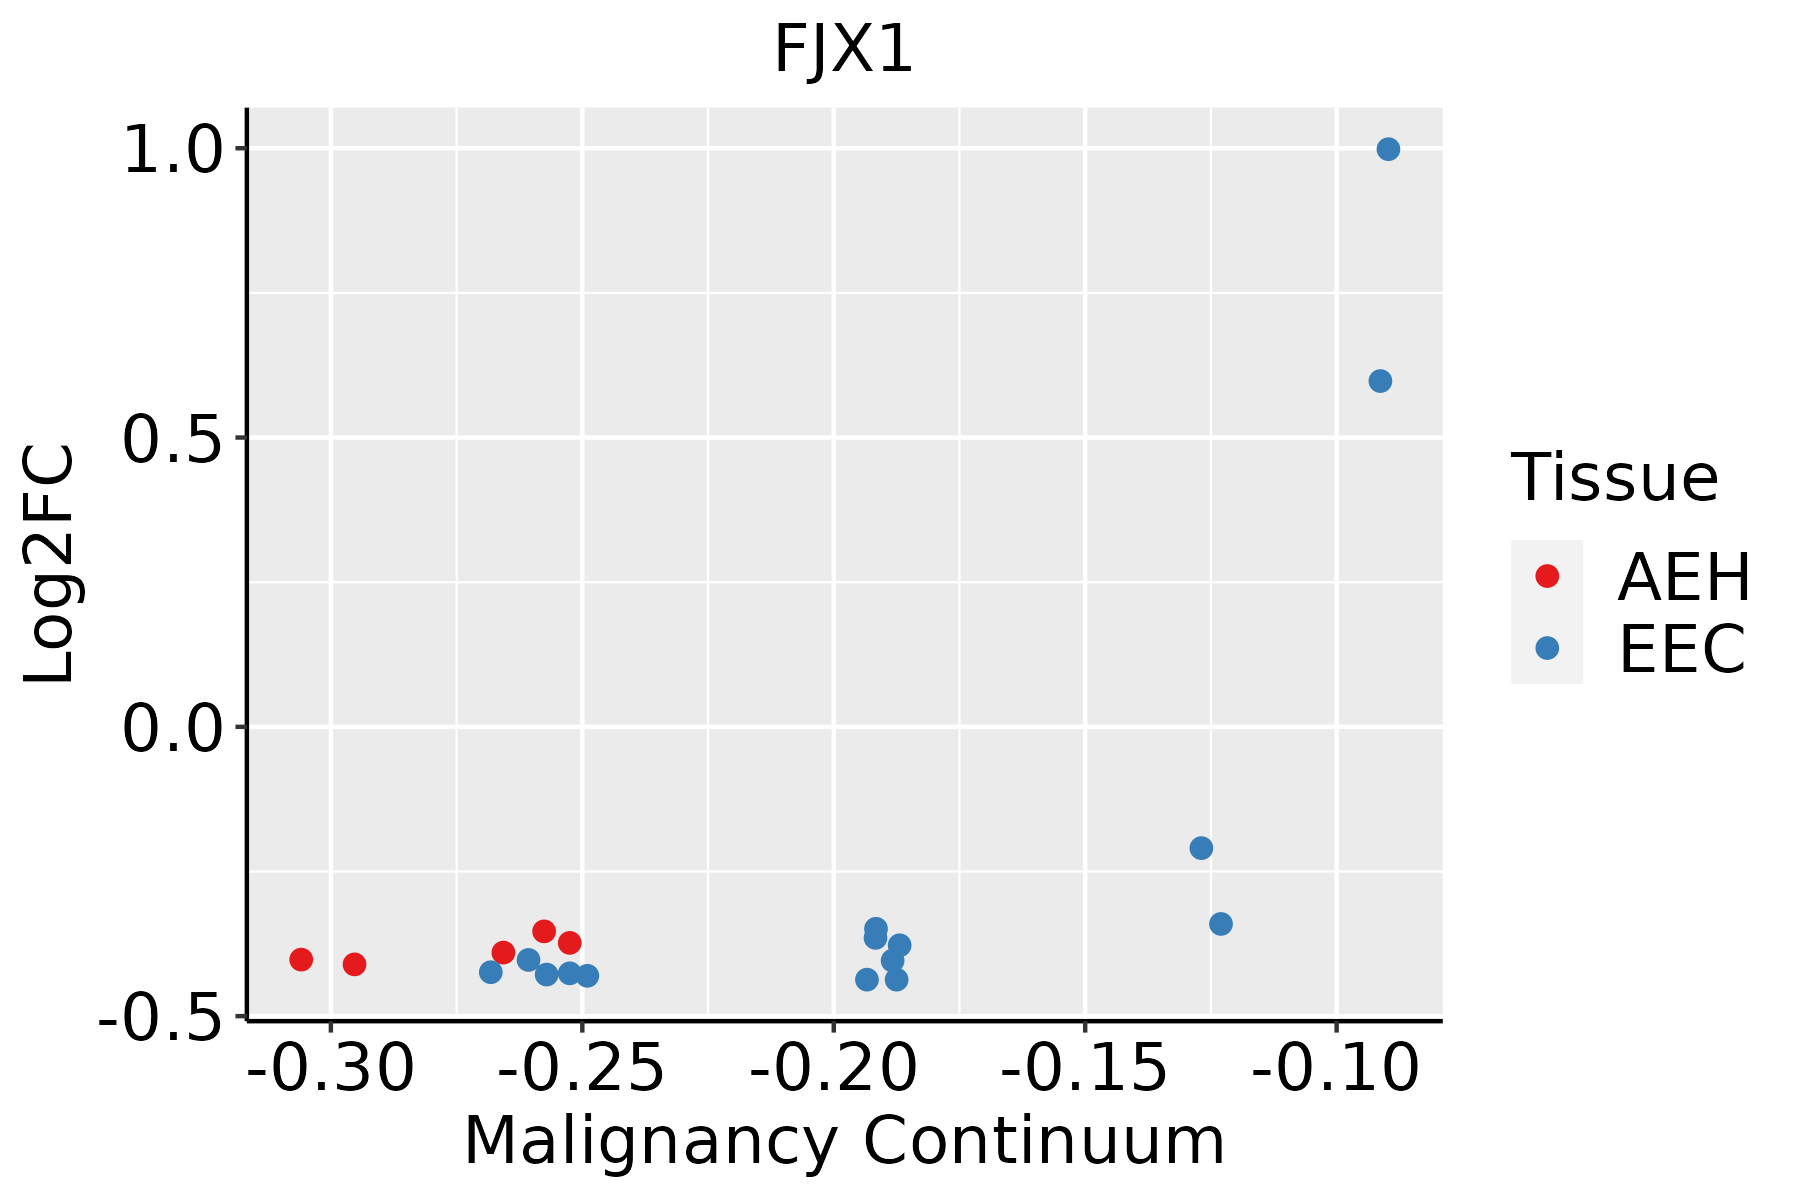 | AEH: Atypical endometrial hyperplasia |
| EEC: Endometrioid Cancer | ||
| Oral Cavity |  | EOLP: Erosive Oral lichen planus |
| LP: leukoplakia | ||
| NEOLP: Non-erosive oral lichen planus | ||
| OSCC: Oral squamous cell carcinoma | ||
| Skin | 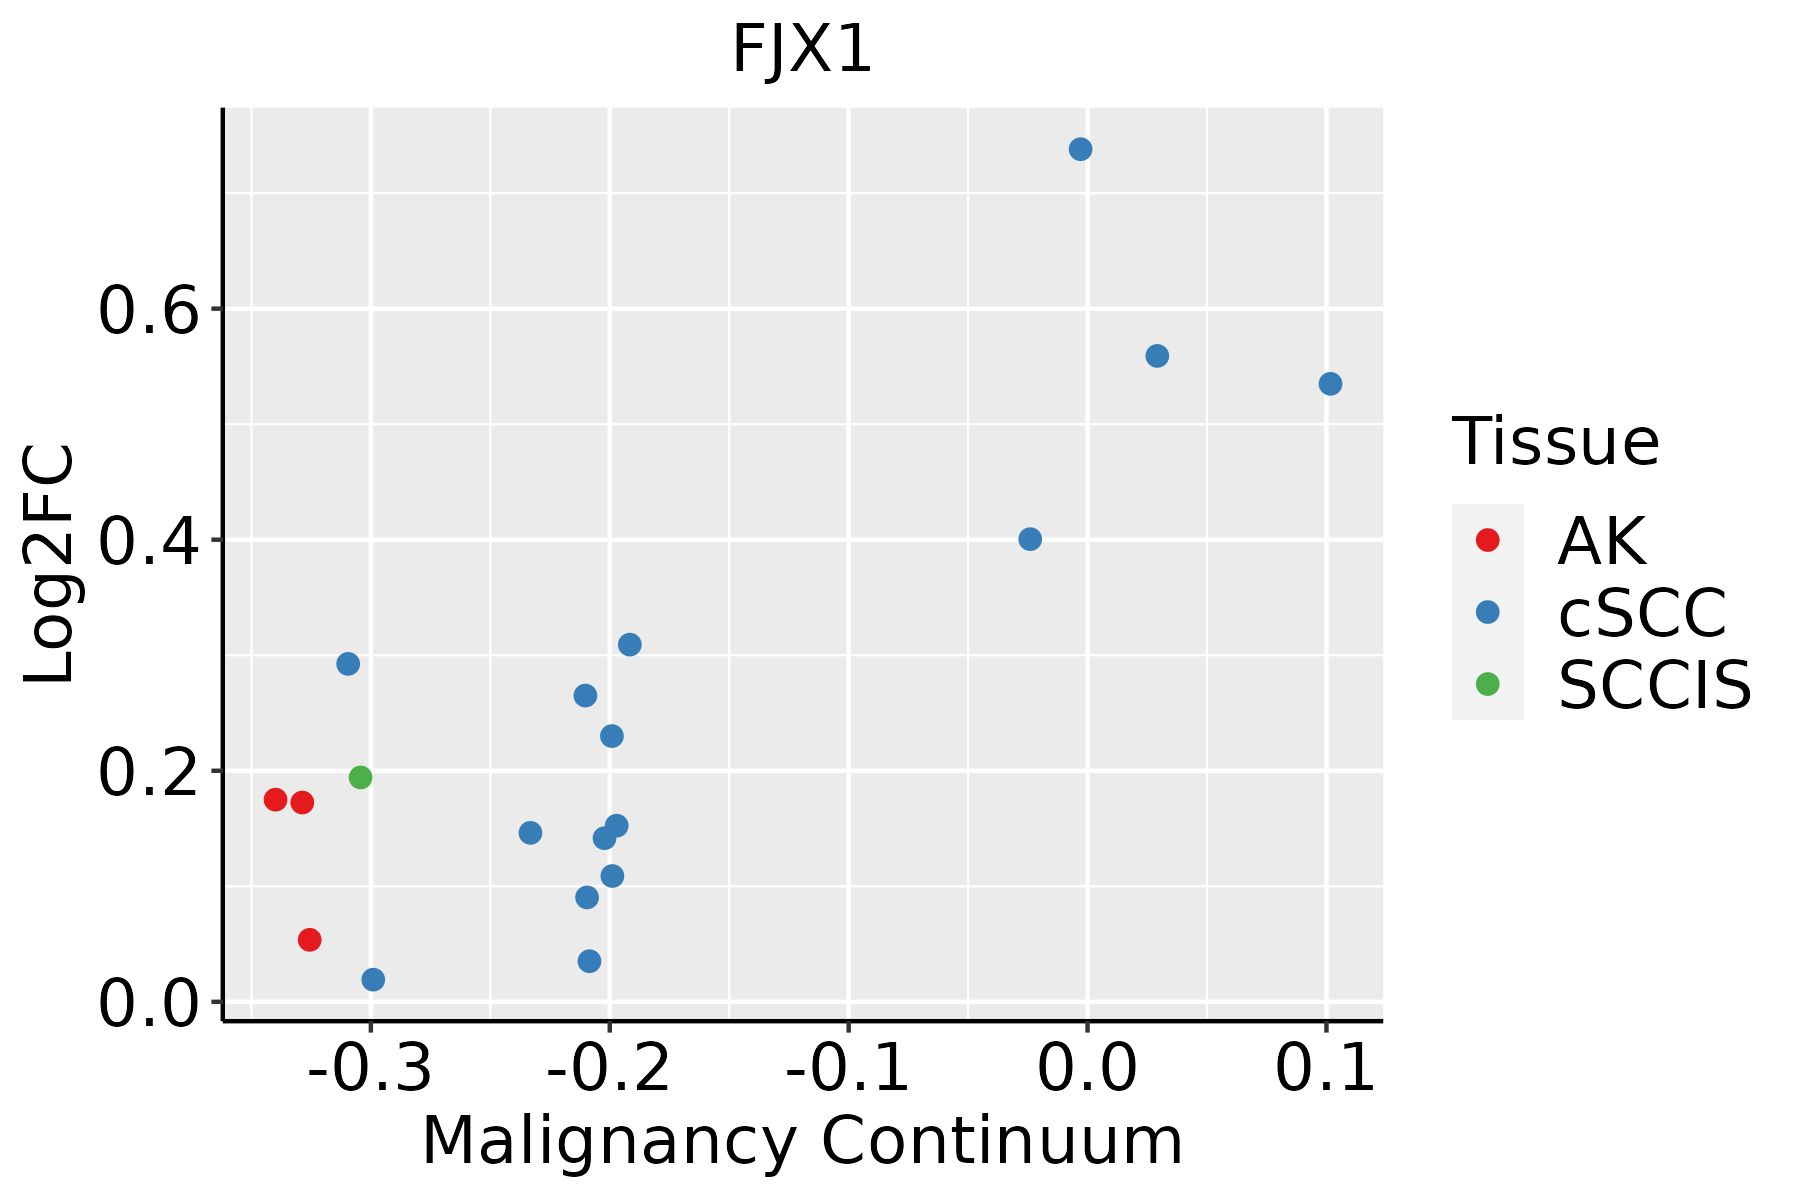 | AK: Actinic keratosis |
| cSCC: Cutaneous squamous cell carcinoma | ||
| SCCIS:squamous cell carcinoma in situ | ||
| Thyroid | 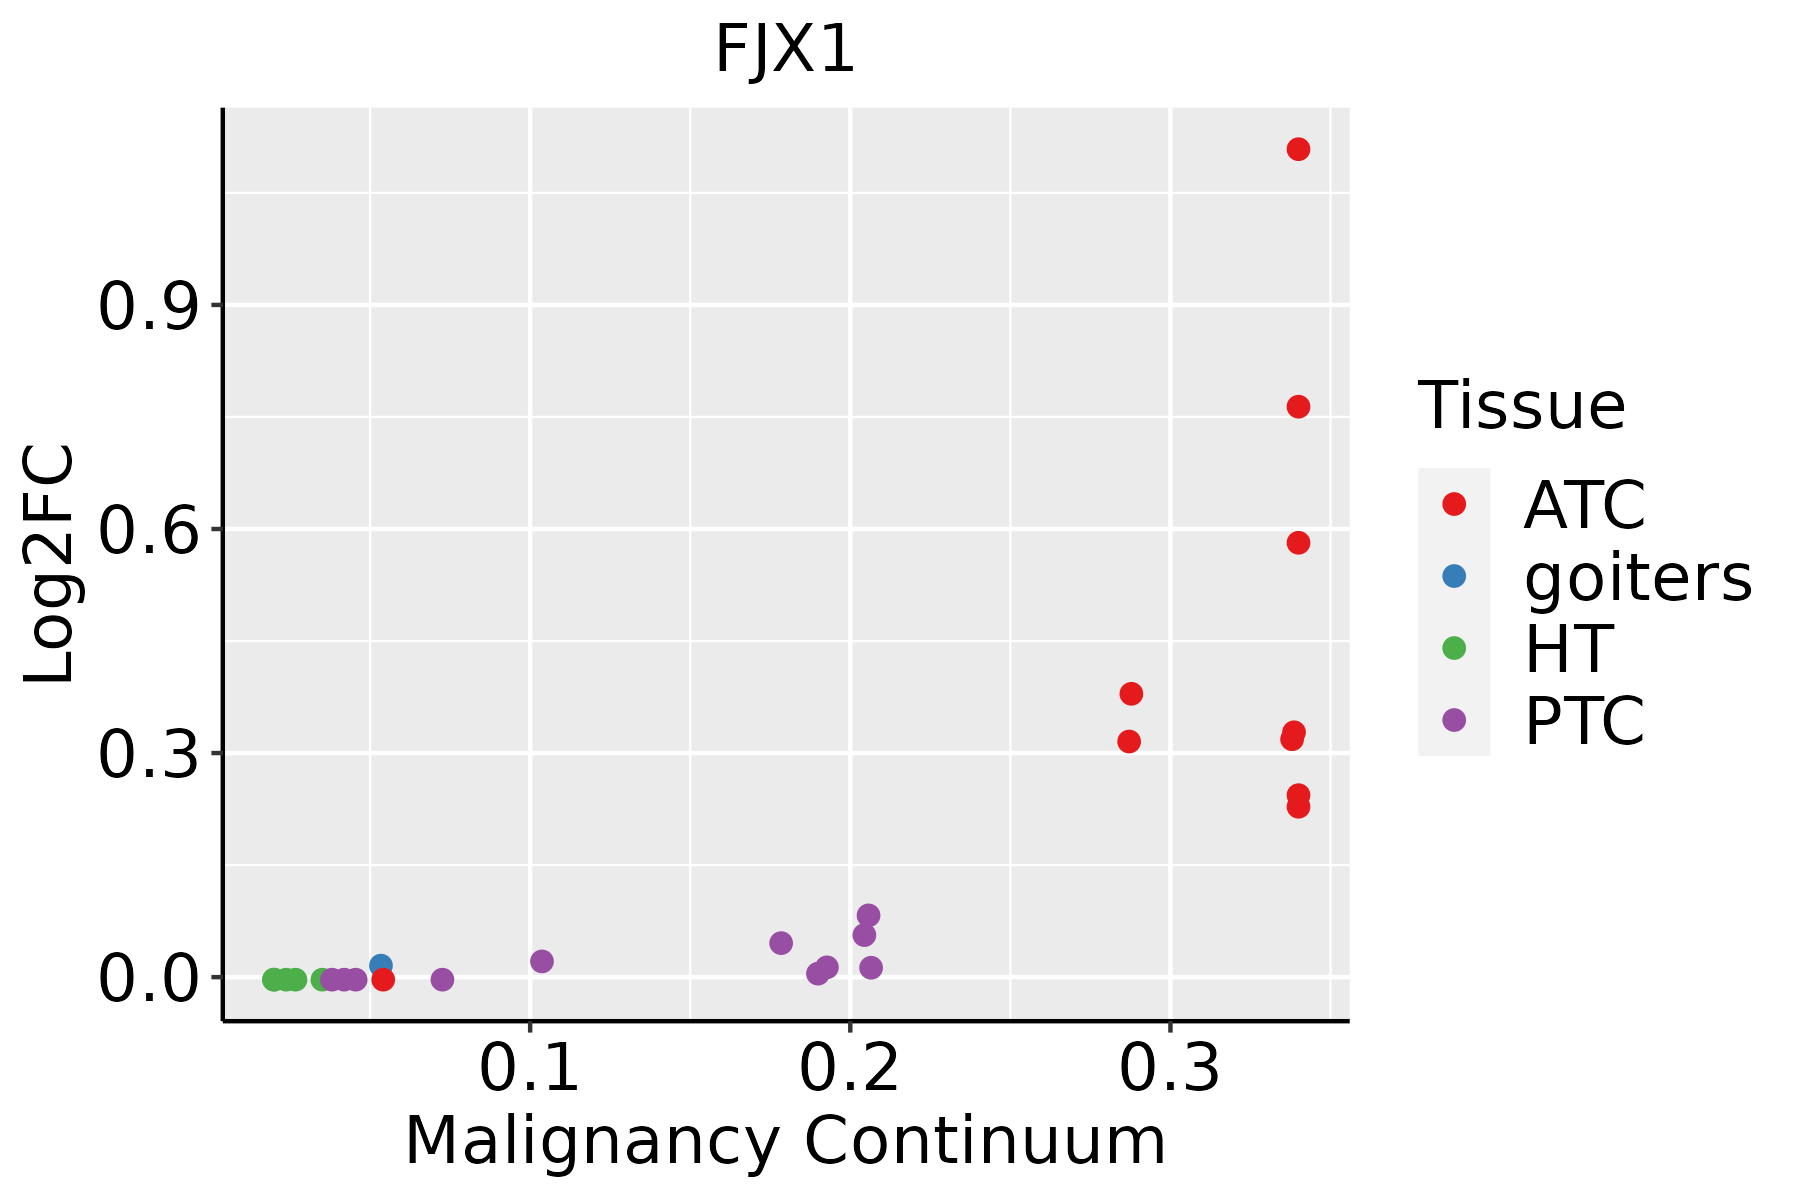 | ATC: Anaplastic thyroid cancer |
| HT: Hashimoto's thyroiditis | ||
| PTC: Papillary thyroid cancer |
| ∗log2FC in expression of this searched gene in stem-like cells from each diseased tissue sample relative to stem-like cells in normal samples in each tissue plotted against the malignancy continuum. Samples are colored based on if they are from different disease stage. |
Top |
Malignant transformation related pathway analysis |
| Find out the enriched GO biological processes and KEGG pathways involved in transition from healthy to precancer to cancer |
| Tissue | Disease Stage | Enriched GO biological Processes |
| Colorectum | AD |  |
| Colorectum | SER |  |
| Colorectum | MSS |  |
| Colorectum | MSI-H |  |
| Colorectum | FAP |  |
| ∗Top 15 enriched GO BP terms are showed in the bar plot of each disease state in each tissue. Each row represents a significant GO biological process which is colored according to the -log10(p.adjust). |
| Page: 1 2 3 4 5 6 7 8 9 |
| GO ID | Tissue | Disease Stage | Description | Gene Ratio | Bg Ratio | pvalue | p.adjust | Count |
| Page: 1 |
| Pathway ID | Tissue | Disease Stage | Description | Gene Ratio | Bg Ratio | pvalue | p.adjust | qvalue | Count |
| Page: 1 |
Top |
Cell-cell communication analysis |
| Identification of potential cell-cell interactions between two cell types and their ligand-receptor pairs for different disease states |
| Ligand | Receptor | LRpair | Pathway | Tissue | Disease Stage |
| Page: 1 |
Top |
Single-cell gene regulatory network inference analysis |
| Find out the significant the regulons (TFs) and the target genes of each regulon across cell types for different disease states |
| TF | Cell Type | Tissue | Disease Stage | Target Gene | RSS | Regulon Activity |
| ∗The dot plots of a searched regulon are shown for all cell subpopulations in each disease state of each tissue based on the regulon specific score inferred using pySCENIC and by calculating the average expression. |
| Page: 1 |
Top |
Somatic mutation of malignant transformation related genes |
| Annotation of somatic variants for genes involved in malignant transformation |
| Hugo Symbol | Variant Class | Variant Classification | dbSNP RS | HGVSc | HGVSp | HGVSp Short | SWISSPROT | BIOTYPE | SIFT | PolyPhen | Tumor Sample Barcode | Tissue | Histology | Sex | Age | Stage | Therapy Types | Drugs | Outcome |
| FJX1 | SNV | Missense_Mutation | novel | c.1192N>T | p.Arg398Cys | p.R398C | Q86VR8 | protein_coding | deleterious(0.05) | probably_damaging(0.959) | TCGA-PE-A5DE-01 | Breast | breast invasive carcinoma | Female | <65 | I/II | Chemotherapy | taxotere | CR |
| FJX1 | SNV | Missense_Mutation | novel | c.1105N>A | p.Glu369Lys | p.E369K | Q86VR8 | protein_coding | tolerated(1) | benign(0.036) | TCGA-EK-A2R8-01 | Cervix | cervical & endocervical cancer | Female | <65 | I/II | Unknown | Unknown | SD |
| FJX1 | SNV | Missense_Mutation | c.1138N>T | p.Arg380Cys | p.R380C | Q86VR8 | protein_coding | deleterious(0.01) | probably_damaging(0.938) | TCGA-A6-5665-01 | Colorectum | colon adenocarcinoma | Female | >=65 | I/II | Unknown | Unknown | PD | |
| FJX1 | SNV | Missense_Mutation | novel | c.1222N>A | p.Pro408Thr | p.P408T | Q86VR8 | protein_coding | tolerated(0.13) | possibly_damaging(0.76) | TCGA-AP-A1DK-01 | Endometrium | uterine corpus endometrioid carcinoma | Female | <65 | I/II | Unknown | Unknown | SD |
| FJX1 | SNV | Missense_Mutation | novel | c.808N>A | p.Asp270Asn | p.D270N | Q86VR8 | protein_coding | tolerated(0.48) | benign(0.05) | TCGA-EO-A3B0-01 | Endometrium | uterine corpus endometrioid carcinoma | Female | <65 | III/IV | Unknown | Unknown | SD |
| FJX1 | SNV | Missense_Mutation | novel | c.1012N>T | p.Asp338Tyr | p.D338Y | Q86VR8 | protein_coding | deleterious(0) | probably_damaging(1) | TCGA-05-4424-01 | Lung | lung adenocarcinoma | Male | >=65 | I/II | Targeted Molecular therapy | erlotinib | SD |
| FJX1 | SNV | Missense_Mutation | c.526N>T | p.Arg176Cys | p.R176C | Q86VR8 | protein_coding | deleterious(0) | probably_damaging(0.948) | TCGA-55-6985-01 | Lung | lung adenocarcinoma | Female | <65 | I/II | Unknown | Unknown | SD | |
| FJX1 | SNV | Missense_Mutation | c.961N>T | p.Arg321Cys | p.R321C | Q86VR8 | protein_coding | deleterious(0.01) | probably_damaging(0.999) | TCGA-78-7220-01 | Lung | lung adenocarcinoma | Female | <65 | III/IV | Unknown | Unknown | PD | |
| FJX1 | SNV | Missense_Mutation | c.1055T>A | p.Met352Lys | p.M352K | Q86VR8 | protein_coding | tolerated(0.39) | possibly_damaging(0.492) | TCGA-86-7955-01 | Lung | lung adenocarcinoma | Male | <65 | I/II | Chemotherapy | etoposide | PD | |
| FJX1 | SNV | Missense_Mutation | c.571G>A | p.Glu191Lys | p.E191K | Q86VR8 | protein_coding | deleterious(0) | probably_damaging(0.991) | TCGA-CR-7392-01 | Oral cavity | head & neck squamous cell carcinoma | Female | >=65 | I/II | Unknown | Unknown | SD |
| Page: 1 2 |
Top |
Related drugs of malignant transformation related genes |
| Identification of chemicals and drugs interact with genes involved in malignant transfromation |
| (DGIdb 4.0) |
| Entrez ID | Symbol | Category | Interaction Types | Drug Claim Name | Drug Name | PMIDs |
| Page: 1 |

Copyright 2023-Present -The University of Texas Health Science Center at Houston |