
|
|||||
|
 | |
| |
| |
| |
| |
| |
|
Gene: FIS1 |
Gene summary for FIS1 |
| Gene information | Species | Human | Gene symbol | FIS1 | Gene ID | 51024 |
| Gene name | fission, mitochondrial 1 | |
| Gene Alias | CGI-135 | |
| Cytomap | 7q22.1 | |
| Gene Type | protein-coding | GO ID | GO:0000266 | UniProtAcc | Q9Y3D6 |
Top |
Malignant transformation analysis |
| Identification of the aberrant gene expression in precancerous and cancerous lesions by comparing the gene expression of stem-like cells in diseased tissues with normal stem cells |
| Entrez ID | Symbol | Replicates | Species | Organ | Tissue | Adj P-value | Log2FC | Malignancy |
| 51024 | FIS1 | CA_HPV_1 | Human | Cervix | CC | 1.19e-15 | -4.23e-01 | 0.0264 |
| 51024 | FIS1 | N_HPV_1 | Human | Cervix | N_HPV | 8.56e-05 | -7.47e-02 | 0.0079 |
| 51024 | FIS1 | CCI_1 | Human | Cervix | CC | 2.61e-08 | -6.96e-01 | 0.528 |
| 51024 | FIS1 | CCI_2 | Human | Cervix | CC | 3.07e-05 | -6.28e-01 | 0.5249 |
| 51024 | FIS1 | CCI_3 | Human | Cervix | CC | 9.10e-11 | -6.84e-01 | 0.516 |
| 51024 | FIS1 | CCII_1 | Human | Cervix | CC | 5.76e-21 | -7.53e-01 | 0.3249 |
| 51024 | FIS1 | sample3 | Human | Cervix | CC | 2.50e-06 | -3.17e-01 | 0.1387 |
| 51024 | FIS1 | H2 | Human | Cervix | HSIL_HPV | 6.67e-04 | -2.86e-01 | 0.0632 |
| 51024 | FIS1 | L1 | Human | Cervix | CC | 5.36e-05 | -1.98e-01 | 0.0802 |
| 51024 | FIS1 | T1 | Human | Cervix | CC | 6.09e-04 | -3.60e-01 | 0.0918 |
| 51024 | FIS1 | T3 | Human | Cervix | CC | 1.12e-09 | -3.03e-01 | 0.1389 |
| 51024 | FIS1 | HTA11_3410_2000001011 | Human | Colorectum | AD | 8.68e-08 | 2.60e-01 | 0.0155 |
| 51024 | FIS1 | HTA11_2487_2000001011 | Human | Colorectum | SER | 3.23e-14 | 5.57e-01 | -0.1808 |
| 51024 | FIS1 | HTA11_1938_2000001011 | Human | Colorectum | AD | 8.15e-09 | 3.54e-01 | -0.0811 |
| 51024 | FIS1 | HTA11_78_2000001011 | Human | Colorectum | AD | 1.79e-04 | 1.92e-01 | -0.1088 |
| 51024 | FIS1 | HTA11_347_2000001011 | Human | Colorectum | AD | 6.42e-19 | 4.73e-01 | -0.1954 |
| 51024 | FIS1 | HTA11_411_2000001011 | Human | Colorectum | SER | 4.47e-04 | 4.28e-01 | -0.2602 |
| 51024 | FIS1 | HTA11_2112_2000001011 | Human | Colorectum | SER | 1.12e-04 | 6.05e-01 | -0.2196 |
| 51024 | FIS1 | HTA11_3361_2000001011 | Human | Colorectum | AD | 1.25e-15 | 4.69e-01 | -0.1207 |
| 51024 | FIS1 | HTA11_83_2000001011 | Human | Colorectum | SER | 3.49e-09 | 5.38e-01 | -0.1526 |
| Page: 1 2 3 4 5 6 7 8 9 10 11 12 |
| Tissue | Expression Dynamics | Abbreviation |
| Cervix |  | CC: Cervix cancer |
| HSIL_HPV: HPV-infected high-grade squamous intraepithelial lesions | ||
| N_HPV: HPV-infected normal cervix | ||
| Colorectum (GSE201348) |  | FAP: Familial adenomatous polyposis |
| CRC: Colorectal cancer | ||
| Colorectum (HTA11) |  | AD: Adenomas |
| SER: Sessile serrated lesions | ||
| MSI-H: Microsatellite-high colorectal cancer | ||
| MSS: Microsatellite stable colorectal cancer | ||
| Endometrium | 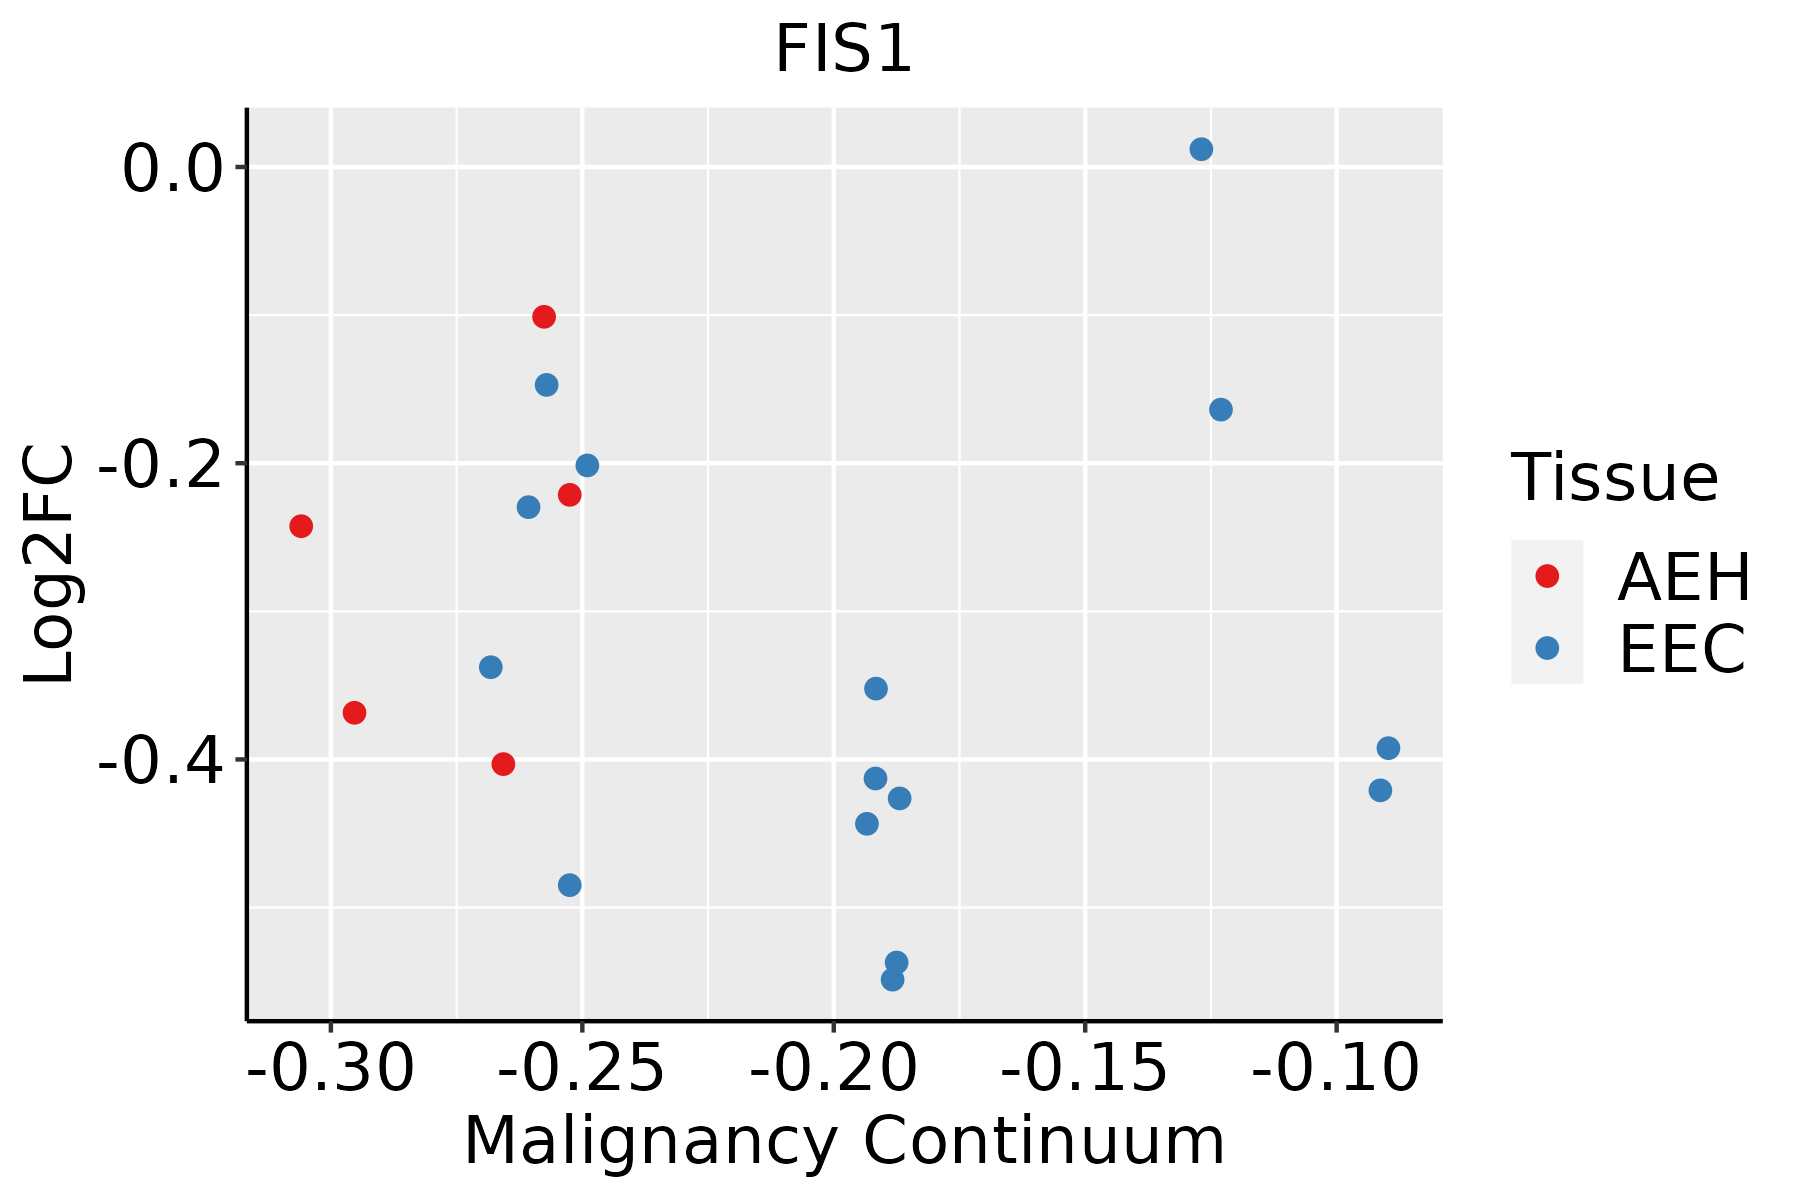 | AEH: Atypical endometrial hyperplasia |
| EEC: Endometrioid Cancer | ||
| Esophagus |  | ESCC: Esophageal squamous cell carcinoma |
| HGIN: High-grade intraepithelial neoplasias | ||
| LGIN: Low-grade intraepithelial neoplasias | ||
| GC |  | CAG: Chronic atrophic gastritis |
| CAG with IM: Chronic atrophic gastritis with intestinal metaplasia | ||
| CSG: Chronic superficial gastritis | ||
| GC: Gastric cancer | ||
| SIM: Severe intestinal metaplasia | ||
| WIM: Wild intestinal metaplasia | ||
| Liver |  | HCC: Hepatocellular carcinoma |
| NAFLD: Non-alcoholic fatty liver disease | ||
| Oral Cavity | 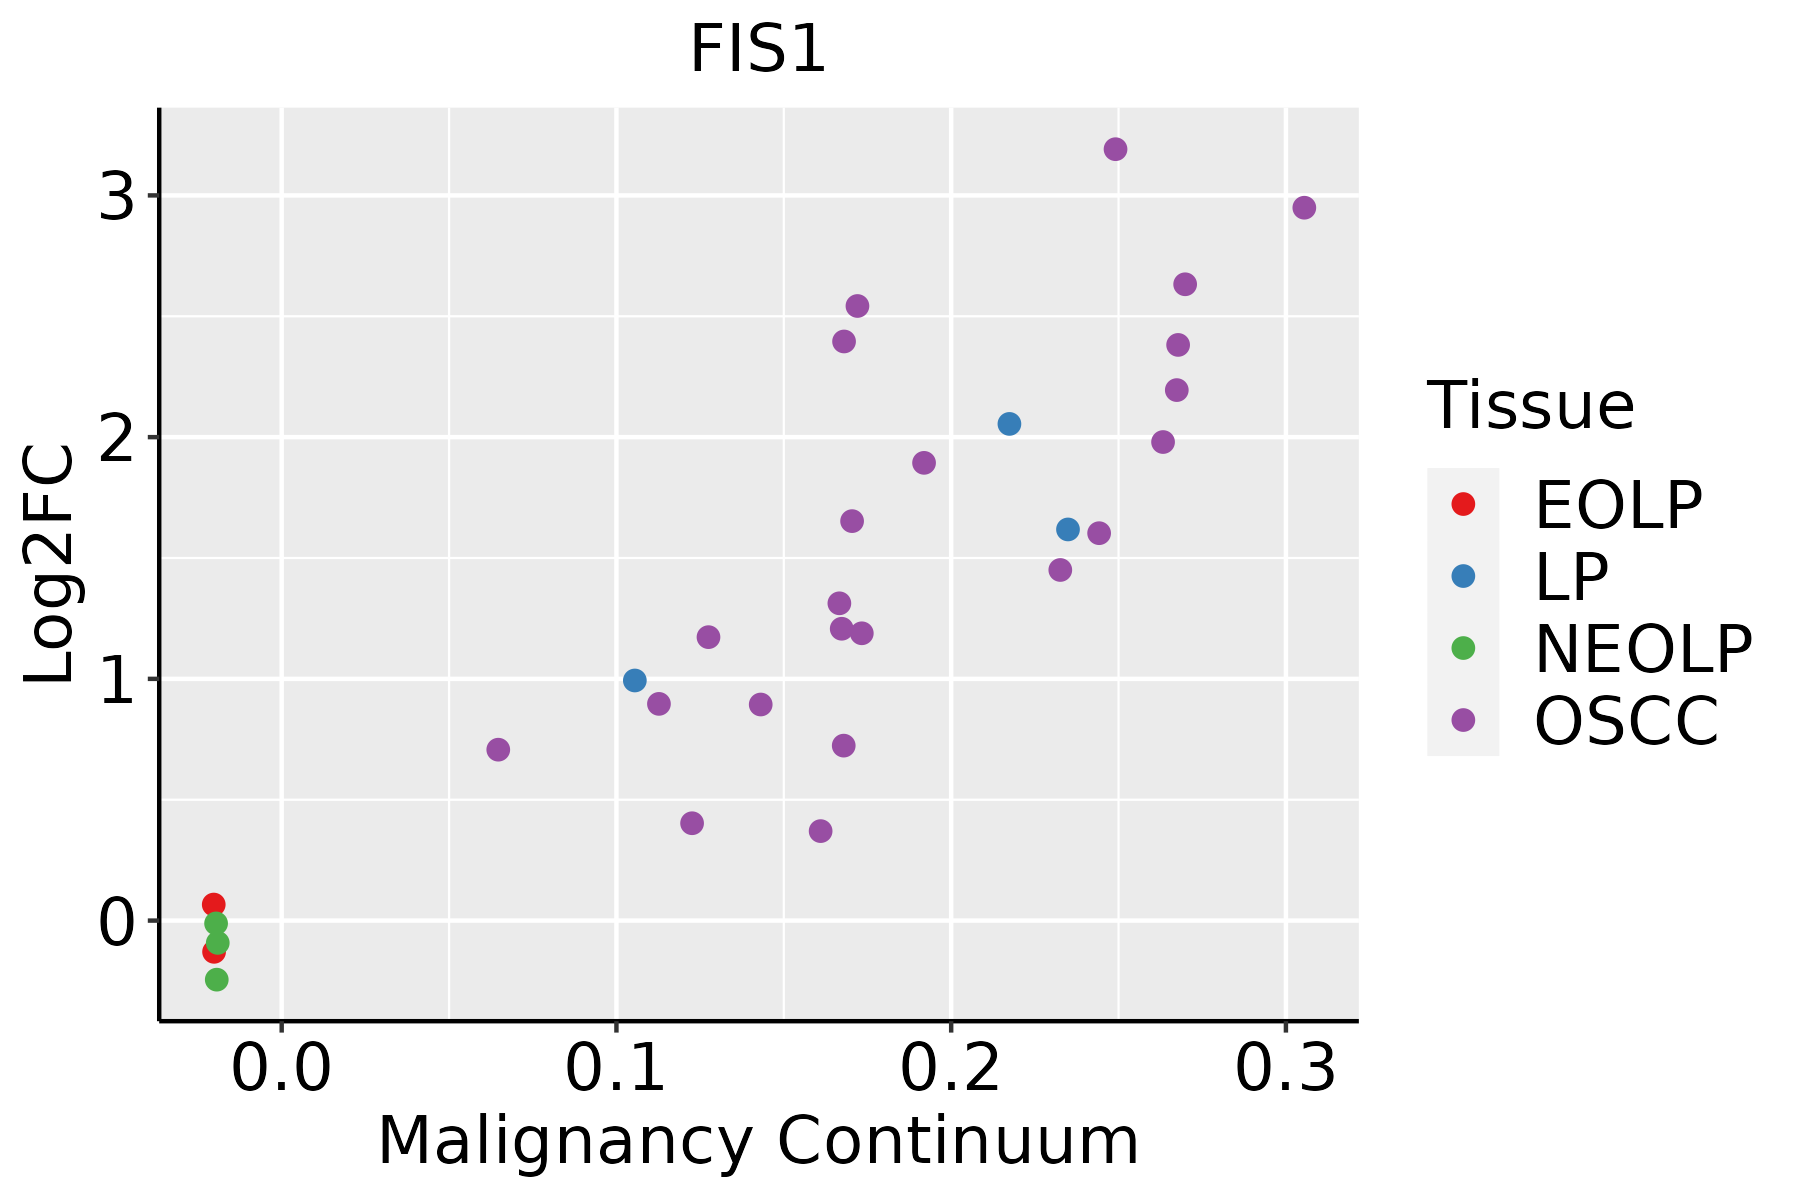 | EOLP: Erosive Oral lichen planus |
| LP: leukoplakia | ||
| NEOLP: Non-erosive oral lichen planus | ||
| OSCC: Oral squamous cell carcinoma | ||
| Prostate | 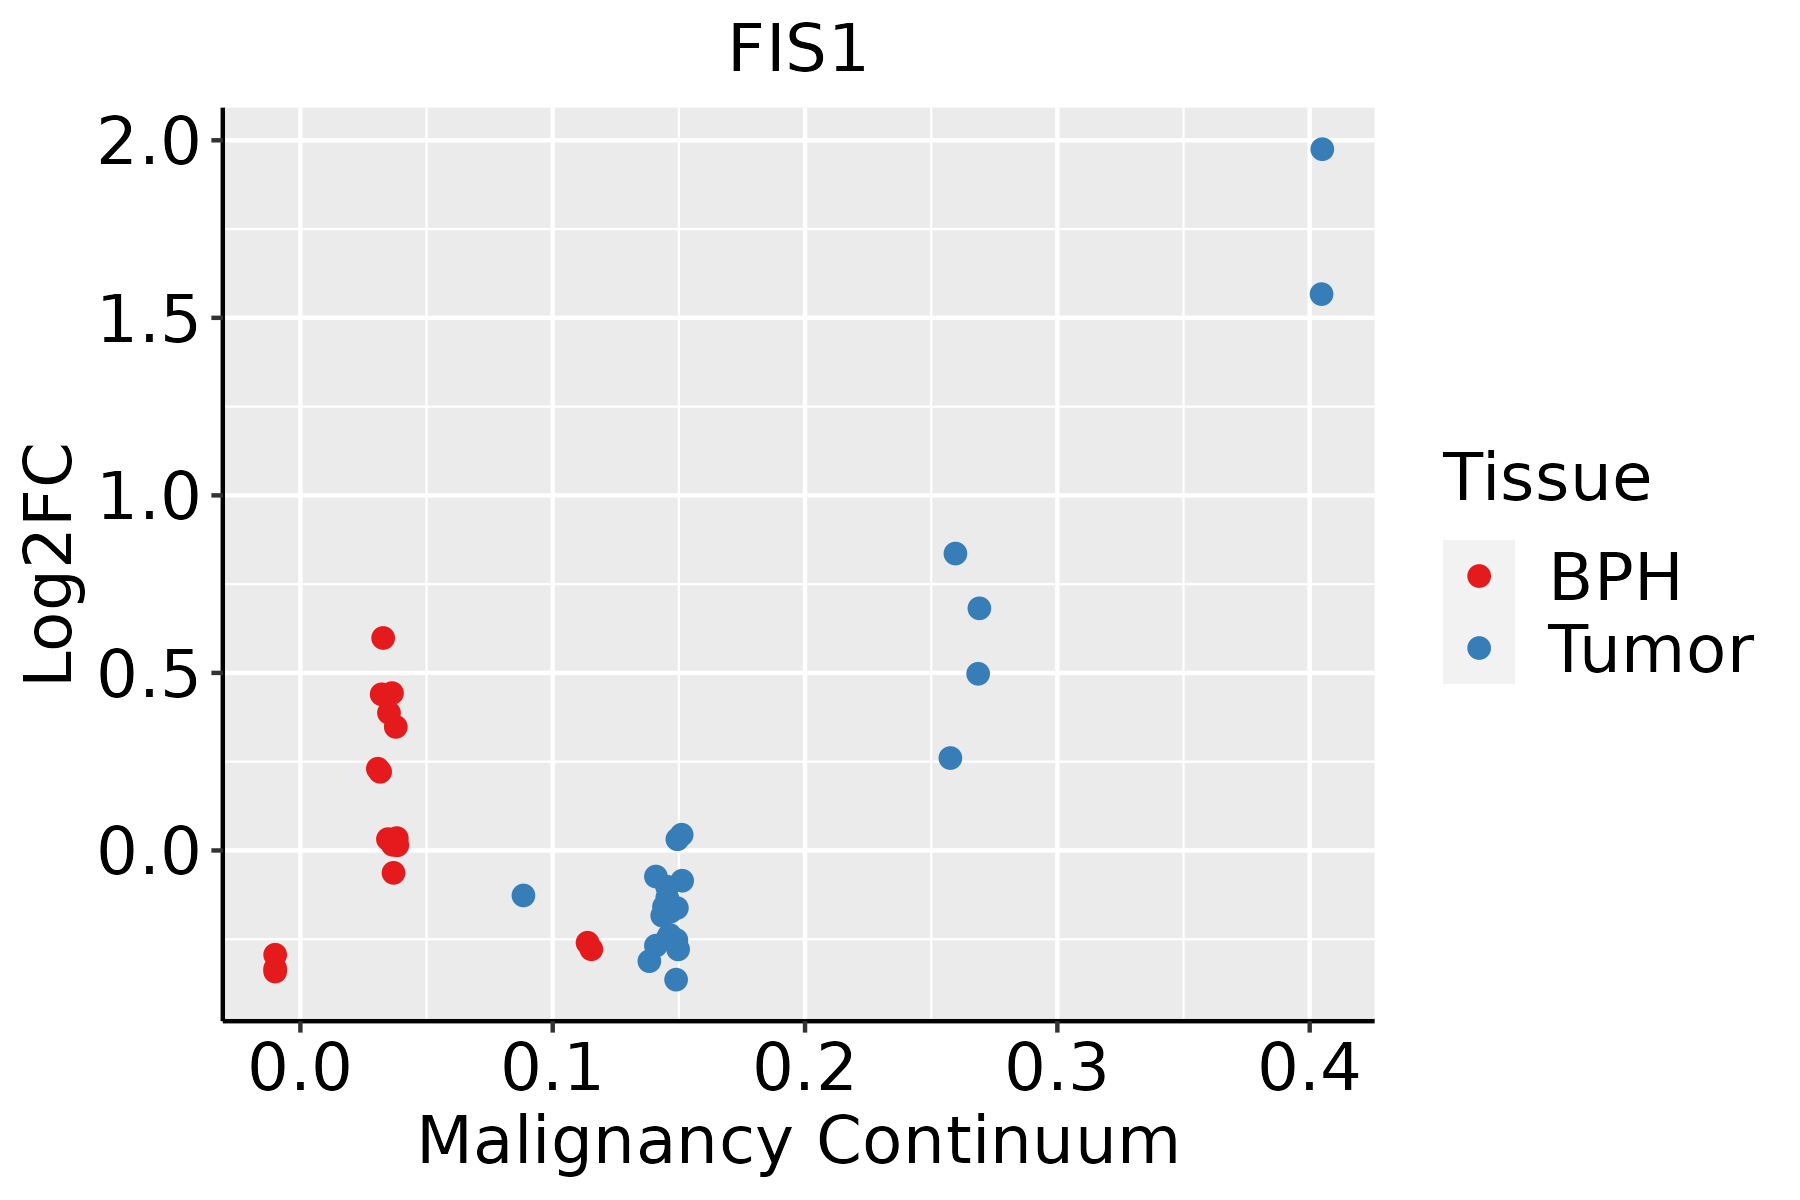 | BPH: Benign Prostatic Hyperplasia |
| Skin | 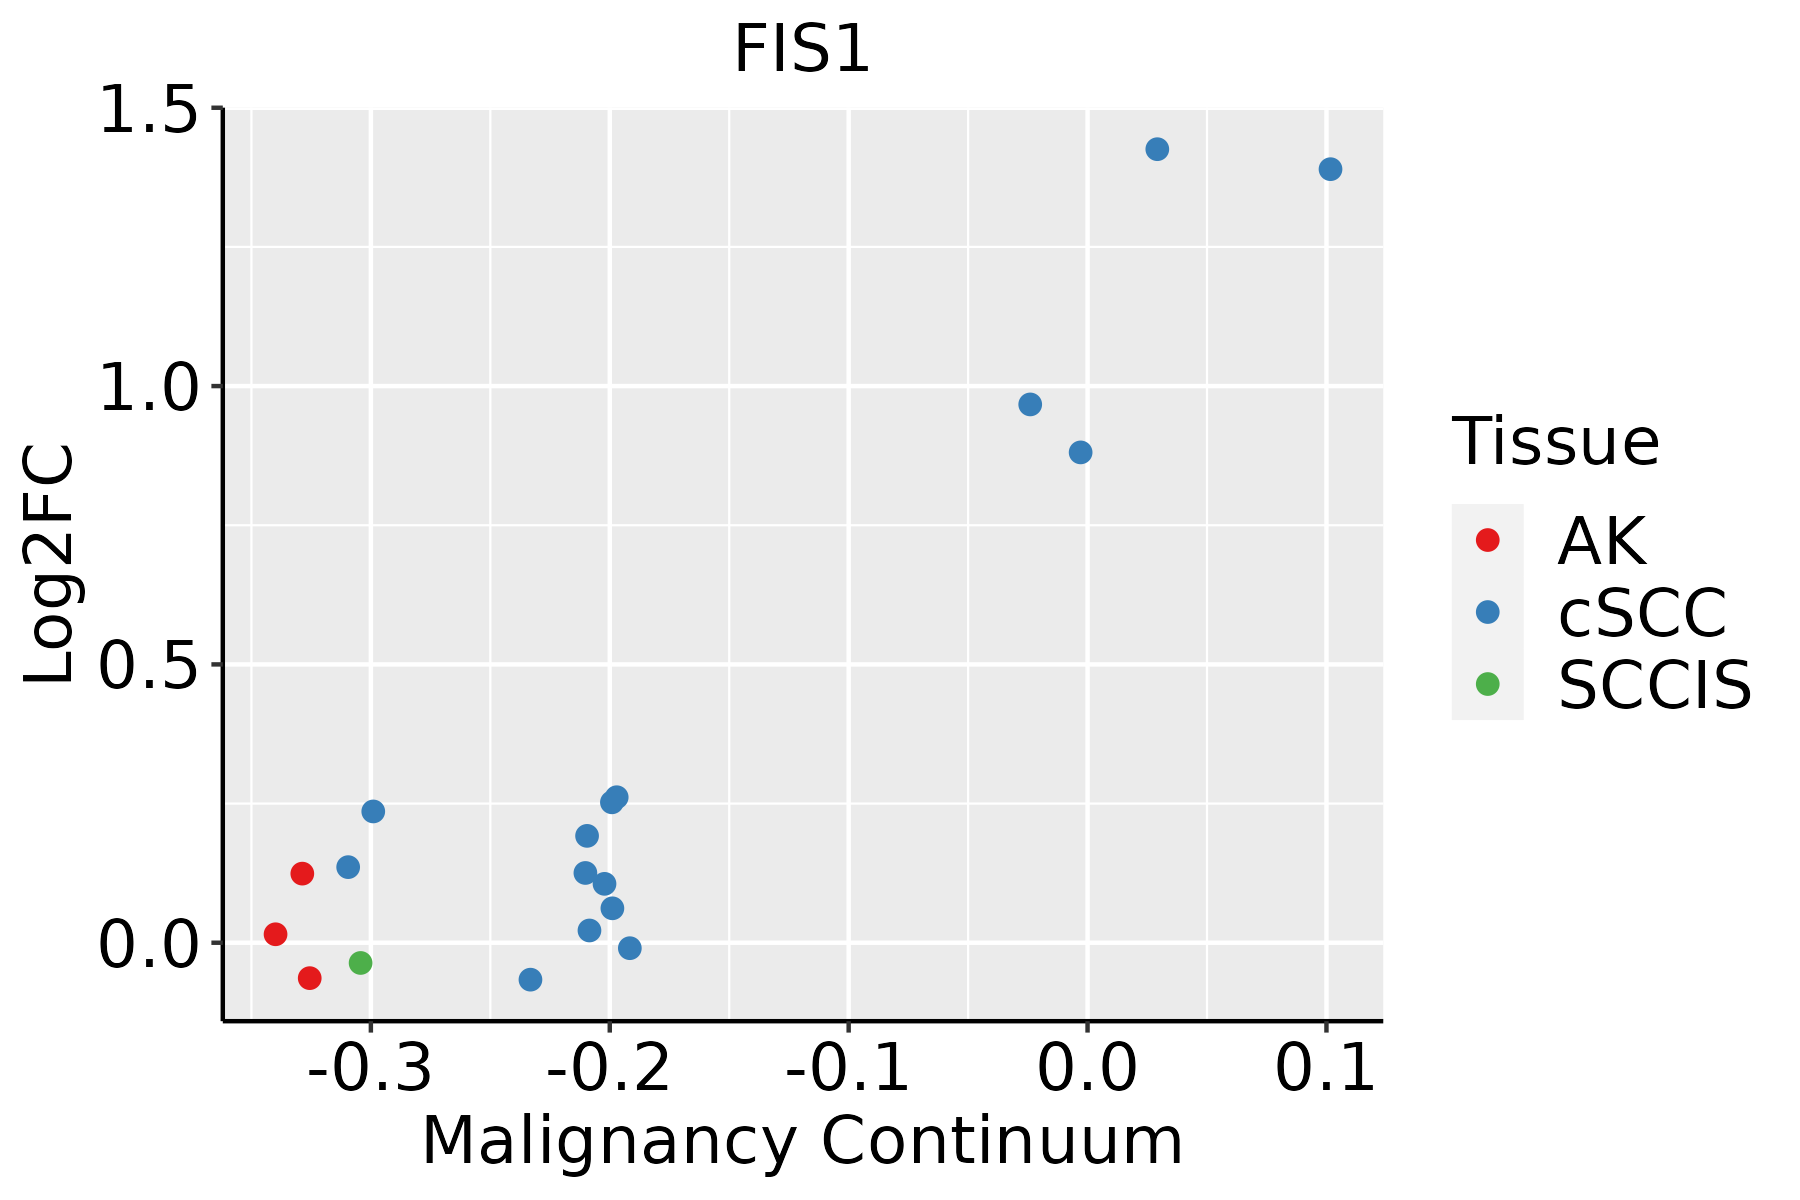 | AK: Actinic keratosis |
| cSCC: Cutaneous squamous cell carcinoma | ||
| SCCIS:squamous cell carcinoma in situ | ||
| Thyroid |  | ATC: Anaplastic thyroid cancer |
| HT: Hashimoto's thyroiditis | ||
| PTC: Papillary thyroid cancer |
| ∗log2FC in expression of this searched gene in stem-like cells from each diseased tissue sample relative to stem-like cells in normal samples in each tissue plotted against the malignancy continuum. Samples are colored based on if they are from different disease stage. |
Top |
Malignant transformation related pathway analysis |
| Find out the enriched GO biological processes and KEGG pathways involved in transition from healthy to precancer to cancer |
| Tissue | Disease Stage | Enriched GO biological Processes |
| Colorectum | AD |  |
| Colorectum | SER |  |
| Colorectum | MSS |  |
| Colorectum | MSI-H |  |
| Colorectum | FAP |  |
| ∗Top 15 enriched GO BP terms are showed in the bar plot of each disease state in each tissue. Each row represents a significant GO biological process which is colored according to the -log10(p.adjust). |
| Page: 1 2 3 4 5 6 7 8 9 |
| GO ID | Tissue | Disease Stage | Description | Gene Ratio | Bg Ratio | pvalue | p.adjust | Count |
| GO:004603410 | Cervix | CC | ATP metabolic process | 90/2311 | 277/18723 | 7.90e-19 | 2.36e-15 | 90 |
| GO:009719310 | Cervix | CC | intrinsic apoptotic signaling pathway | 85/2311 | 288/18723 | 4.56e-15 | 6.46e-12 | 85 |
| GO:200123310 | Cervix | CC | regulation of apoptotic signaling pathway | 96/2311 | 356/18723 | 4.08e-14 | 3.05e-11 | 96 |
| GO:005254710 | Cervix | CC | regulation of peptidase activity | 112/2311 | 461/18723 | 6.70e-13 | 3.08e-10 | 112 |
| GO:004586210 | Cervix | CC | positive regulation of proteolysis | 95/2311 | 372/18723 | 1.84e-12 | 6.86e-10 | 95 |
| GO:005254810 | Cervix | CC | regulation of endopeptidase activity | 103/2311 | 432/18723 | 1.89e-11 | 5.14e-09 | 103 |
| GO:200124210 | Cervix | CC | regulation of intrinsic apoptotic signaling pathway | 52/2311 | 164/18723 | 5.06e-11 | 1.01e-08 | 52 |
| GO:00725949 | Cervix | CC | establishment of protein localization to organelle | 99/2311 | 422/18723 | 1.23e-10 | 2.11e-08 | 99 |
| GO:190382910 | Cervix | CC | positive regulation of cellular protein localization | 72/2311 | 276/18723 | 3.20e-10 | 4.46e-08 | 72 |
| GO:001095210 | Cervix | CC | positive regulation of peptidase activity | 54/2311 | 197/18723 | 8.06e-09 | 6.99e-07 | 54 |
| GO:200011610 | Cervix | CC | regulation of cysteine-type endopeptidase activity | 61/2311 | 235/18723 | 8.69e-09 | 7.22e-07 | 61 |
| GO:005122210 | Cervix | CC | positive regulation of protein transport | 72/2311 | 303/18723 | 2.36e-08 | 1.70e-06 | 72 |
| GO:004328110 | Cervix | CC | regulation of cysteine-type endopeptidase activity involved in apoptotic process | 55/2311 | 209/18723 | 2.77e-08 | 1.95e-06 | 55 |
| GO:190495110 | Cervix | CC | positive regulation of establishment of protein localization | 73/2311 | 319/18723 | 9.69e-08 | 5.25e-06 | 73 |
| GO:001095010 | Cervix | CC | positive regulation of endopeptidase activity | 48/2311 | 179/18723 | 1.12e-07 | 5.71e-06 | 48 |
| GO:20012357 | Cervix | CC | positive regulation of apoptotic signaling pathway | 37/2311 | 126/18723 | 2.70e-07 | 1.12e-05 | 37 |
| GO:00068399 | Cervix | CC | mitochondrial transport | 60/2311 | 254/18723 | 4.21e-07 | 1.67e-05 | 60 |
| GO:000660510 | Cervix | CC | protein targeting | 68/2311 | 314/18723 | 2.17e-06 | 6.55e-05 | 68 |
| GO:00903167 | Cervix | CC | positive regulation of intracellular protein transport | 41/2311 | 160/18723 | 3.24e-06 | 8.80e-05 | 41 |
| GO:00323868 | Cervix | CC | regulation of intracellular transport | 71/2311 | 337/18723 | 3.70e-06 | 9.74e-05 | 71 |
| Page: 1 2 3 4 5 6 7 8 9 10 11 12 13 14 15 16 17 18 19 20 21 22 23 24 25 26 27 28 29 30 31 32 33 34 35 36 37 38 39 40 41 42 43 44 45 46 47 48 49 50 51 52 53 54 55 56 57 58 59 60 61 62 63 64 65 66 67 68 69 70 71 72 73 74 75 76 77 78 79 80 81 82 83 84 |
| Pathway ID | Tissue | Disease Stage | Description | Gene Ratio | Bg Ratio | pvalue | p.adjust | qvalue | Count |
| hsa0413718 | Cervix | CC | Mitophagy - animal | 22/1267 | 72/8465 | 5.77e-04 | 2.75e-03 | 1.63e-03 | 22 |
| hsa0413719 | Cervix | CC | Mitophagy - animal | 22/1267 | 72/8465 | 5.77e-04 | 2.75e-03 | 1.63e-03 | 22 |
| hsa04137 | Colorectum | AD | Mitophagy - animal | 29/2092 | 72/8465 | 2.49e-03 | 1.35e-02 | 8.59e-03 | 29 |
| hsa041371 | Colorectum | AD | Mitophagy - animal | 29/2092 | 72/8465 | 2.49e-03 | 1.35e-02 | 8.59e-03 | 29 |
| hsa041372 | Colorectum | SER | Mitophagy - animal | 22/1580 | 72/8465 | 9.93e-03 | 4.78e-02 | 3.47e-02 | 22 |
| hsa041373 | Colorectum | SER | Mitophagy - animal | 22/1580 | 72/8465 | 9.93e-03 | 4.78e-02 | 3.47e-02 | 22 |
| hsa041374 | Colorectum | MSS | Mitophagy - animal | 27/1875 | 72/8465 | 2.17e-03 | 1.10e-02 | 6.76e-03 | 27 |
| hsa041375 | Colorectum | MSS | Mitophagy - animal | 27/1875 | 72/8465 | 2.17e-03 | 1.10e-02 | 6.76e-03 | 27 |
| hsa0413720 | Endometrium | AEH | Mitophagy - animal | 21/1197 | 72/8465 | 7.03e-04 | 4.86e-03 | 3.56e-03 | 21 |
| hsa04137110 | Endometrium | AEH | Mitophagy - animal | 21/1197 | 72/8465 | 7.03e-04 | 4.86e-03 | 3.56e-03 | 21 |
| hsa0413725 | Endometrium | EEC | Mitophagy - animal | 22/1237 | 72/8465 | 4.12e-04 | 3.30e-03 | 2.46e-03 | 22 |
| hsa0413735 | Endometrium | EEC | Mitophagy - animal | 22/1237 | 72/8465 | 4.12e-04 | 3.30e-03 | 2.46e-03 | 22 |
| hsa04137210 | Esophagus | ESCC | Mitophagy - animal | 54/4205 | 72/8465 | 9.33e-06 | 4.96e-05 | 2.54e-05 | 54 |
| hsa0413738 | Esophagus | ESCC | Mitophagy - animal | 54/4205 | 72/8465 | 9.33e-06 | 4.96e-05 | 2.54e-05 | 54 |
| hsa0413721 | Liver | Cirrhotic | Mitophagy - animal | 39/2530 | 72/8465 | 1.38e-05 | 1.24e-04 | 7.64e-05 | 39 |
| hsa0413731 | Liver | Cirrhotic | Mitophagy - animal | 39/2530 | 72/8465 | 1.38e-05 | 1.24e-04 | 7.64e-05 | 39 |
| hsa0413741 | Liver | HCC | Mitophagy - animal | 53/4020 | 72/8465 | 5.49e-06 | 4.59e-05 | 2.56e-05 | 53 |
| hsa0413751 | Liver | HCC | Mitophagy - animal | 53/4020 | 72/8465 | 5.49e-06 | 4.59e-05 | 2.56e-05 | 53 |
| hsa0413761 | Liver | Cyst | Mitophagy - animal | 9/339 | 72/8465 | 2.19e-03 | 1.91e-02 | 1.58e-02 | 9 |
| hsa0413771 | Liver | Cyst | Mitophagy - animal | 9/339 | 72/8465 | 2.19e-03 | 1.91e-02 | 1.58e-02 | 9 |
| Page: 1 2 |
Top |
Cell-cell communication analysis |
| Identification of potential cell-cell interactions between two cell types and their ligand-receptor pairs for different disease states |
| Ligand | Receptor | LRpair | Pathway | Tissue | Disease Stage |
| Page: 1 |
Top |
Single-cell gene regulatory network inference analysis |
| Find out the significant the regulons (TFs) and the target genes of each regulon across cell types for different disease states |
| TF | Cell Type | Tissue | Disease Stage | Target Gene | RSS | Regulon Activity |
| ∗The dot plots of a searched regulon are shown for all cell subpopulations in each disease state of each tissue based on the regulon specific score inferred using pySCENIC and by calculating the average expression. |
| Page: 1 |
Top |
Somatic mutation of malignant transformation related genes |
| Annotation of somatic variants for genes involved in malignant transformation |
| Hugo Symbol | Variant Class | Variant Classification | dbSNP RS | HGVSc | HGVSp | HGVSp Short | SWISSPROT | BIOTYPE | SIFT | PolyPhen | Tumor Sample Barcode | Tissue | Histology | Sex | Age | Stage | Therapy Types | Drugs | Outcome |
| FIS1 | SNV | Missense_Mutation | novel | c.357N>C | p.Lys119Asn | p.K119N | Q9Y3D6 | protein_coding | tolerated(0.14) | benign(0.102) | TCGA-JW-A5VL-01 | Cervix | cervical & endocervical cancer | Female | <65 | I/II | Unknown | Unknown | SD |
| FIS1 | SNV | Missense_Mutation | c.349G>T | p.Ala117Ser | p.A117S | Q9Y3D6 | protein_coding | tolerated(0.08) | benign(0.429) | TCGA-AG-A02N-01 | Colorectum | rectum adenocarcinoma | Male | >=65 | I/II | Chemotherapy | folinic | CR | |
| FIS1 | SNV | Missense_Mutation | novel | c.350C>T | p.Ala117Val | p.A117V | Q9Y3D6 | protein_coding | deleterious(0.05) | benign(0.41) | TCGA-A5-A0G2-01 | Endometrium | uterine corpus endometrioid carcinoma | Female | <65 | III/IV | Unknown | Unknown | SD |
| FIS1 | SNV | Missense_Mutation | c.439N>A | p.Val147Met | p.V147M | Q9Y3D6 | protein_coding | tolerated(0.58) | possibly_damaging(0.49) | TCGA-A5-A0VP-01 | Endometrium | uterine corpus endometrioid carcinoma | Female | >=65 | I/II | Unknown | Unknown | SD | |
| FIS1 | SNV | Missense_Mutation | rs776529563 | c.430G>A | p.Gly144Arg | p.G144R | Q9Y3D6 | protein_coding | deleterious(0.03) | probably_damaging(0.964) | TCGA-AJ-A3BH-01 | Endometrium | uterine corpus endometrioid carcinoma | Female | Unknown | I/II | Unknown | Unknown | SD |
| FIS1 | SNV | Missense_Mutation | novel | c.130N>T | p.Arg44Trp | p.R44W | Q9Y3D6 | protein_coding | deleterious(0) | probably_damaging(0.998) | TCGA-AJ-A3EK-01 | Endometrium | uterine corpus endometrioid carcinoma | Female | <65 | I/II | Chemotherapy | carboplatin | CR |
| FIS1 | SNV | Missense_Mutation | c.233N>T | p.Ala78Val | p.A78V | Q9Y3D6 | protein_coding | deleterious(0) | probably_damaging(0.993) | TCGA-AX-A0J1-01 | Endometrium | uterine corpus endometrioid carcinoma | Female | >=65 | I/II | Unknown | Unknown | SD | |
| FIS1 | SNV | Missense_Mutation | novel | c.421N>A | p.Gly141Arg | p.G141R | Q9Y3D6 | protein_coding | deleterious(0) | probably_damaging(0.982) | TCGA-AX-A2HD-01 | Endometrium | uterine corpus endometrioid carcinoma | Female | >=65 | III/IV | Unknown | Unknown | SD |
| FIS1 | SNV | Missense_Mutation | novel | c.62N>G | p.Phe21Cys | p.F21C | Q9Y3D6 | protein_coding | deleterious(0) | probably_damaging(0.95) | TCGA-B5-A1MR-01 | Endometrium | uterine corpus endometrioid carcinoma | Female | >=65 | III/IV | Unknown | Unknown | SD |
| FIS1 | SNV | Missense_Mutation | novel | c.421G>A | p.Gly141Arg | p.G141R | Q9Y3D6 | protein_coding | deleterious(0) | probably_damaging(0.982) | TCGA-D1-A16Y-01 | Endometrium | uterine corpus endometrioid carcinoma | Female | <65 | I/II | Unknown | Unknown | SD |
| Page: 1 2 |
Top |
Related drugs of malignant transformation related genes |
| Identification of chemicals and drugs interact with genes involved in malignant transfromation |
| (DGIdb 4.0) |
| Entrez ID | Symbol | Category | Interaction Types | Drug Claim Name | Drug Name | PMIDs |
| Page: 1 |

Copyright 2023-Present -The University of Texas Health Science Center at Houston |