
|
|||||
|
 | |
| |
| |
| |
| |
| |
|
Gene: FIP1L1 |
Gene summary for FIP1L1 |
| Gene information | Species | Human | Gene symbol | FIP1L1 | Gene ID | 81608 |
| Gene name | factor interacting with PAPOLA and CPSF1 | |
| Gene Alias | FIP1 | |
| Cytomap | 4q12 | |
| Gene Type | protein-coding | GO ID | GO:0006139 | UniProtAcc | Q6UN15 |
Top |
Malignant transformation analysis |
| Identification of the aberrant gene expression in precancerous and cancerous lesions by comparing the gene expression of stem-like cells in diseased tissues with normal stem cells |
| Entrez ID | Symbol | Replicates | Species | Organ | Tissue | Adj P-value | Log2FC | Malignancy |
| 81608 | FIP1L1 | LZE2T | Human | Esophagus | ESCC | 1.11e-03 | 7.14e-01 | 0.082 |
| 81608 | FIP1L1 | LZE4T | Human | Esophagus | ESCC | 4.58e-08 | 4.35e-01 | 0.0811 |
| 81608 | FIP1L1 | LZE7T | Human | Esophagus | ESCC | 9.01e-06 | 7.42e-01 | 0.0667 |
| 81608 | FIP1L1 | LZE8T | Human | Esophagus | ESCC | 2.56e-07 | 2.44e-01 | 0.067 |
| 81608 | FIP1L1 | LZE20T | Human | Esophagus | ESCC | 6.04e-04 | 1.78e-01 | 0.0662 |
| 81608 | FIP1L1 | LZE21D1 | Human | Esophagus | HGIN | 3.72e-02 | 1.60e-01 | 0.0632 |
| 81608 | FIP1L1 | LZE24T | Human | Esophagus | ESCC | 7.76e-12 | 3.64e-01 | 0.0596 |
| 81608 | FIP1L1 | LZE21T | Human | Esophagus | ESCC | 3.54e-04 | 3.25e-01 | 0.0655 |
| 81608 | FIP1L1 | LZE6T | Human | Esophagus | ESCC | 6.01e-04 | 2.65e-01 | 0.0845 |
| 81608 | FIP1L1 | P1T-E | Human | Esophagus | ESCC | 1.34e-05 | 4.82e-01 | 0.0875 |
| 81608 | FIP1L1 | P2T-E | Human | Esophagus | ESCC | 4.60e-42 | 8.28e-01 | 0.1177 |
| 81608 | FIP1L1 | P4T-E | Human | Esophagus | ESCC | 6.89e-29 | 7.17e-01 | 0.1323 |
| 81608 | FIP1L1 | P5T-E | Human | Esophagus | ESCC | 2.80e-12 | 2.73e-01 | 0.1327 |
| 81608 | FIP1L1 | P8T-E | Human | Esophagus | ESCC | 1.44e-37 | 6.64e-01 | 0.0889 |
| 81608 | FIP1L1 | P9T-E | Human | Esophagus | ESCC | 4.26e-12 | 2.70e-01 | 0.1131 |
| 81608 | FIP1L1 | P10T-E | Human | Esophagus | ESCC | 1.61e-23 | 4.96e-01 | 0.116 |
| 81608 | FIP1L1 | P11T-E | Human | Esophagus | ESCC | 3.25e-18 | 6.94e-01 | 0.1426 |
| 81608 | FIP1L1 | P12T-E | Human | Esophagus | ESCC | 2.85e-53 | 1.00e+00 | 0.1122 |
| 81608 | FIP1L1 | P15T-E | Human | Esophagus | ESCC | 7.56e-27 | 6.64e-01 | 0.1149 |
| 81608 | FIP1L1 | P16T-E | Human | Esophagus | ESCC | 3.06e-38 | 7.32e-01 | 0.1153 |
| Page: 1 2 3 4 5 6 |
| Tissue | Expression Dynamics | Abbreviation |
| Esophagus |  | ESCC: Esophageal squamous cell carcinoma |
| HGIN: High-grade intraepithelial neoplasias | ||
| LGIN: Low-grade intraepithelial neoplasias | ||
| Liver |  | HCC: Hepatocellular carcinoma |
| NAFLD: Non-alcoholic fatty liver disease | ||
| Oral Cavity |  | EOLP: Erosive Oral lichen planus |
| LP: leukoplakia | ||
| NEOLP: Non-erosive oral lichen planus | ||
| OSCC: Oral squamous cell carcinoma | ||
| Skin | 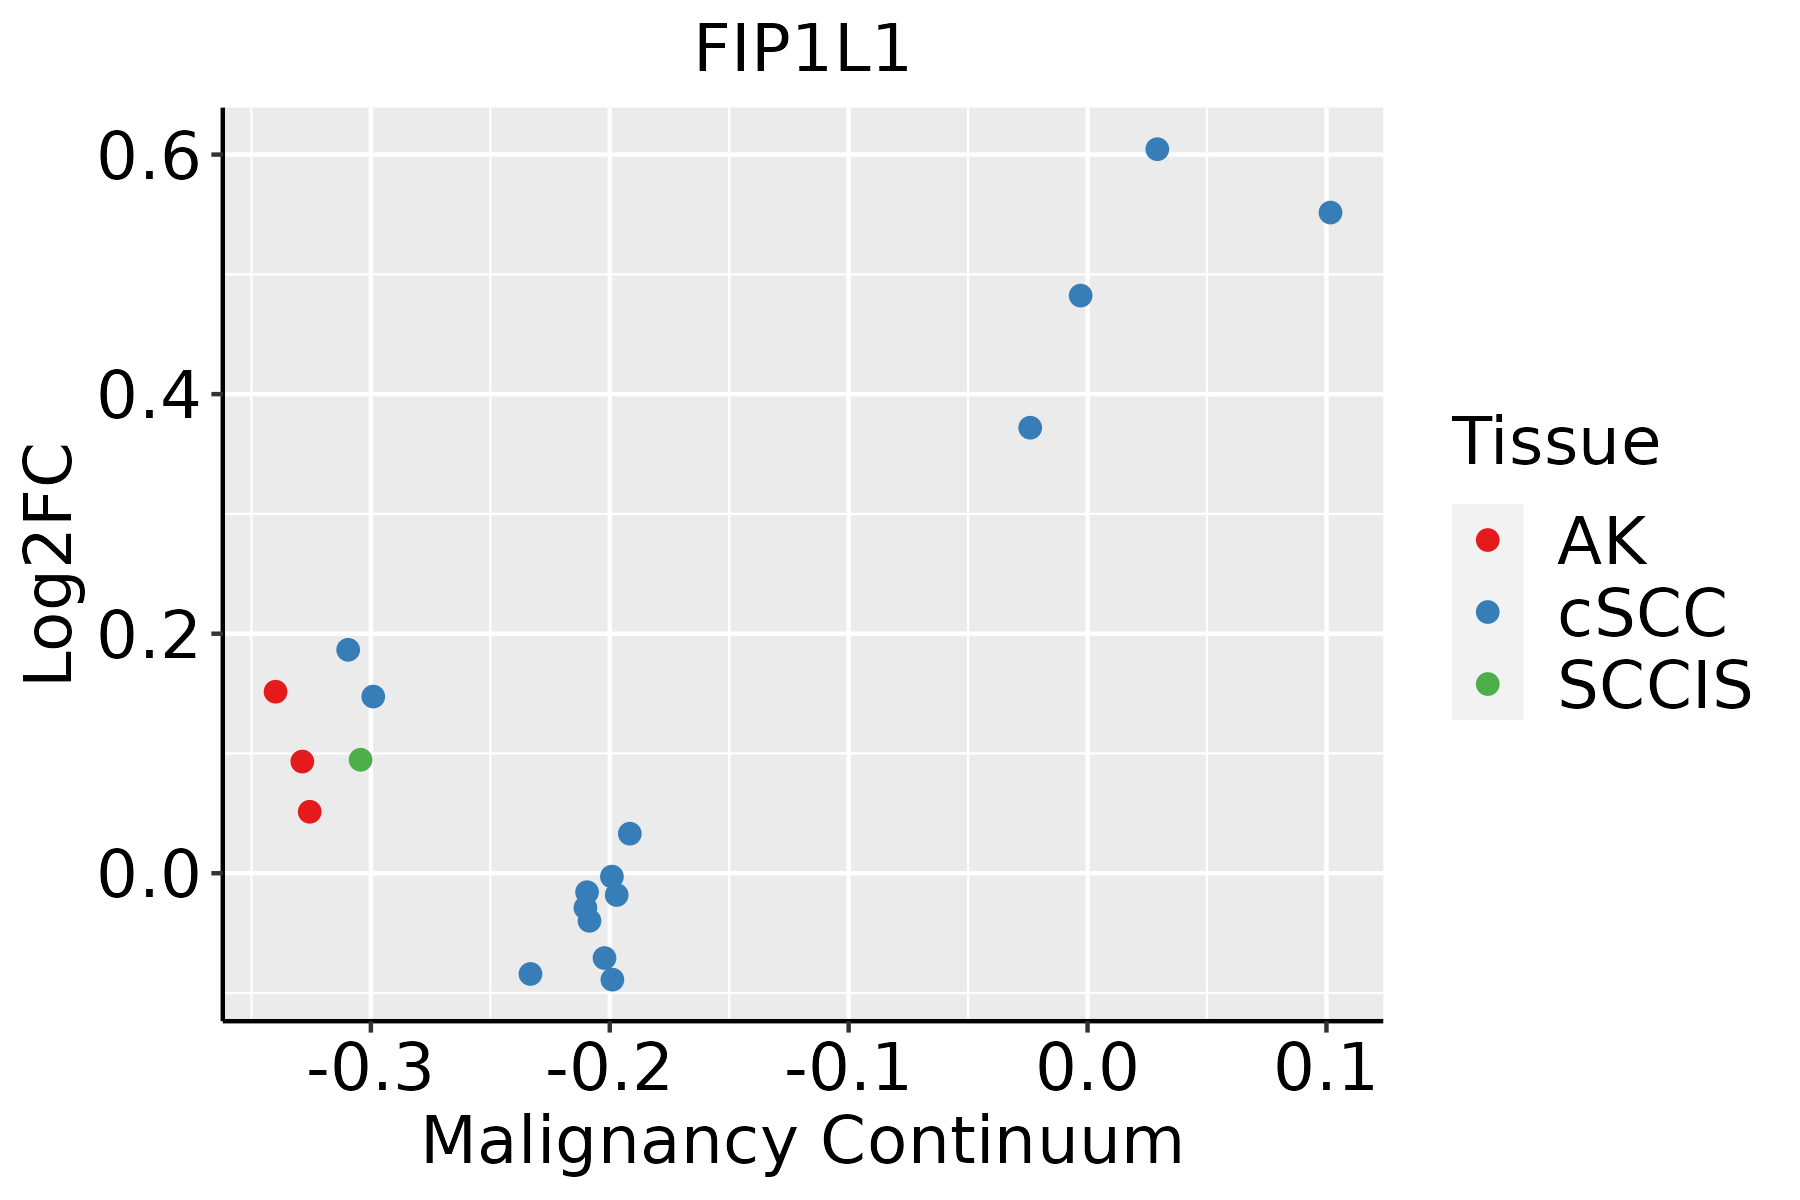 | AK: Actinic keratosis |
| cSCC: Cutaneous squamous cell carcinoma | ||
| SCCIS:squamous cell carcinoma in situ | ||
| Thyroid | 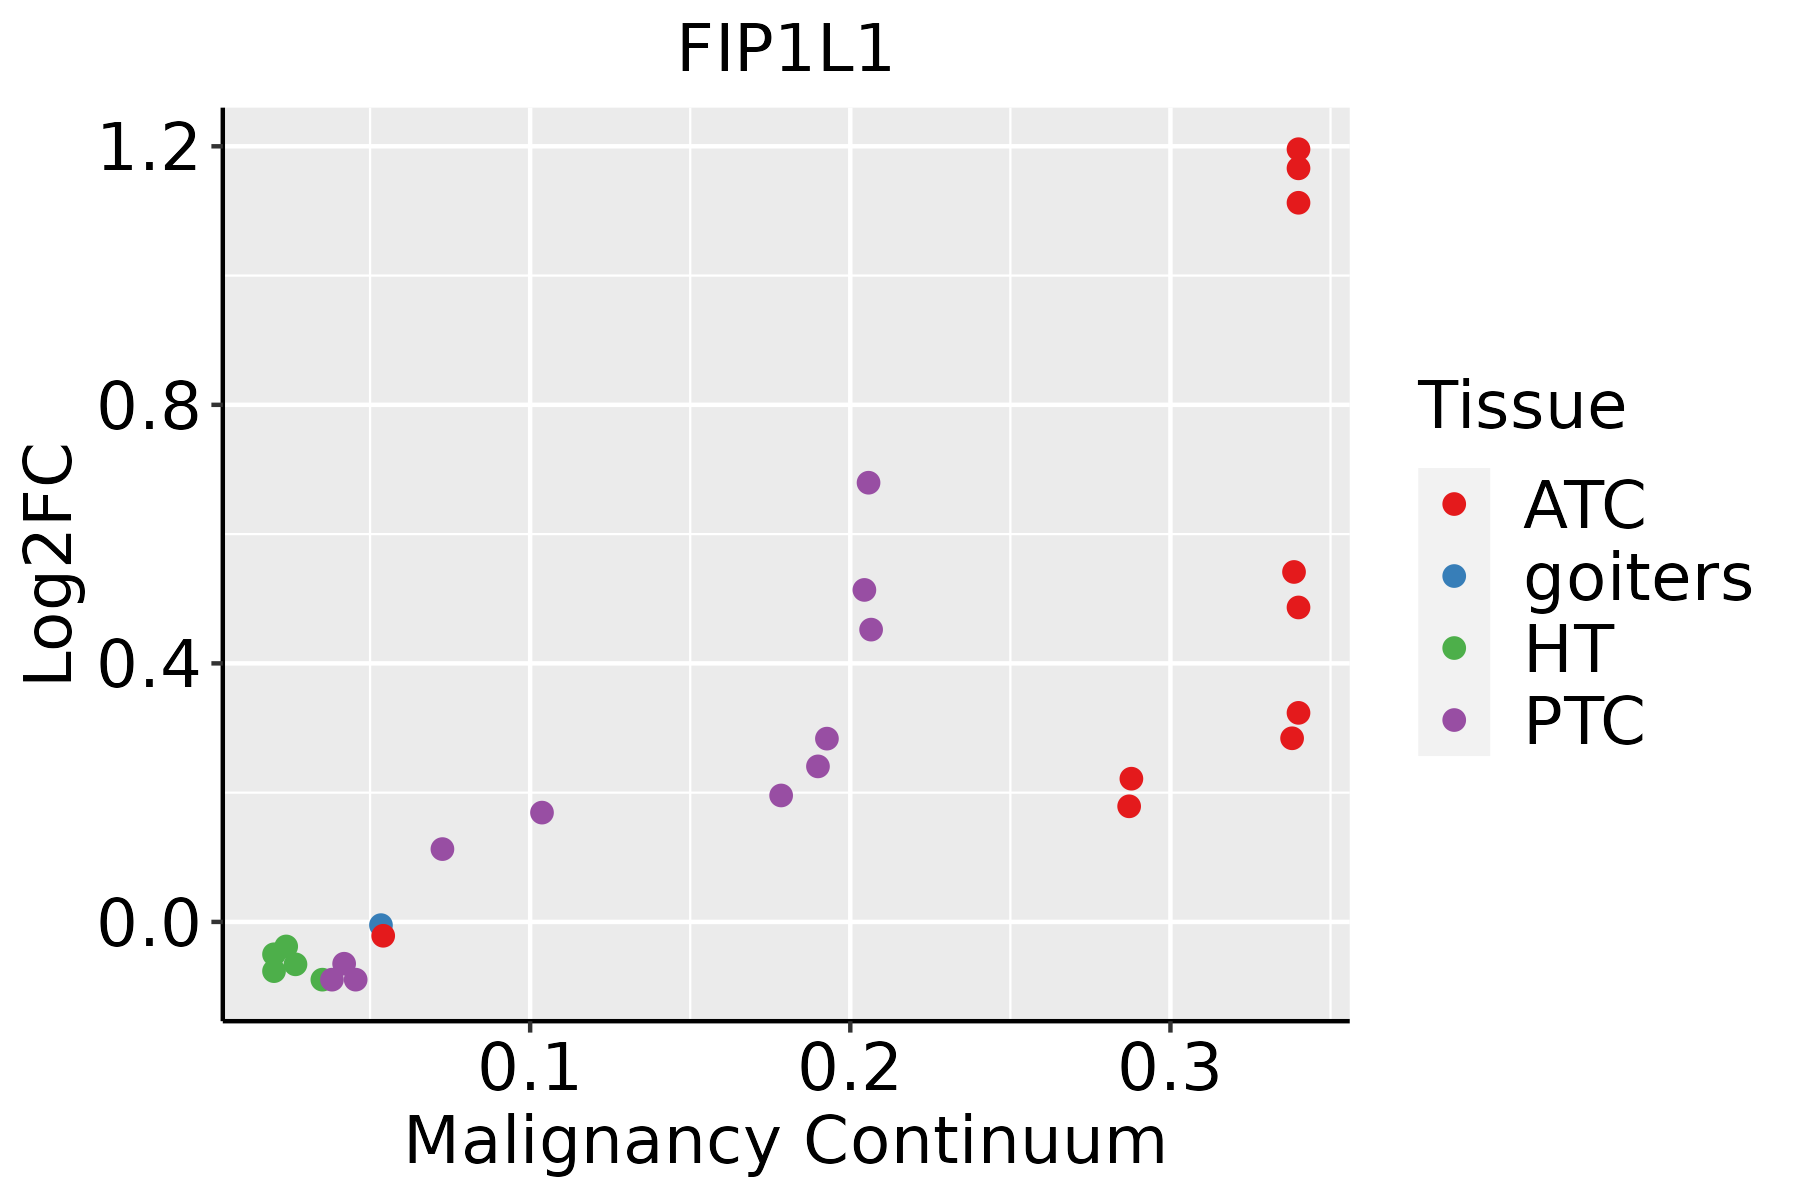 | ATC: Anaplastic thyroid cancer |
| HT: Hashimoto's thyroiditis | ||
| PTC: Papillary thyroid cancer |
| ∗log2FC in expression of this searched gene in stem-like cells from each diseased tissue sample relative to stem-like cells in normal samples in each tissue plotted against the malignancy continuum. Samples are colored based on if they are from different disease stage. |
Top |
Malignant transformation related pathway analysis |
| Find out the enriched GO biological processes and KEGG pathways involved in transition from healthy to precancer to cancer |
| Tissue | Disease Stage | Enriched GO biological Processes |
| Colorectum | AD |  |
| Colorectum | SER |  |
| Colorectum | MSS |  |
| Colorectum | MSI-H |  |
| Colorectum | FAP |  |
| ∗Top 15 enriched GO BP terms are showed in the bar plot of each disease state in each tissue. Each row represents a significant GO biological process which is colored according to the -log10(p.adjust). |
| Page: 1 2 3 4 5 6 7 8 9 |
| GO ID | Tissue | Disease Stage | Description | Gene Ratio | Bg Ratio | pvalue | p.adjust | Count |
| GO:00311243 | Esophagus | HGIN | mRNA 3'-end processing | 18/2587 | 62/18723 | 1.37e-03 | 1.61e-02 | 18 |
| GO:00905013 | Esophagus | ESCC | RNA phosphodiester bond hydrolysis | 110/8552 | 152/18723 | 1.95e-11 | 6.81e-10 | 110 |
| GO:00903053 | Esophagus | ESCC | nucleic acid phosphodiester bond hydrolysis | 163/8552 | 261/18723 | 3.07e-08 | 5.73e-07 | 163 |
| GO:003112412 | Esophagus | ESCC | mRNA 3'-end processing | 47/8552 | 62/18723 | 1.29e-06 | 1.58e-05 | 47 |
| GO:00311233 | Esophagus | ESCC | RNA 3'-end processing | 76/8552 | 116/18723 | 1.25e-05 | 1.15e-04 | 76 |
| GO:00063783 | Esophagus | ESCC | mRNA polyadenylation | 33/8552 | 44/18723 | 7.30e-05 | 5.49e-04 | 33 |
| GO:00436313 | Esophagus | ESCC | RNA polyadenylation | 33/8552 | 45/18723 | 1.54e-04 | 1.02e-03 | 33 |
| GO:00063793 | Esophagus | ESCC | mRNA cleavage | 17/8552 | 22/18723 | 2.60e-03 | 1.11e-02 | 17 |
| GO:00987872 | Esophagus | ESCC | mRNA cleavage involved in mRNA processing | 11/8552 | 14/18723 | 1.30e-02 | 4.27e-02 | 11 |
| GO:0090501 | Liver | Cirrhotic | RNA phosphodiester bond hydrolysis | 54/4634 | 152/18723 | 1.89e-03 | 1.19e-02 | 54 |
| GO:0031123 | Liver | Cirrhotic | RNA 3'-end processing | 42/4634 | 116/18723 | 3.85e-03 | 2.10e-02 | 42 |
| GO:0031124 | Liver | Cirrhotic | mRNA 3'-end processing | 25/4634 | 62/18723 | 4.90e-03 | 2.56e-02 | 25 |
| GO:00311241 | Liver | HCC | mRNA 3'-end processing | 50/7958 | 62/18723 | 8.44e-10 | 2.60e-08 | 50 |
| GO:00905011 | Liver | HCC | RNA phosphodiester bond hydrolysis | 101/7958 | 152/18723 | 1.99e-09 | 5.63e-08 | 101 |
| GO:00311231 | Liver | HCC | RNA 3'-end processing | 81/7958 | 116/18723 | 2.27e-09 | 6.32e-08 | 81 |
| GO:0090305 | Liver | HCC | nucleic acid phosphodiester bond hydrolysis | 152/7958 | 261/18723 | 1.90e-07 | 3.46e-06 | 152 |
| GO:0006378 | Liver | HCC | mRNA polyadenylation | 35/7958 | 44/18723 | 5.70e-07 | 9.03e-06 | 35 |
| GO:0043631 | Liver | HCC | RNA polyadenylation | 35/7958 | 45/18723 | 1.51e-06 | 2.15e-05 | 35 |
| GO:0006379 | Liver | HCC | mRNA cleavage | 17/7958 | 22/18723 | 9.84e-04 | 5.70e-03 | 17 |
| GO:0098789 | Liver | HCC | pre-mRNA cleavage required for polyadenylation | 11/7958 | 13/18723 | 2.38e-03 | 1.16e-02 | 11 |
| Page: 1 2 3 |
| Pathway ID | Tissue | Disease Stage | Description | Gene Ratio | Bg Ratio | pvalue | p.adjust | qvalue | Count |
| hsa030159 | Esophagus | HGIN | mRNA surveillance pathway | 30/1383 | 97/8465 | 2.48e-04 | 2.69e-03 | 2.14e-03 | 30 |
| hsa0301514 | Esophagus | HGIN | mRNA surveillance pathway | 30/1383 | 97/8465 | 2.48e-04 | 2.69e-03 | 2.14e-03 | 30 |
| hsa0301524 | Esophagus | ESCC | mRNA surveillance pathway | 72/4205 | 97/8465 | 6.12e-07 | 4.10e-06 | 2.10e-06 | 72 |
| hsa0301534 | Esophagus | ESCC | mRNA surveillance pathway | 72/4205 | 97/8465 | 6.12e-07 | 4.10e-06 | 2.10e-06 | 72 |
| hsa030154 | Liver | Cirrhotic | mRNA surveillance pathway | 46/2530 | 97/8465 | 1.92e-04 | 1.30e-03 | 8.03e-04 | 46 |
| hsa0301511 | Liver | Cirrhotic | mRNA surveillance pathway | 46/2530 | 97/8465 | 1.92e-04 | 1.30e-03 | 8.03e-04 | 46 |
| hsa0301521 | Liver | HCC | mRNA surveillance pathway | 66/4020 | 97/8465 | 3.16e-05 | 1.88e-04 | 1.04e-04 | 66 |
| hsa0301531 | Liver | HCC | mRNA surveillance pathway | 66/4020 | 97/8465 | 3.16e-05 | 1.88e-04 | 1.04e-04 | 66 |
| hsa030158 | Oral cavity | OSCC | mRNA surveillance pathway | 75/3704 | 97/8465 | 1.30e-11 | 2.01e-10 | 1.02e-10 | 75 |
| hsa0301513 | Oral cavity | OSCC | mRNA surveillance pathway | 75/3704 | 97/8465 | 1.30e-11 | 2.01e-10 | 1.02e-10 | 75 |
| hsa0301523 | Oral cavity | LP | mRNA surveillance pathway | 50/2418 | 97/8465 | 1.39e-06 | 1.50e-05 | 9.66e-06 | 50 |
| hsa0301533 | Oral cavity | LP | mRNA surveillance pathway | 50/2418 | 97/8465 | 1.39e-06 | 1.50e-05 | 9.66e-06 | 50 |
| hsa0301541 | Oral cavity | EOLP | mRNA surveillance pathway | 30/1218 | 97/8465 | 2.26e-05 | 1.20e-04 | 7.07e-05 | 30 |
| hsa0301551 | Oral cavity | EOLP | mRNA surveillance pathway | 30/1218 | 97/8465 | 2.26e-05 | 1.20e-04 | 7.07e-05 | 30 |
| hsa030156 | Oral cavity | NEOLP | mRNA surveillance pathway | 25/1112 | 97/8465 | 5.70e-04 | 3.18e-03 | 2.00e-03 | 25 |
| hsa030157 | Oral cavity | NEOLP | mRNA surveillance pathway | 25/1112 | 97/8465 | 5.70e-04 | 3.18e-03 | 2.00e-03 | 25 |
| Page: 1 |
Top |
Cell-cell communication analysis |
| Identification of potential cell-cell interactions between two cell types and their ligand-receptor pairs for different disease states |
| Ligand | Receptor | LRpair | Pathway | Tissue | Disease Stage |
| Page: 1 |
Top |
Single-cell gene regulatory network inference analysis |
| Find out the significant the regulons (TFs) and the target genes of each regulon across cell types for different disease states |
| TF | Cell Type | Tissue | Disease Stage | Target Gene | RSS | Regulon Activity |
| ∗The dot plots of a searched regulon are shown for all cell subpopulations in each disease state of each tissue based on the regulon specific score inferred using pySCENIC and by calculating the average expression. |
| Page: 1 |
Top |
Somatic mutation of malignant transformation related genes |
| Annotation of somatic variants for genes involved in malignant transformation |
| Hugo Symbol | Variant Class | Variant Classification | dbSNP RS | HGVSc | HGVSp | HGVSp Short | SWISSPROT | BIOTYPE | SIFT | PolyPhen | Tumor Sample Barcode | Tissue | Histology | Sex | Age | Stage | Therapy Types | Drugs | Outcome |
| FIP1L1 | SNV | Missense_Mutation | rs748062192 | c.890A>G | p.Asp297Gly | p.D297G | Q6UN15 | protein_coding | tolerated(0.18) | benign(0.158) | TCGA-A2-A0D0-01 | Breast | breast invasive carcinoma | Female | <65 | I/II | Chemotherapy | cytoxan | SD |
| FIP1L1 | SNV | Missense_Mutation | novel | c.377N>A | p.Gly126Glu | p.G126E | Q6UN15 | protein_coding | deleterious(0) | possibly_damaging(0.845) | TCGA-AC-A8OQ-01 | Breast | breast invasive carcinoma | Female | >=65 | I/II | Unknown | Unknown | SD |
| FIP1L1 | SNV | Missense_Mutation | c.1586N>C | p.Arg529Thr | p.R529T | Q6UN15 | protein_coding | deleterious(0.01) | possibly_damaging(0.879) | TCGA-AN-A0XW-01 | Breast | breast invasive carcinoma | Female | <65 | III/IV | Unknown | Unknown | SD | |
| FIP1L1 | SNV | Missense_Mutation | c.292N>A | p.Val98Ile | p.V98I | Q6UN15 | protein_coding | tolerated(0.05) | benign(0.025) | TCGA-BH-A0B6-01 | Breast | breast invasive carcinoma | Female | <65 | I/II | Unknown | Unknown | SD | |
| FIP1L1 | SNV | Missense_Mutation | c.1477C>T | p.Pro493Ser | p.P493S | Q6UN15 | protein_coding | deleterious(0) | probably_damaging(0.979) | TCGA-E9-A22D-01 | Breast | breast invasive carcinoma | Female | <65 | I/II | Chemotherapy | 5-fluorouracil | SD | |
| FIP1L1 | SNV | Missense_Mutation | novel | c.319G>T | p.Ala107Ser | p.A107S | Q6UN15 | protein_coding | tolerated(0.1) | benign(0.075) | TCGA-2W-A8YY-01 | Cervix | cervical & endocervical cancer | Female | <65 | I/II | Chemotherapy | cisplatin | CR |
| FIP1L1 | SNV | Missense_Mutation | c.1300C>T | p.Leu434Phe | p.L434F | Q6UN15 | protein_coding | deleterious(0.05) | probably_damaging(0.979) | TCGA-DR-A0ZM-01 | Cervix | cervical & endocervical cancer | Female | <65 | III/IV | Unspecific | Cisplatin | SD | |
| FIP1L1 | SNV | Missense_Mutation | c.145N>C | p.Glu49Gln | p.E49Q | Q6UN15 | protein_coding | tolerated(0.22) | possibly_damaging(0.644) | TCGA-JW-A5VL-01 | Cervix | cervical & endocervical cancer | Female | <65 | I/II | Unknown | Unknown | SD | |
| FIP1L1 | SNV | Missense_Mutation | c.782N>A | p.Pro261His | p.P261H | Q6UN15 | protein_coding | tolerated(0.09) | probably_damaging(0.921) | TCGA-A6-3809-01 | Colorectum | colon adenocarcinoma | Female | >=65 | I/II | Unknown | Unknown | SD | |
| FIP1L1 | SNV | Missense_Mutation | c.776C>T | p.Ser259Phe | p.S259F | Q6UN15 | protein_coding | deleterious(0) | probably_damaging(0.972) | TCGA-AA-3510-01 | Colorectum | colon adenocarcinoma | Male | >=65 | I/II | Unknown | Unknown | SD |
| Page: 1 2 3 4 5 6 7 |
Top |
Related drugs of malignant transformation related genes |
| Identification of chemicals and drugs interact with genes involved in malignant transfromation |
| (DGIdb 4.0) |
| Entrez ID | Symbol | Category | Interaction Types | Drug Claim Name | Drug Name | PMIDs |
| 81608 | FIP1L1 | CLINICALLY ACTIONABLE, KINASE | Imatinib | IMATINIB | ||
| 81608 | FIP1L1 | CLINICALLY ACTIONABLE, KINASE | imatinib | IMATINIB | 24433361 |
| Page: 1 |

Copyright 2023-Present -The University of Texas Health Science Center at Houston |