
|
|||||
|
 | |
| |
| |
| |
| |
| |
|
Gene: FILIP1 |
Gene summary for FILIP1 |
| Gene information | Species | Human | Gene symbol | FILIP1 | Gene ID | 27145 |
| Gene name | filamin A interacting protein 1 | |
| Gene Alias | FILIP | |
| Cytomap | 6q14.1 | |
| Gene Type | protein-coding | GO ID | GO:0005575 | UniProtAcc | Q7Z7B0 |
Top |
Malignant transformation analysis |
| Identification of the aberrant gene expression in precancerous and cancerous lesions by comparing the gene expression of stem-like cells in diseased tissues with normal stem cells |
| Entrez ID | Symbol | Replicates | Species | Organ | Tissue | Adj P-value | Log2FC | Malignancy |
| 27145 | FILIP1 | HTA11_78_2000001011 | Human | Colorectum | AD | 2.98e-05 | 2.45e-01 | -0.1088 |
| 27145 | FILIP1 | HTA11_347_2000001011 | Human | Colorectum | AD | 3.34e-06 | 2.28e-01 | -0.1954 |
| 27145 | FILIP1 | HTA11_1391_2000001011 | Human | Colorectum | AD | 1.15e-04 | 2.86e-01 | -0.059 |
| 27145 | FILIP1 | HTA11_866_3004761011 | Human | Colorectum | AD | 1.19e-03 | 2.63e-01 | 0.096 |
| 27145 | FILIP1 | HTA11_7663_2000001011 | Human | Colorectum | SER | 1.16e-03 | 4.30e-01 | 0.0131 |
| 27145 | FILIP1 | HTA11_6818_2000001011 | Human | Colorectum | AD | 1.10e-02 | 3.80e-01 | 0.0112 |
| 27145 | FILIP1 | HTA11_99999971662_82457 | Human | Colorectum | MSS | 1.42e-12 | 4.25e-01 | 0.3859 |
| 27145 | FILIP1 | HTA11_99999973899_84307 | Human | Colorectum | MSS | 5.47e-11 | 5.39e-01 | 0.2585 |
| 27145 | FILIP1 | HTA11_99999974143_84620 | Human | Colorectum | MSS | 4.62e-04 | 2.32e-01 | 0.3005 |
| 27145 | FILIP1 | HCC2 | Human | Liver | HCC | 1.51e-07 | 1.39e+00 | 0.5341 |
| 27145 | FILIP1 | Pt13.b | Human | Liver | HCC | 2.81e-14 | 3.56e-01 | 0.0251 |
| 27145 | FILIP1 | S014 | Human | Liver | HCC | 5.55e-25 | 1.19e+00 | 0.2254 |
| 27145 | FILIP1 | S015 | Human | Liver | HCC | 4.93e-30 | 1.41e+00 | 0.2375 |
| 27145 | FILIP1 | S016 | Human | Liver | HCC | 1.06e-40 | 1.33e+00 | 0.2243 |
| 27145 | FILIP1 | RNA-P25T1-P25T1-1 | Human | Lung | AIS | 3.59e-07 | 4.71e-01 | -0.2116 |
| 27145 | FILIP1 | RNA-P25T1-P25T1-4 | Human | Lung | AIS | 2.14e-09 | 5.45e-01 | -0.2119 |
| 27145 | FILIP1 | RNA-P6T1-P6T1-3 | Human | Lung | MIAC | 1.26e-02 | 7.47e-01 | -0.0296 |
| 27145 | FILIP1 | RNA-P6T1-P6T1-4 | Human | Lung | MIAC | 2.59e-04 | 6.99e-01 | -0.0263 |
| 27145 | FILIP1 | RNA-P7T1-P7T1-1 | Human | Lung | AIS | 1.46e-02 | 6.04e-01 | -0.0961 |
| 27145 | FILIP1 | RNA-P7T1-P7T1-2 | Human | Lung | AIS | 3.07e-06 | 7.88e-01 | -0.0876 |
| Page: 1 2 |
| Tissue | Expression Dynamics | Abbreviation |
| Colorectum (GSE201348) | 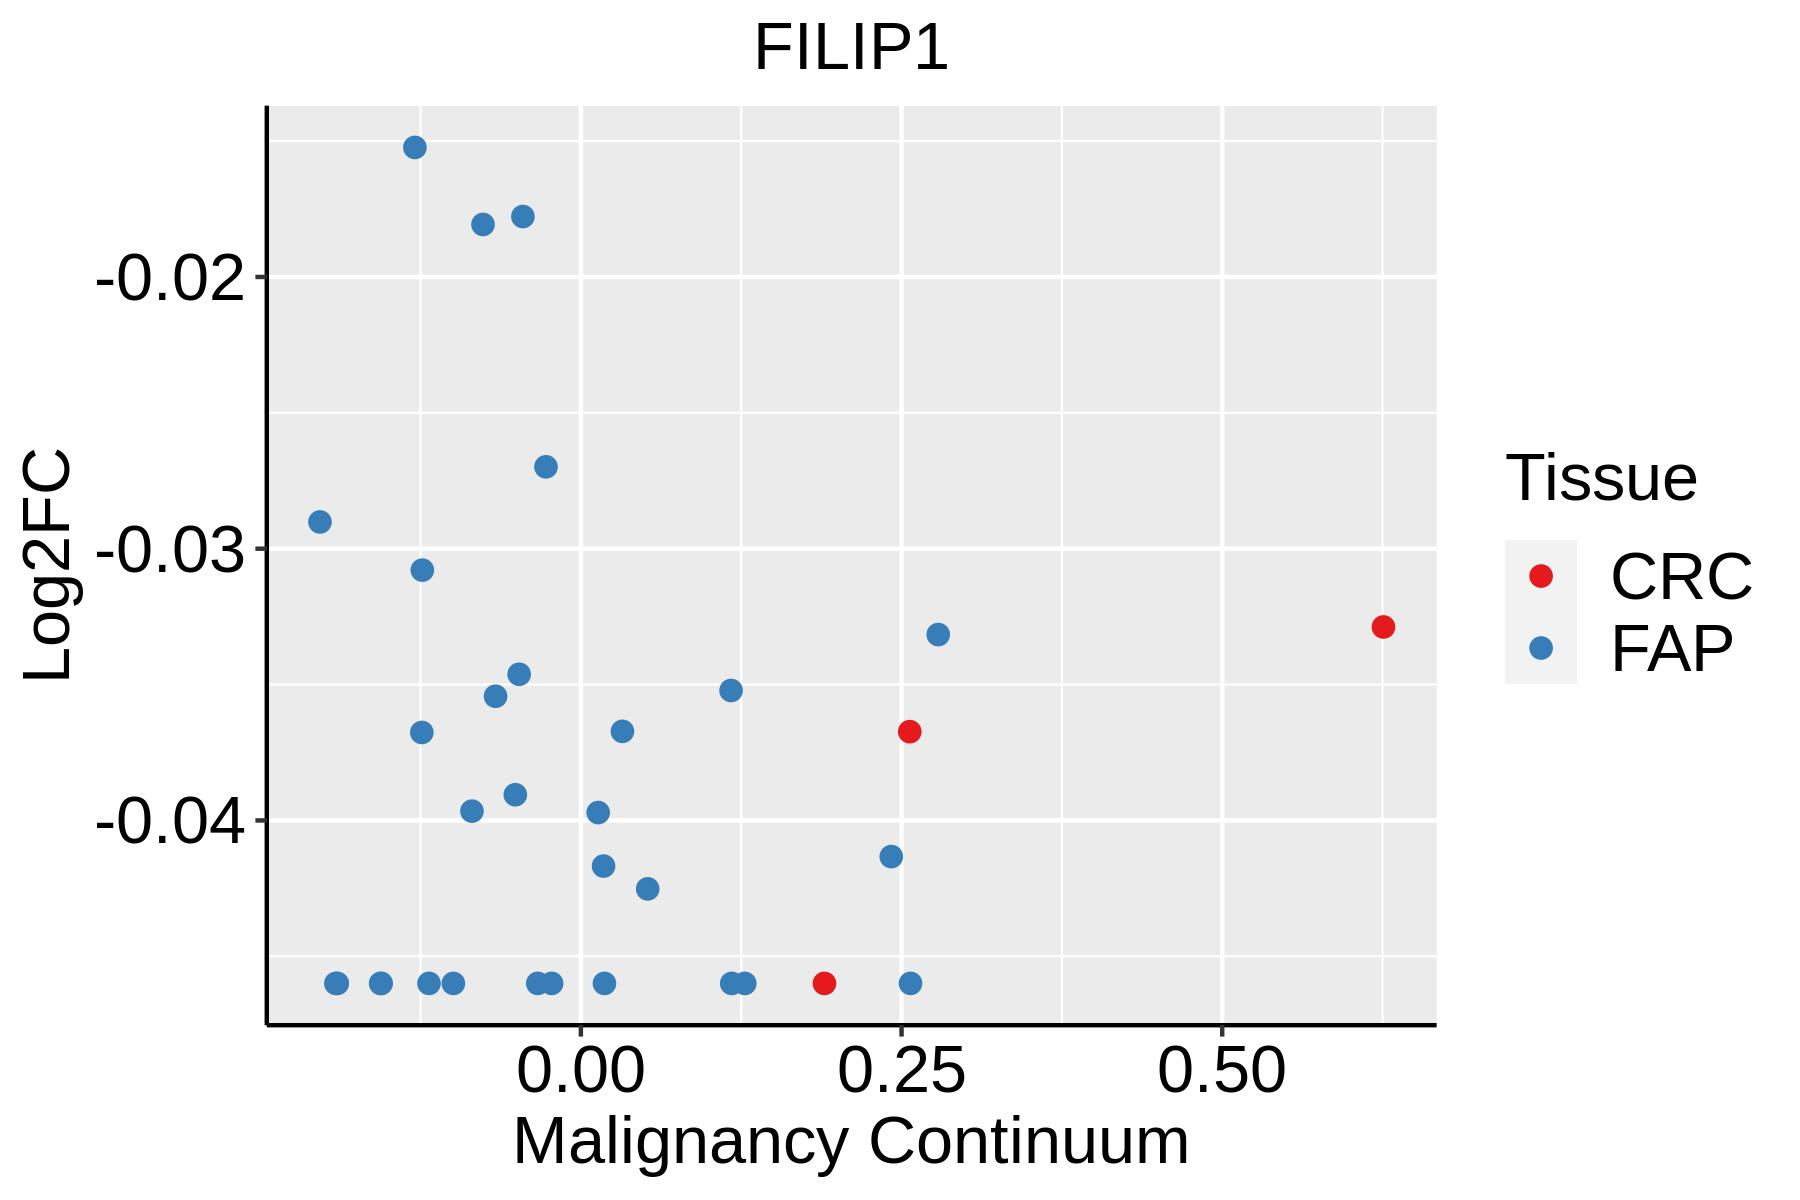 | FAP: Familial adenomatous polyposis |
| CRC: Colorectal cancer | ||
| Colorectum (HTA11) |  | AD: Adenomas |
| SER: Sessile serrated lesions | ||
| MSI-H: Microsatellite-high colorectal cancer | ||
| MSS: Microsatellite stable colorectal cancer | ||
| Liver | 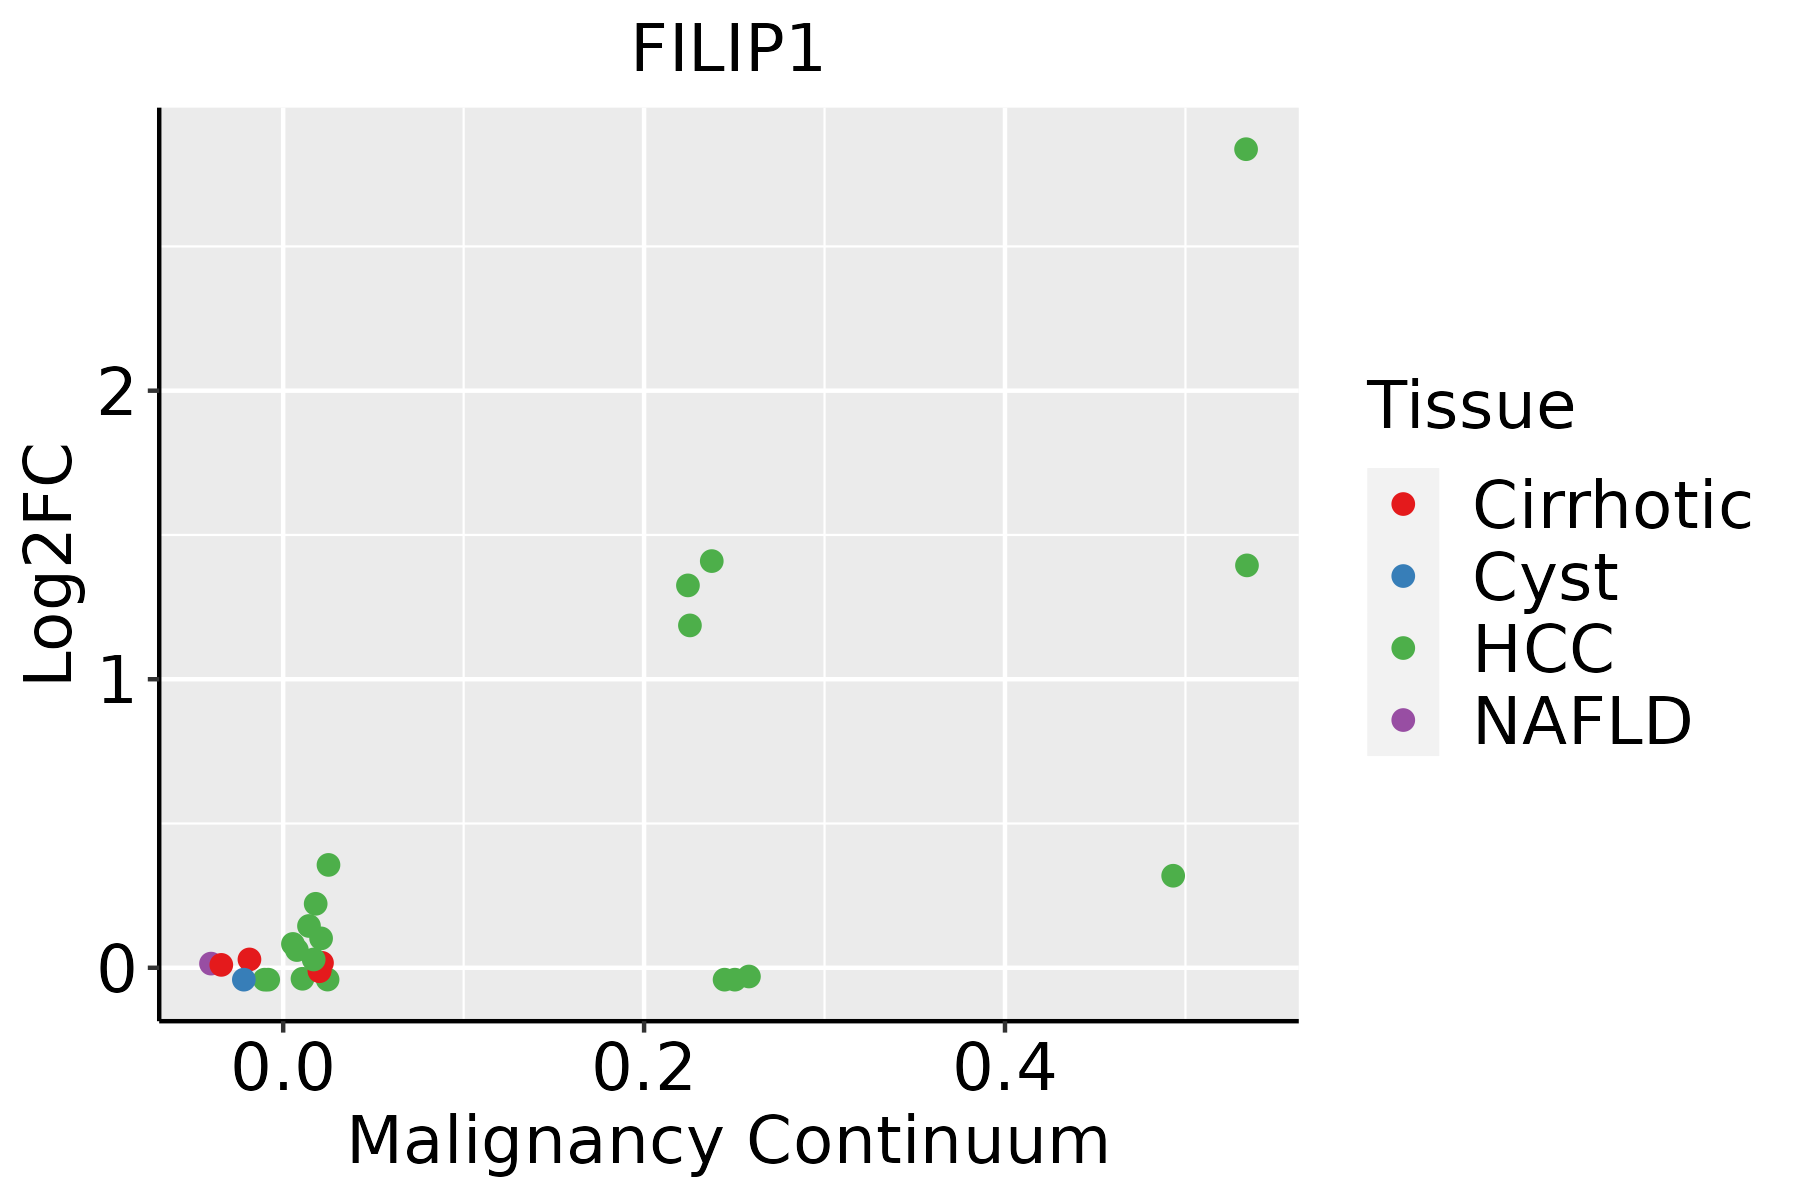 | HCC: Hepatocellular carcinoma |
| NAFLD: Non-alcoholic fatty liver disease | ||
| Lung | 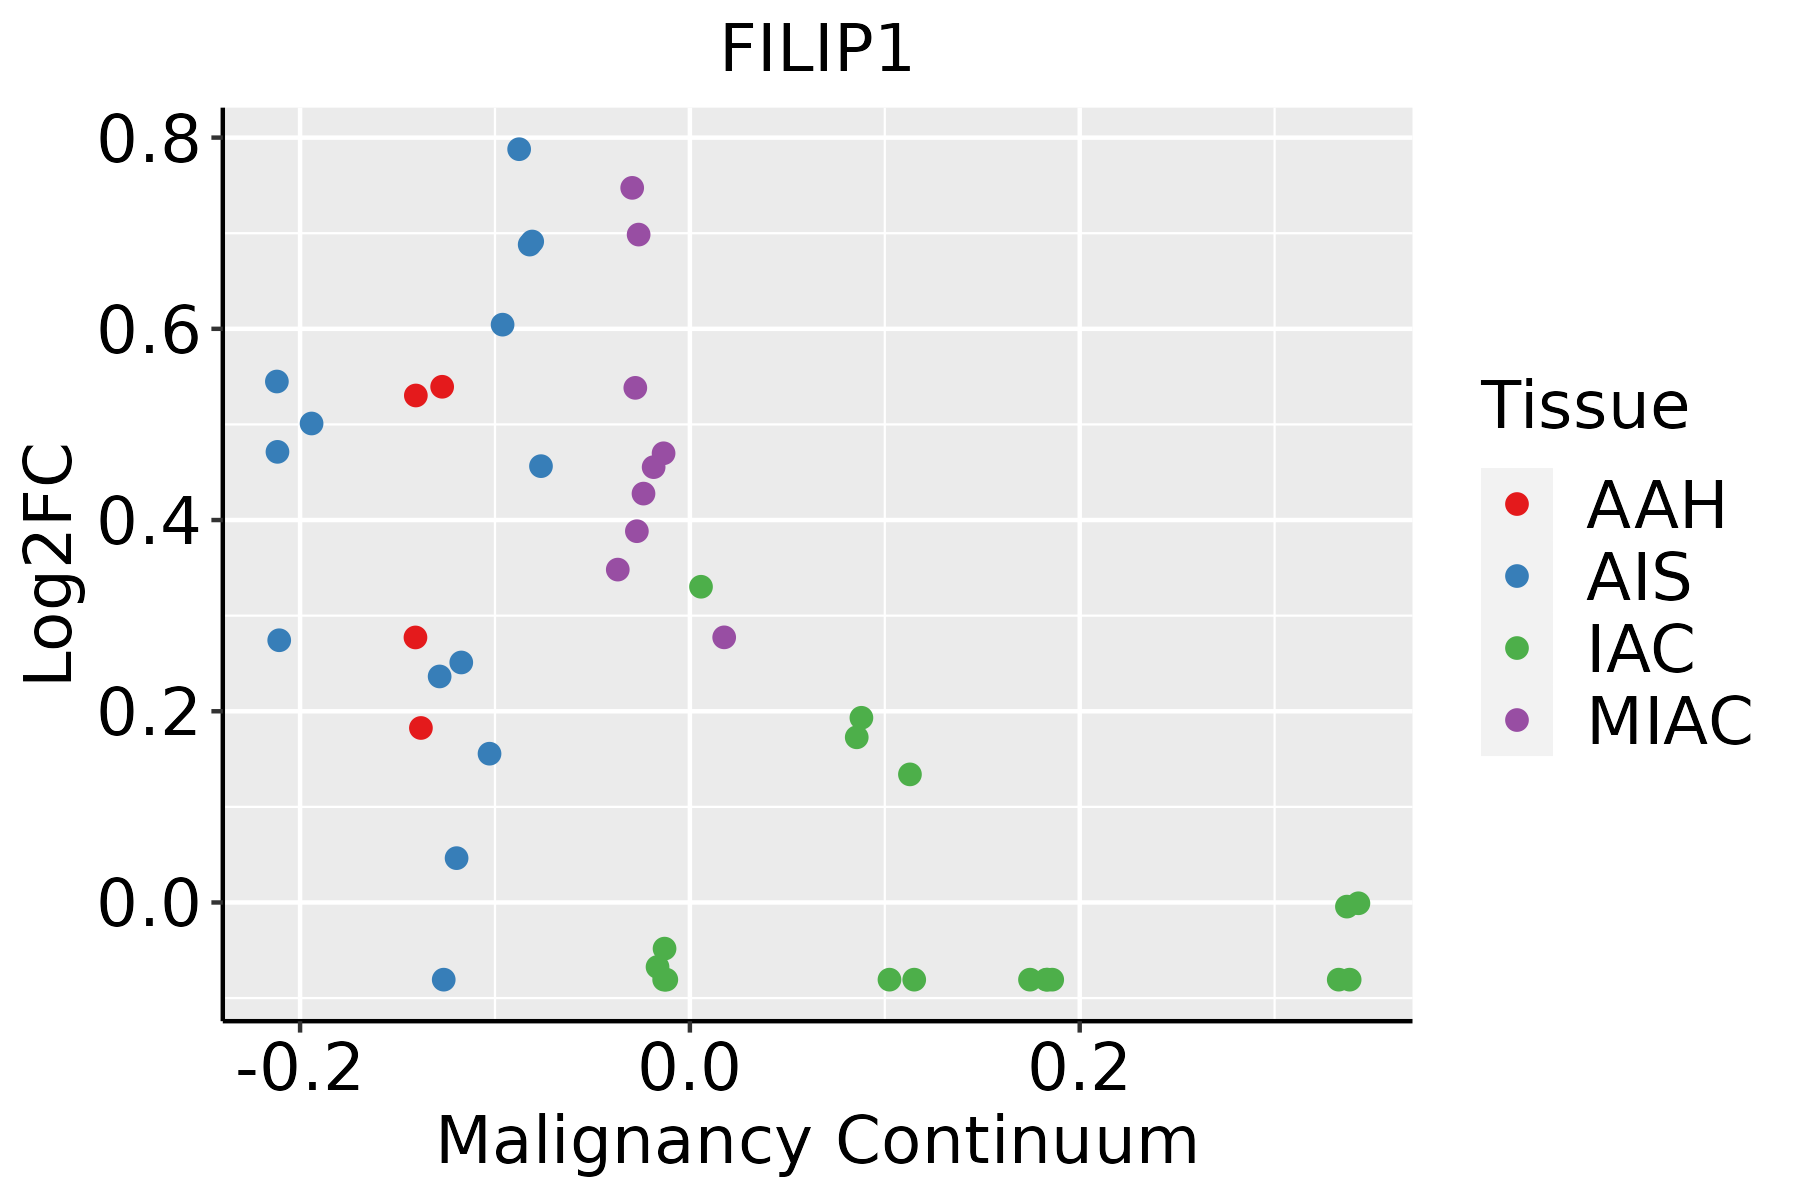 | AAH: Atypical adenomatous hyperplasia |
| AIS: Adenocarcinoma in situ | ||
| IAC: Invasive lung adenocarcinoma | ||
| MIA: Minimally invasive adenocarcinoma | ||
| Thyroid | 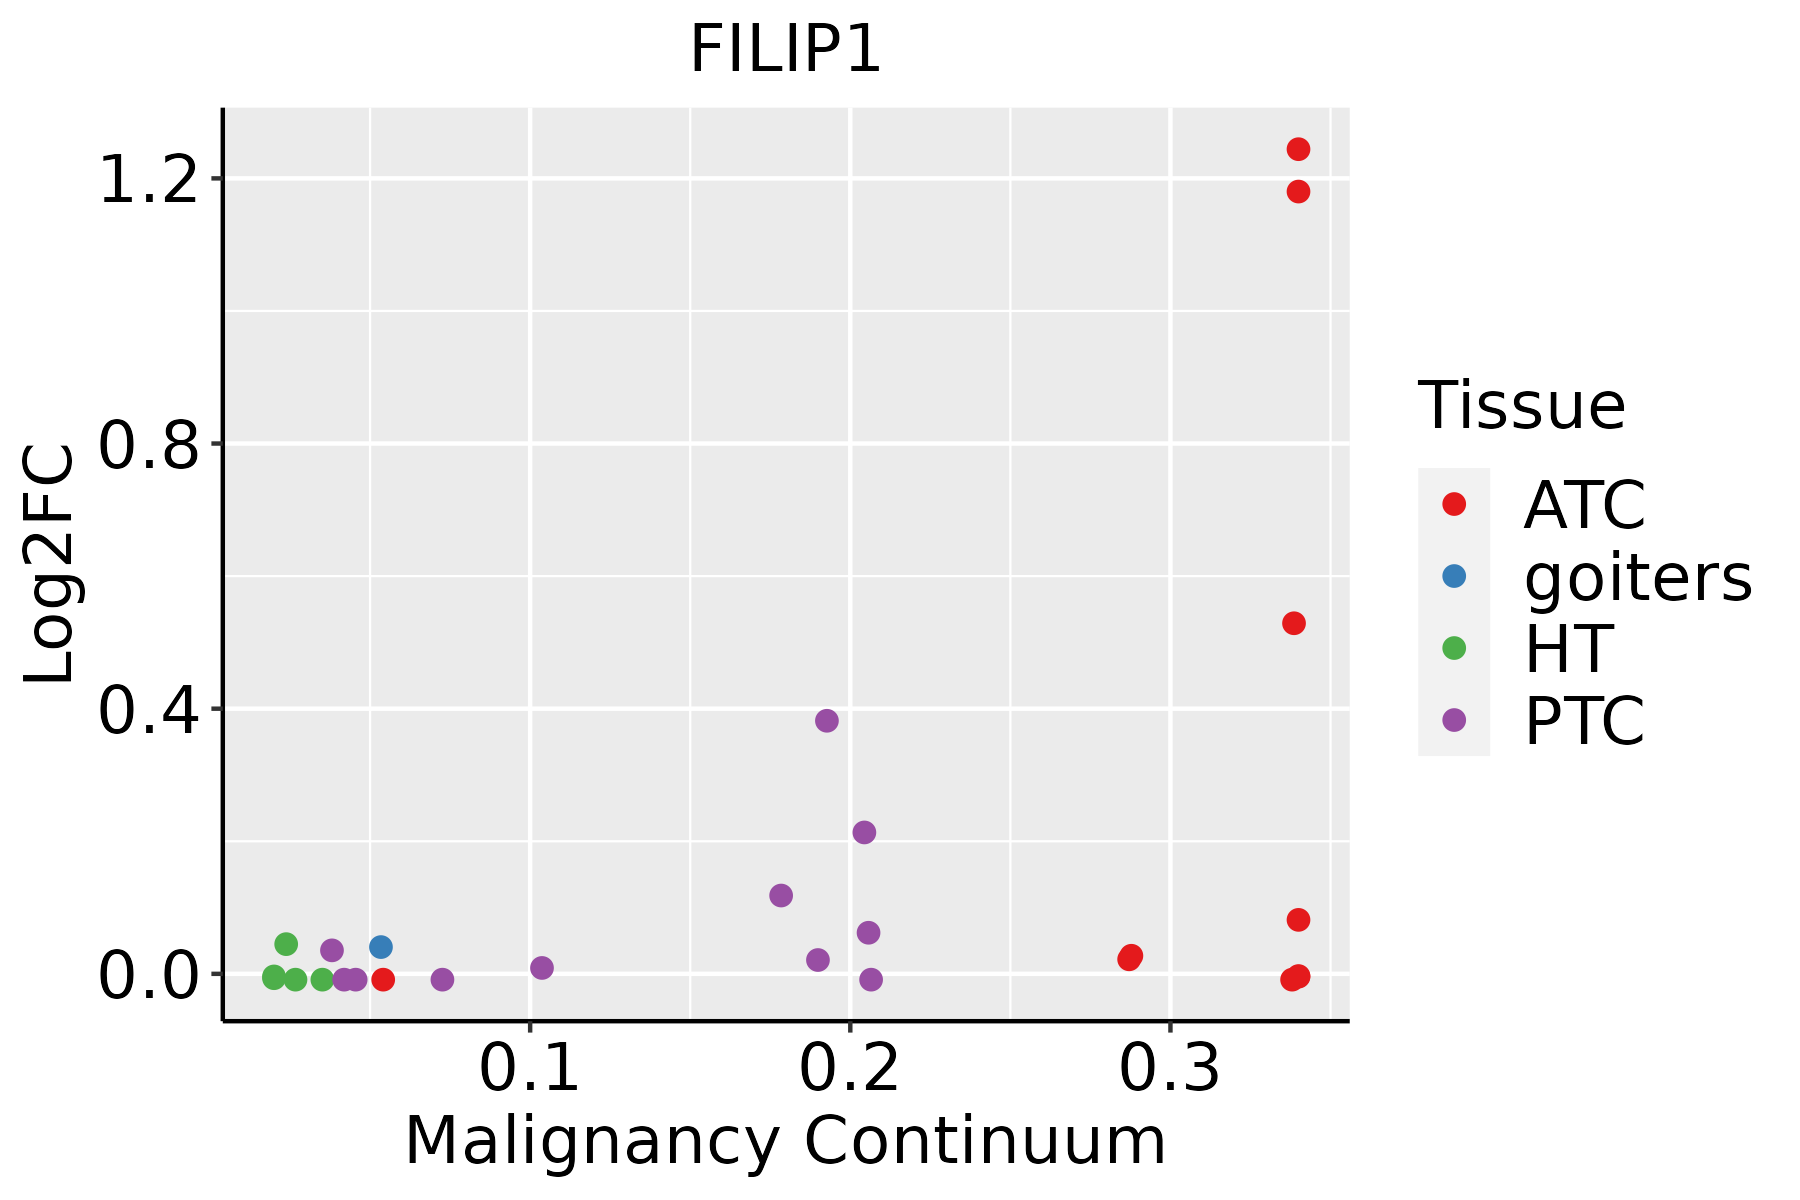 | ATC: Anaplastic thyroid cancer |
| HT: Hashimoto's thyroiditis | ||
| PTC: Papillary thyroid cancer |
| ∗log2FC in expression of this searched gene in stem-like cells from each diseased tissue sample relative to stem-like cells in normal samples in each tissue plotted against the malignancy continuum. Samples are colored based on if they are from different disease stage. |
Top |
Malignant transformation related pathway analysis |
| Find out the enriched GO biological processes and KEGG pathways involved in transition from healthy to precancer to cancer |
| Tissue | Disease Stage | Enriched GO biological Processes |
| Colorectum | AD |  |
| Colorectum | SER |  |
| Colorectum | MSS |  |
| Colorectum | MSI-H |  |
| Colorectum | FAP |  |
| ∗Top 15 enriched GO BP terms are showed in the bar plot of each disease state in each tissue. Each row represents a significant GO biological process which is colored according to the -log10(p.adjust). |
| Page: 1 2 3 4 5 6 7 8 9 |
| GO ID | Tissue | Disease Stage | Description | Gene Ratio | Bg Ratio | pvalue | p.adjust | Count |
| Page: 1 |
| Pathway ID | Tissue | Disease Stage | Description | Gene Ratio | Bg Ratio | pvalue | p.adjust | qvalue | Count |
| Page: 1 |
Top |
Cell-cell communication analysis |
| Identification of potential cell-cell interactions between two cell types and their ligand-receptor pairs for different disease states |
| Ligand | Receptor | LRpair | Pathway | Tissue | Disease Stage |
| Page: 1 |
Top |
Single-cell gene regulatory network inference analysis |
| Find out the significant the regulons (TFs) and the target genes of each regulon across cell types for different disease states |
| TF | Cell Type | Tissue | Disease Stage | Target Gene | RSS | Regulon Activity |
| ∗The dot plots of a searched regulon are shown for all cell subpopulations in each disease state of each tissue based on the regulon specific score inferred using pySCENIC and by calculating the average expression. |
| Page: 1 |
Top |
Somatic mutation of malignant transformation related genes |
| Annotation of somatic variants for genes involved in malignant transformation |
| Hugo Symbol | Variant Class | Variant Classification | dbSNP RS | HGVSc | HGVSp | HGVSp Short | SWISSPROT | BIOTYPE | SIFT | PolyPhen | Tumor Sample Barcode | Tissue | Histology | Sex | Age | Stage | Therapy Types | Drugs | Outcome |
| FILIP1 | SNV | Missense_Mutation | c.2208N>A | p.Asn736Lys | p.N736K | Q7Z7B0 | protein_coding | tolerated(0.48) | benign(0.067) | TCGA-A1-A0SO-01 | Breast | breast invasive carcinoma | Female | >=65 | I/II | Chemotherapy | SD | ||
| FILIP1 | SNV | Missense_Mutation | rs776455963 | c.2131C>T | p.Arg711Trp | p.R711W | Q7Z7B0 | protein_coding | deleterious(0) | probably_damaging(0.929) | TCGA-AN-A046-01 | Breast | breast invasive carcinoma | Female | >=65 | I/II | Unknown | Unknown | SD |
| FILIP1 | SNV | Missense_Mutation | rs147080592 | c.1151G>A | p.Arg384Gln | p.R384Q | Q7Z7B0 | protein_coding | deleterious(0.04) | possibly_damaging(0.738) | TCGA-AN-A046-01 | Breast | breast invasive carcinoma | Female | >=65 | I/II | Unknown | Unknown | SD |
| FILIP1 | SNV | Missense_Mutation | c.2128N>C | p.Phe710Leu | p.F710L | Q7Z7B0 | protein_coding | tolerated(1) | benign(0) | TCGA-B6-A0IJ-01 | Breast | breast invasive carcinoma | Female | <65 | I/II | Unknown | Unknown | SD | |
| FILIP1 | SNV | Missense_Mutation | c.1121N>G | p.Ser374Cys | p.S374C | Q7Z7B0 | protein_coding | deleterious(0.01) | benign(0.127) | TCGA-BH-A18P-01 | Breast | breast invasive carcinoma | Female | <65 | I/II | Unknown | Unknown | PD | |
| FILIP1 | SNV | Missense_Mutation | novel | c.374N>T | p.Arg125Leu | p.R125L | Q7Z7B0 | protein_coding | deleterious(0.01) | benign(0.355) | TCGA-E2-A2P5-01 | Breast | breast invasive carcinoma | Female | >=65 | III/IV | Hormone Therapy | arimidex | PD |
| FILIP1 | SNV | Missense_Mutation | novel | c.481N>T | p.Thr161Ser | p.T161S | Q7Z7B0 | protein_coding | tolerated(0.27) | possibly_damaging(0.617) | TCGA-E2-A56Z-01 | Breast | breast invasive carcinoma | Female | >=65 | I/II | Hormone Therapy | arimidex | SD |
| FILIP1 | SNV | Missense_Mutation | novel | c.1972N>A | p.Asp658Asn | p.D658N | Q7Z7B0 | protein_coding | deleterious(0) | probably_damaging(1) | TCGA-LD-A74U-01 | Breast | breast invasive carcinoma | Female | >=65 | III/IV | Chemotherapy | taxotere | SD |
| FILIP1 | SNV | Missense_Mutation | c.136N>A | p.Glu46Lys | p.E46K | Q7Z7B0 | protein_coding | tolerated(0.09) | benign(0.006) | TCGA-PE-A5DD-01 | Breast | breast invasive carcinoma | Female | <65 | I/II | Chemotherapy | CR | ||
| FILIP1 | insertion | Frame_Shift_Ins | novel | c.3086_3087insGTGGTTCTATGATAGAGGTATGTACAAAGGAGCCAAT | p.Met1030TrpfsTer49 | p.M1030Wfs*49 | Q7Z7B0 | protein_coding | TCGA-A8-A09C-01 | Breast | breast invasive carcinoma | Female | >=65 | I/II | Unknown | Unknown | SD |
| Page: 1 2 3 4 5 6 7 8 9 10 11 12 13 14 15 16 17 18 |
Top |
Related drugs of malignant transformation related genes |
| Identification of chemicals and drugs interact with genes involved in malignant transfromation |
| (DGIdb 4.0) |
| Entrez ID | Symbol | Category | Interaction Types | Drug Claim Name | Drug Name | PMIDs |
| Page: 1 |

Copyright 2023-Present -The University of Texas Health Science Center at Houston |