
|
|||||
|
 | |
| |
| |
| |
| |
| |
|
Gene: FIBP |
Gene summary for FIBP |
| Gene information | Species | Human | Gene symbol | FIBP | Gene ID | 9158 |
| Gene name | FGF1 intracellular binding protein | |
| Gene Alias | FGFIBP | |
| Cytomap | 11q13.1 | |
| Gene Type | protein-coding | GO ID | GO:0001775 | UniProtAcc | O43427 |
Top |
Malignant transformation analysis |
| Identification of the aberrant gene expression in precancerous and cancerous lesions by comparing the gene expression of stem-like cells in diseased tissues with normal stem cells |
| Entrez ID | Symbol | Replicates | Species | Organ | Tissue | Adj P-value | Log2FC | Malignancy |
| 9158 | FIBP | HTA11_3410_2000001011 | Human | Colorectum | AD | 3.62e-08 | 2.19e-01 | 0.0155 |
| 9158 | FIBP | HTA11_2487_2000001011 | Human | Colorectum | SER | 6.41e-13 | 4.23e-01 | -0.1808 |
| 9158 | FIBP | HTA11_2951_2000001011 | Human | Colorectum | AD | 2.61e-02 | 2.34e-01 | 0.0216 |
| 9158 | FIBP | HTA11_1938_2000001011 | Human | Colorectum | AD | 8.68e-10 | 3.54e-01 | -0.0811 |
| 9158 | FIBP | HTA11_78_2000001011 | Human | Colorectum | AD | 4.51e-06 | 1.95e-01 | -0.1088 |
| 9158 | FIBP | HTA11_347_2000001011 | Human | Colorectum | AD | 1.05e-08 | 2.10e-01 | -0.1954 |
| 9158 | FIBP | HTA11_411_2000001011 | Human | Colorectum | SER | 4.11e-08 | 6.14e-01 | -0.2602 |
| 9158 | FIBP | HTA11_2112_2000001011 | Human | Colorectum | SER | 1.04e-04 | 3.50e-01 | -0.2196 |
| 9158 | FIBP | HTA11_3361_2000001011 | Human | Colorectum | AD | 8.89e-09 | 3.32e-01 | -0.1207 |
| 9158 | FIBP | HTA11_696_2000001011 | Human | Colorectum | AD | 1.11e-13 | 3.98e-01 | -0.1464 |
| 9158 | FIBP | HTA11_866_2000001011 | Human | Colorectum | AD | 2.92e-06 | 2.23e-01 | -0.1001 |
| 9158 | FIBP | HTA11_1391_2000001011 | Human | Colorectum | AD | 3.99e-13 | 3.92e-01 | -0.059 |
| 9158 | FIBP | HTA11_2992_2000001011 | Human | Colorectum | SER | 1.75e-04 | 3.39e-01 | -0.1706 |
| 9158 | FIBP | HTA11_5212_2000001011 | Human | Colorectum | AD | 3.06e-02 | 2.20e-01 | -0.2061 |
| 9158 | FIBP | HTA11_5216_2000001011 | Human | Colorectum | SER | 2.45e-03 | 3.98e-01 | -0.1462 |
| 9158 | FIBP | HTA11_546_2000001011 | Human | Colorectum | AD | 1.23e-06 | 3.01e-01 | -0.0842 |
| 9158 | FIBP | HTA11_866_3004761011 | Human | Colorectum | AD | 2.36e-09 | 2.60e-01 | 0.096 |
| 9158 | FIBP | HTA11_4255_2000001011 | Human | Colorectum | SER | 2.74e-03 | 3.18e-01 | 0.0446 |
| 9158 | FIBP | HTA11_8622_2000001021 | Human | Colorectum | SER | 1.42e-04 | 3.29e-01 | 0.0528 |
| 9158 | FIBP | HTA11_7663_2000001011 | Human | Colorectum | SER | 7.19e-04 | 2.92e-01 | 0.0131 |
| Page: 1 2 3 4 5 6 7 8 |
| Tissue | Expression Dynamics | Abbreviation |
| Colorectum (GSE201348) |  | FAP: Familial adenomatous polyposis |
| CRC: Colorectal cancer | ||
| Colorectum (HTA11) |  | AD: Adenomas |
| SER: Sessile serrated lesions | ||
| MSI-H: Microsatellite-high colorectal cancer | ||
| MSS: Microsatellite stable colorectal cancer | ||
| Esophagus | 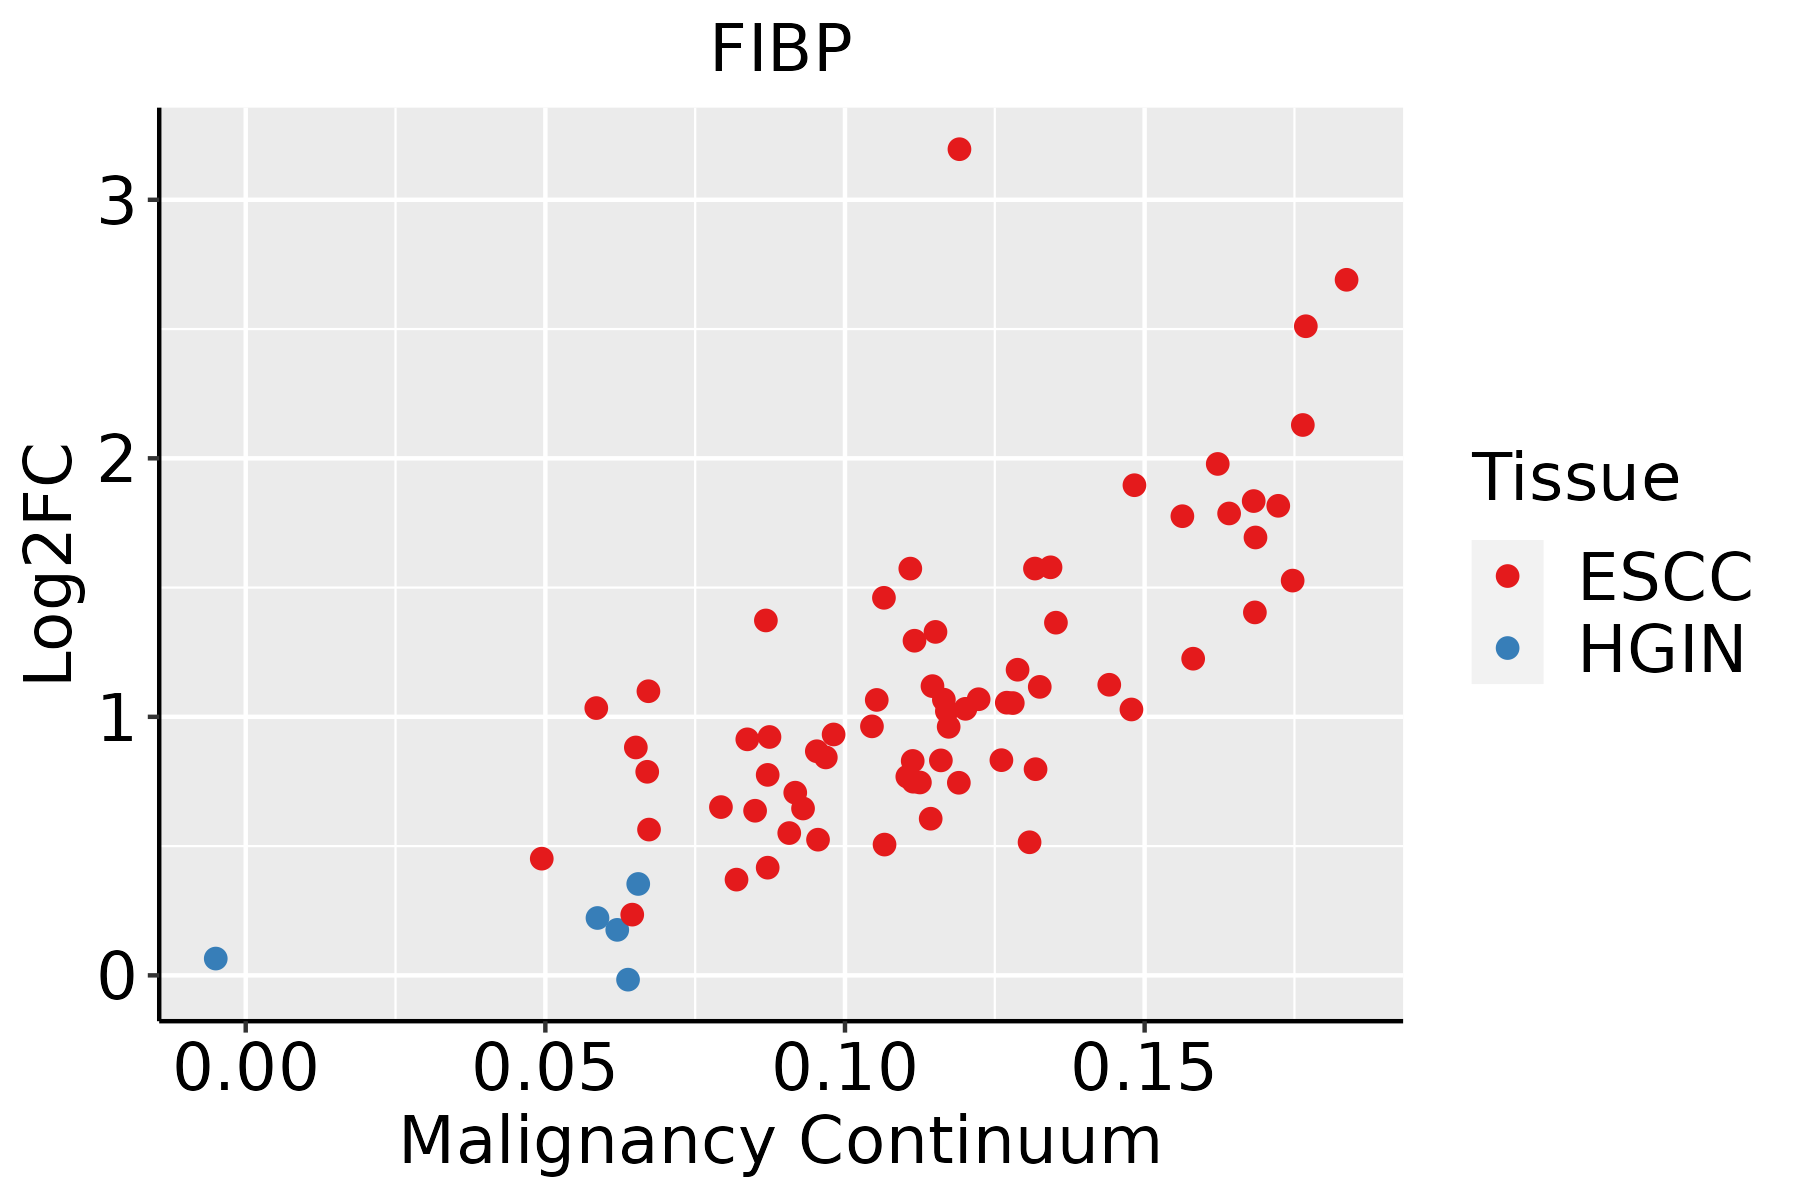 | ESCC: Esophageal squamous cell carcinoma |
| HGIN: High-grade intraepithelial neoplasias | ||
| LGIN: Low-grade intraepithelial neoplasias | ||
| Liver | 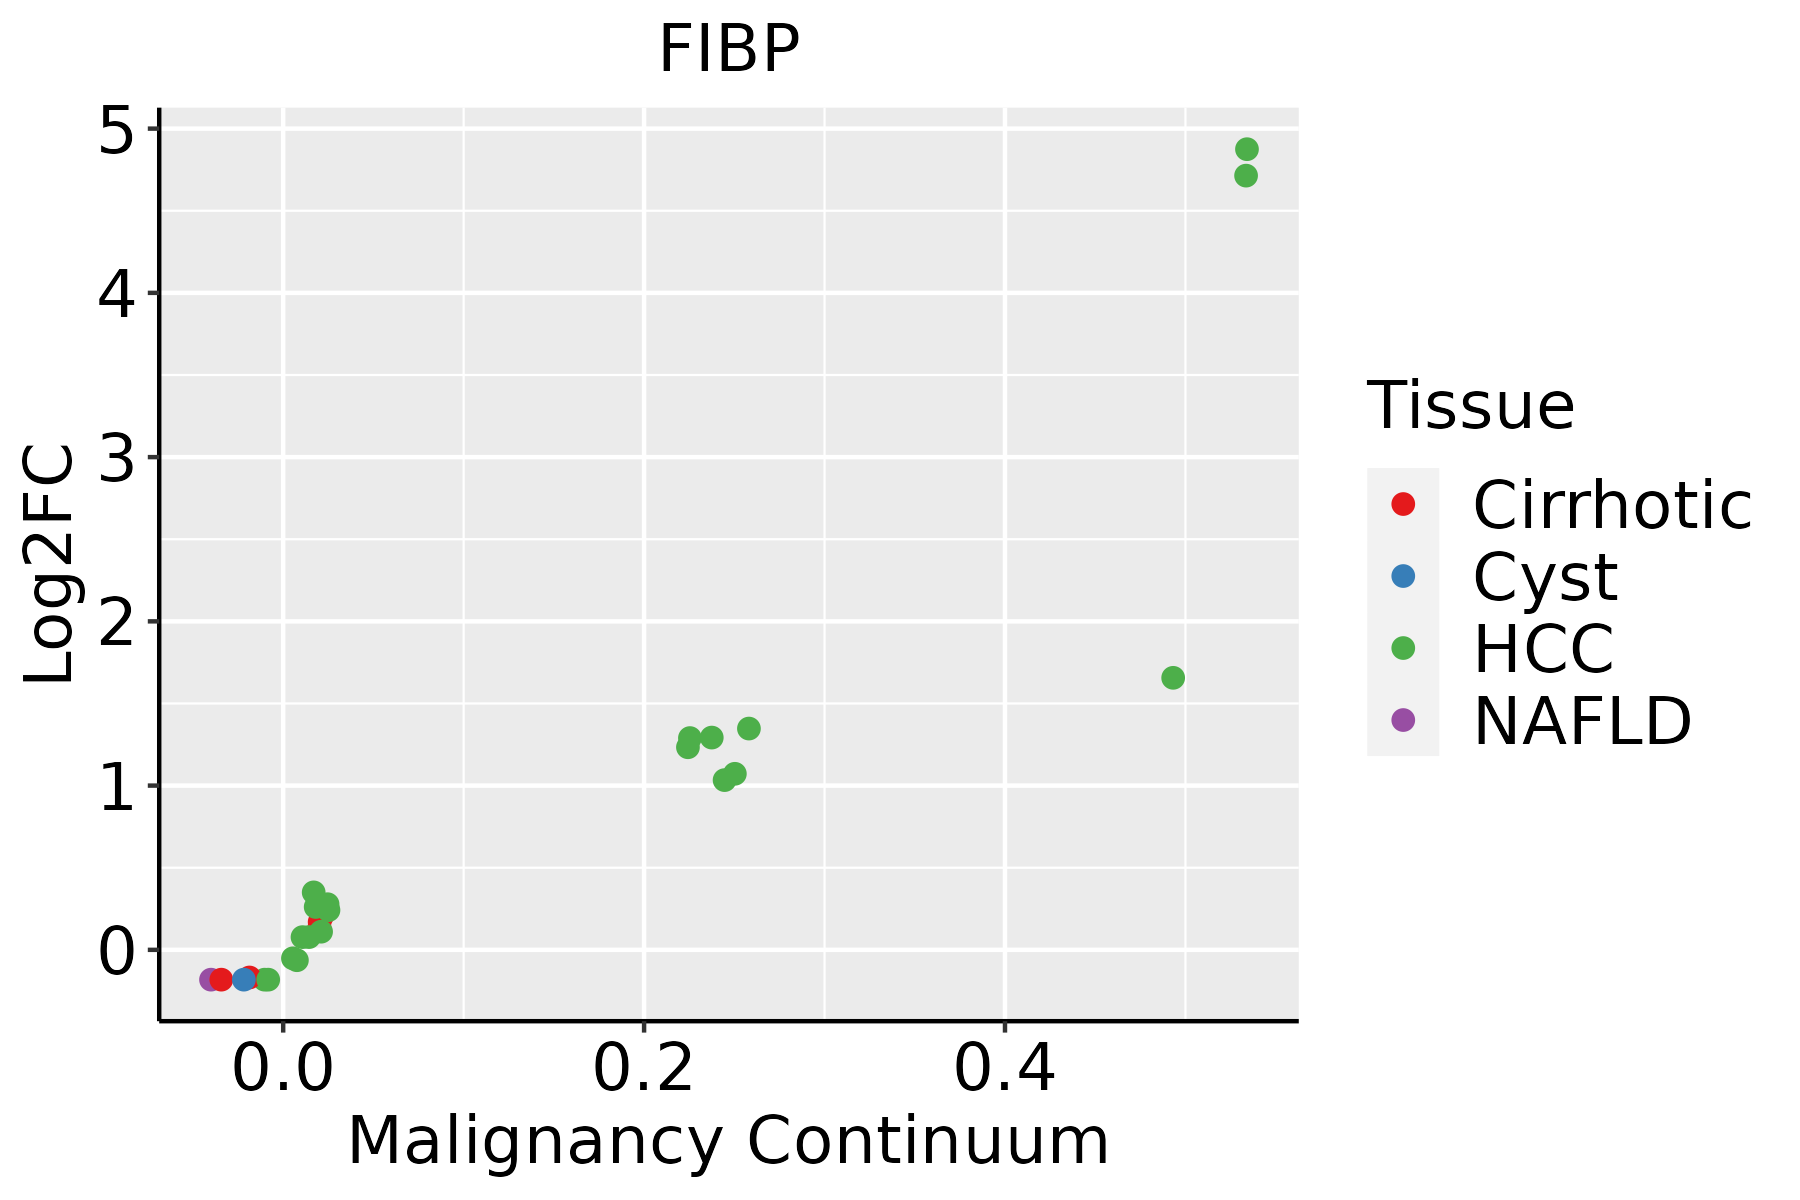 | HCC: Hepatocellular carcinoma |
| NAFLD: Non-alcoholic fatty liver disease | ||
| Oral Cavity | 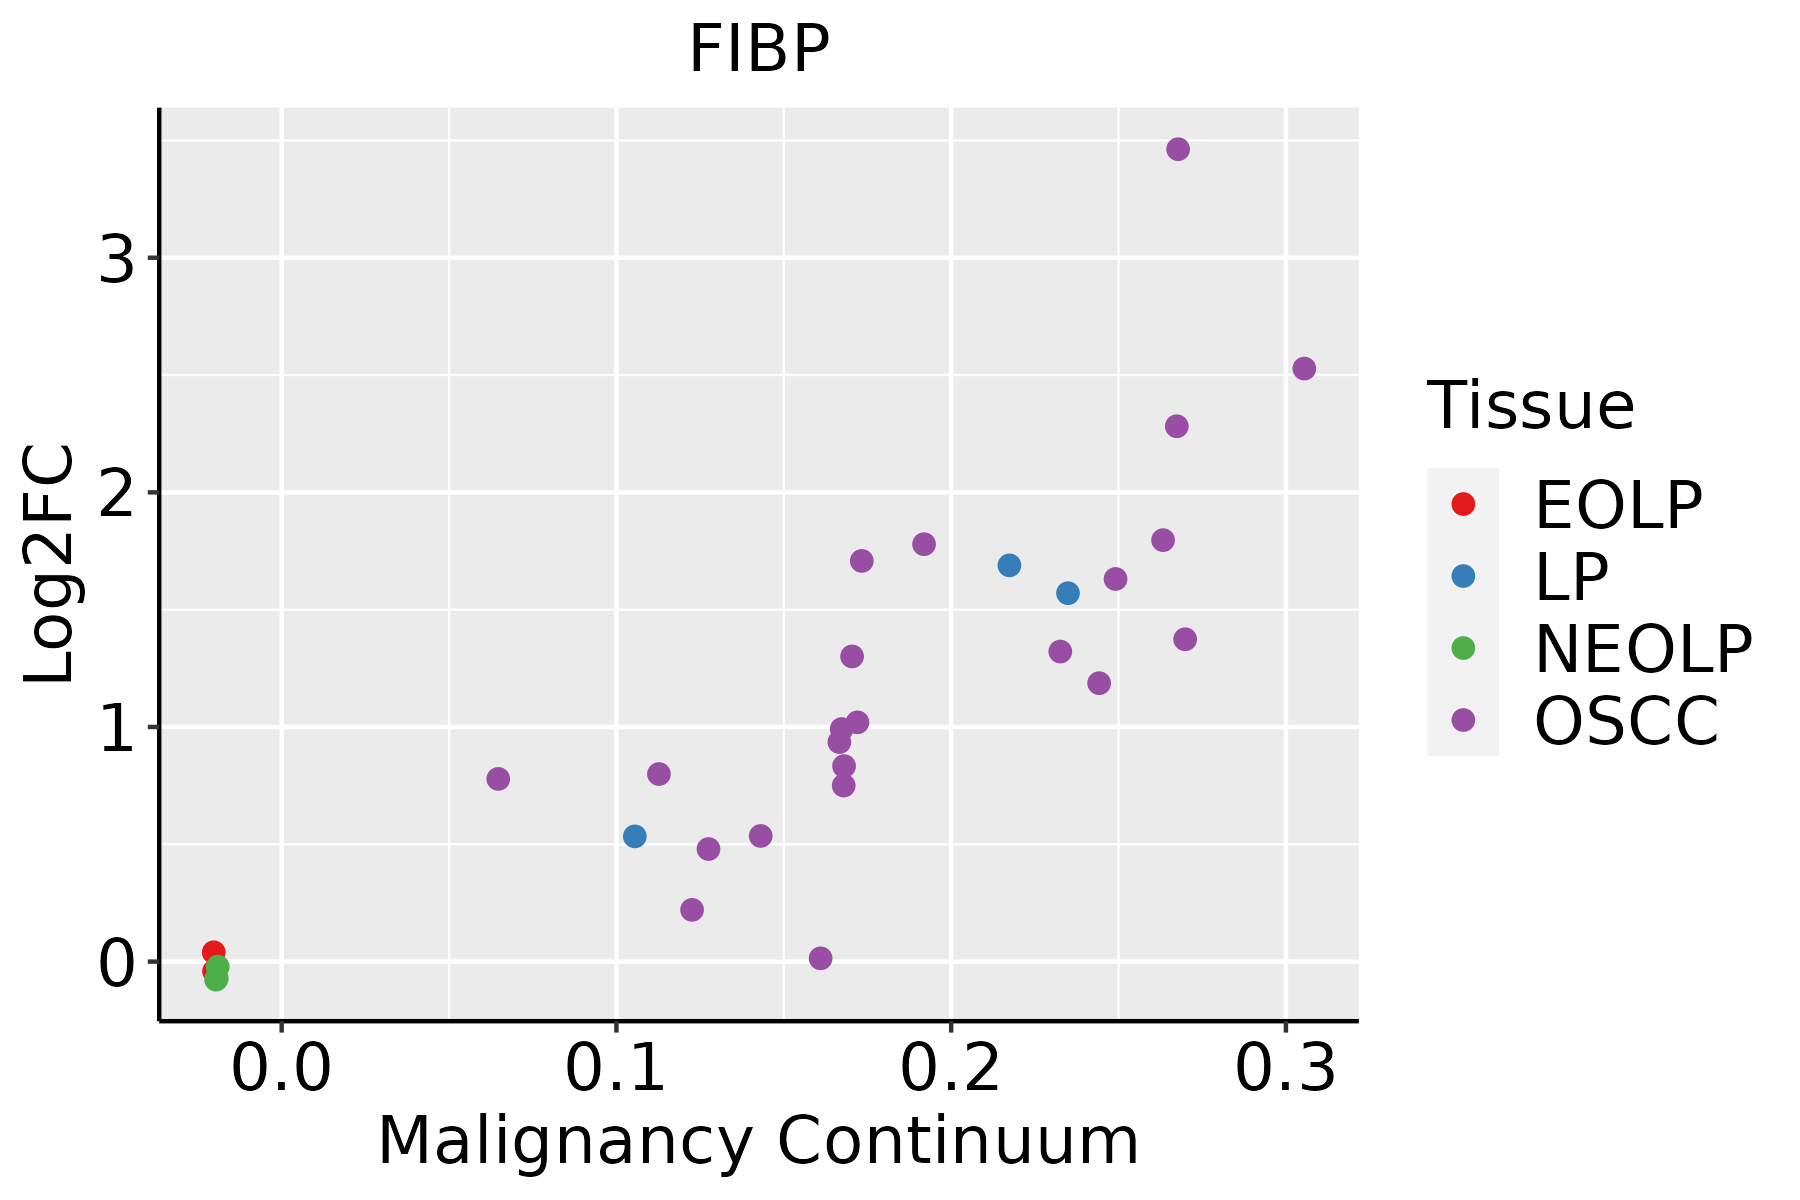 | EOLP: Erosive Oral lichen planus |
| LP: leukoplakia | ||
| NEOLP: Non-erosive oral lichen planus | ||
| OSCC: Oral squamous cell carcinoma | ||
| Skin | 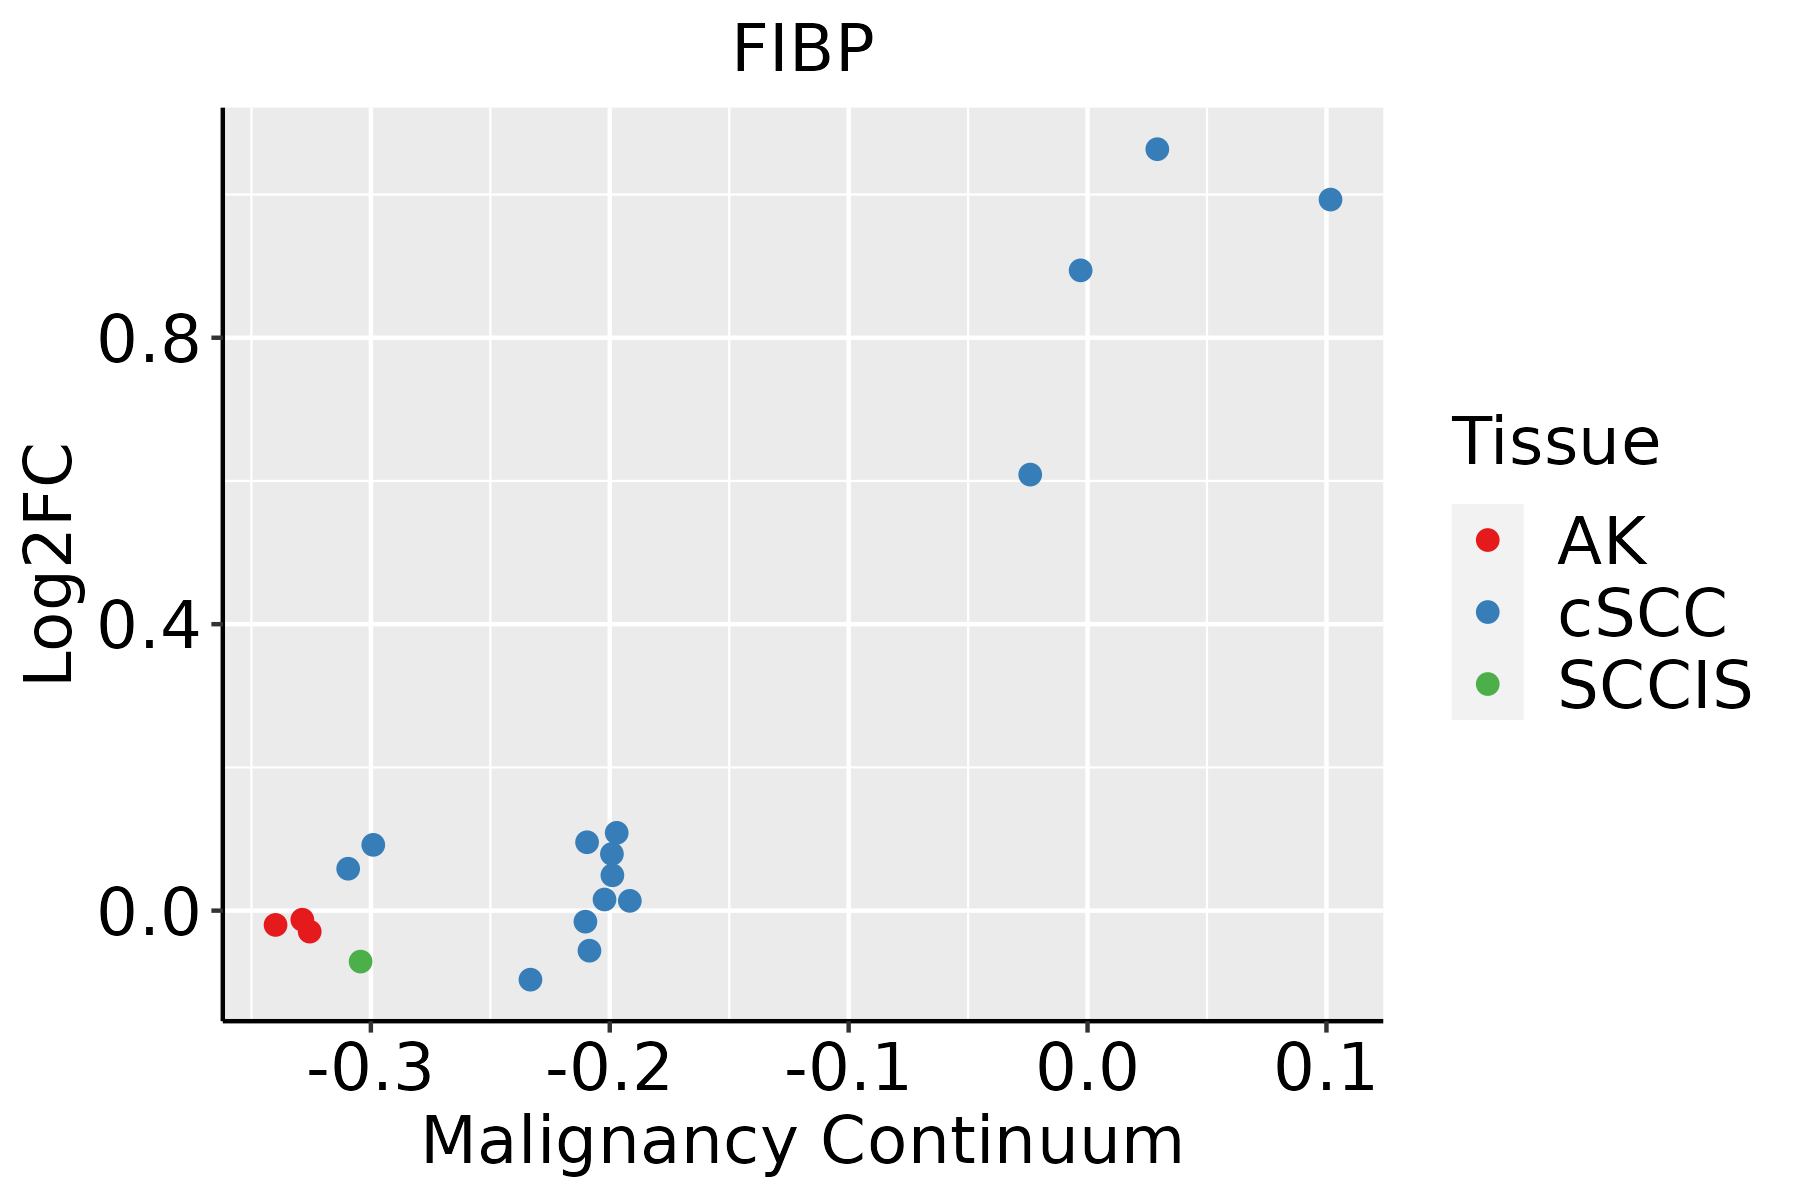 | AK: Actinic keratosis |
| cSCC: Cutaneous squamous cell carcinoma | ||
| SCCIS:squamous cell carcinoma in situ | ||
| Thyroid |  | ATC: Anaplastic thyroid cancer |
| HT: Hashimoto's thyroiditis | ||
| PTC: Papillary thyroid cancer |
| ∗log2FC in expression of this searched gene in stem-like cells from each diseased tissue sample relative to stem-like cells in normal samples in each tissue plotted against the malignancy continuum. Samples are colored based on if they are from different disease stage. |
Top |
Malignant transformation related pathway analysis |
| Find out the enriched GO biological processes and KEGG pathways involved in transition from healthy to precancer to cancer |
| Tissue | Disease Stage | Enriched GO biological Processes |
| Colorectum | AD |  |
| Colorectum | SER |  |
| Colorectum | MSS |  |
| Colorectum | MSI-H |  |
| Colorectum | FAP |  |
| ∗Top 15 enriched GO BP terms are showed in the bar plot of each disease state in each tissue. Each row represents a significant GO biological process which is colored according to the -log10(p.adjust). |
| Page: 1 2 3 4 5 6 7 8 9 |
| GO ID | Tissue | Disease Stage | Description | Gene Ratio | Bg Ratio | pvalue | p.adjust | Count |
| GO:0034109 | Colorectum | AD | homotypic cell-cell adhesion | 40/3918 | 90/18723 | 4.37e-07 | 1.67e-05 | 40 |
| GO:0042060 | Colorectum | AD | wound healing | 128/3918 | 422/18723 | 2.73e-06 | 7.89e-05 | 128 |
| GO:0050878 | Colorectum | AD | regulation of body fluid levels | 108/3918 | 379/18723 | 2.54e-04 | 3.20e-03 | 108 |
| GO:0070527 | Colorectum | AD | platelet aggregation | 26/3918 | 67/18723 | 6.20e-04 | 6.48e-03 | 26 |
| GO:00341091 | Colorectum | SER | homotypic cell-cell adhesion | 32/2897 | 90/18723 | 2.23e-06 | 9.31e-05 | 32 |
| GO:00420601 | Colorectum | SER | wound healing | 97/2897 | 422/18723 | 2.69e-05 | 7.30e-04 | 97 |
| GO:00508781 | Colorectum | SER | regulation of body fluid levels | 81/2897 | 379/18723 | 1.28e-03 | 1.43e-02 | 81 |
| GO:00705271 | Colorectum | SER | platelet aggregation | 19/2897 | 67/18723 | 5.14e-03 | 3.93e-02 | 19 |
| GO:00420602 | Colorectum | MSS | wound healing | 119/3467 | 422/18723 | 5.93e-07 | 2.24e-05 | 119 |
| GO:00341092 | Colorectum | MSS | homotypic cell-cell adhesion | 36/3467 | 90/18723 | 1.62e-06 | 5.32e-05 | 36 |
| GO:00508782 | Colorectum | MSS | regulation of body fluid levels | 99/3467 | 379/18723 | 1.40e-04 | 2.07e-03 | 99 |
| GO:00705272 | Colorectum | MSS | platelet aggregation | 23/3467 | 67/18723 | 1.51e-03 | 1.39e-02 | 23 |
| GO:00508086 | Endometrium | AEH | synapse organization | 67/2100 | 426/18723 | 2.67e-03 | 1.94e-02 | 67 |
| GO:005080812 | Endometrium | EEC | synapse organization | 68/2168 | 426/18723 | 3.73e-03 | 2.49e-02 | 68 |
| GO:004206027 | Esophagus | ESCC | wound healing | 243/8552 | 422/18723 | 4.62e-07 | 6.25e-06 | 243 |
| GO:003410920 | Esophagus | ESCC | homotypic cell-cell adhesion | 54/8552 | 90/18723 | 4.33e-03 | 1.72e-02 | 54 |
| GO:004206012 | Liver | Cirrhotic | wound healing | 155/4634 | 422/18723 | 2.12e-08 | 7.56e-07 | 155 |
| GO:000759611 | Liver | Cirrhotic | blood coagulation | 79/4634 | 217/18723 | 8.06e-05 | 8.81e-04 | 79 |
| GO:00341097 | Liver | Cirrhotic | homotypic cell-cell adhesion | 39/4634 | 90/18723 | 8.57e-05 | 9.25e-04 | 39 |
| GO:000759911 | Liver | Cirrhotic | hemostasis | 80/4634 | 222/18723 | 1.08e-04 | 1.10e-03 | 80 |
| Page: 1 2 3 |
| Pathway ID | Tissue | Disease Stage | Description | Gene Ratio | Bg Ratio | pvalue | p.adjust | qvalue | Count |
| Page: 1 |
Top |
Cell-cell communication analysis |
| Identification of potential cell-cell interactions between two cell types and their ligand-receptor pairs for different disease states |
| Ligand | Receptor | LRpair | Pathway | Tissue | Disease Stage |
| Page: 1 |
Top |
Single-cell gene regulatory network inference analysis |
| Find out the significant the regulons (TFs) and the target genes of each regulon across cell types for different disease states |
| TF | Cell Type | Tissue | Disease Stage | Target Gene | RSS | Regulon Activity |
| ∗The dot plots of a searched regulon are shown for all cell subpopulations in each disease state of each tissue based on the regulon specific score inferred using pySCENIC and by calculating the average expression. |
| Page: 1 |
Top |
Somatic mutation of malignant transformation related genes |
| Annotation of somatic variants for genes involved in malignant transformation |
| Hugo Symbol | Variant Class | Variant Classification | dbSNP RS | HGVSc | HGVSp | HGVSp Short | SWISSPROT | BIOTYPE | SIFT | PolyPhen | Tumor Sample Barcode | Tissue | Histology | Sex | Age | Stage | Therapy Types | Drugs | Outcome |
| FIBP | SNV | Missense_Mutation | novel | c.313N>T | p.Arg105Trp | p.R105W | O43427 | protein_coding | deleterious(0) | probably_damaging(0.999) | TCGA-AN-A046-01 | Breast | breast invasive carcinoma | Female | >=65 | I/II | Unknown | Unknown | SD |
| FIBP | SNV | Missense_Mutation | novel | c.61N>T | p.Arg21Cys | p.R21C | O43427 | protein_coding | deleterious(0) | possibly_damaging(0.761) | TCGA-S3-AA15-01 | Breast | breast invasive carcinoma | Female | <65 | I/II | Chemotherapy | adriamycin | CR |
| FIBP | insertion | Nonsense_Mutation | novel | c.298_299insTGGGTTAGCACAGAGACACCAAGAGAGGAAAAGAAGCCAA | p.Asp100ValfsTer3 | p.D100Vfs*3 | O43427 | protein_coding | TCGA-AN-A0FX-01 | Breast | breast invasive carcinoma | Female | <65 | I/II | Unknown | Unknown | SD | ||
| FIBP | SNV | Missense_Mutation | c.469G>A | p.Asp157Asn | p.D157N | O43427 | protein_coding | tolerated(0.51) | benign(0) | TCGA-EK-A2RA-01 | Cervix | cervical & endocervical cancer | Female | >=65 | I/II | Unknown | Unknown | SD | |
| FIBP | SNV | Missense_Mutation | novel | c.724A>C | p.Lys242Gln | p.K242Q | O43427 | protein_coding | deleterious(0.02) | possibly_damaging(0.686) | TCGA-AA-3949-01 | Colorectum | colon adenocarcinoma | Female | >=65 | III/IV | Unknown | Unknown | SD |
| FIBP | SNV | Missense_Mutation | c.101N>T | p.Ala34Val | p.A34V | O43427 | protein_coding | tolerated(0.33) | benign(0.003) | TCGA-AD-5900-01 | Colorectum | colon adenocarcinoma | Male | >=65 | I/II | Unknown | Unknown | SD | |
| FIBP | SNV | Missense_Mutation | c.113G>A | p.Arg38His | p.R38H | O43427 | protein_coding | tolerated(0.15) | benign(0.001) | TCGA-CK-4951-01 | Colorectum | colon adenocarcinoma | Female | >=65 | I/II | Unknown | Unknown | PD | |
| FIBP | SNV | Missense_Mutation | c.328N>G | p.Lys110Glu | p.K110E | O43427 | protein_coding | deleterious(0.01) | probably_damaging(0.966) | TCGA-D5-6928-01 | Colorectum | colon adenocarcinoma | Male | >=65 | I/II | Unknown | Unknown | SD | |
| FIBP | SNV | Missense_Mutation | c.595T>A | p.Phe199Ile | p.F199I | O43427 | protein_coding | deleterious(0.04) | benign(0.094) | TCGA-AF-A56N-01 | Colorectum | rectum adenocarcinoma | Female | <65 | I/II | Chemotherapy | xeloda | CR | |
| FIBP | deletion | Frame_Shift_Del | c.570delA | p.Lys190AsnfsTer5 | p.K190Nfs*5 | O43427 | protein_coding | TCGA-AA-3947-01 | Colorectum | colon adenocarcinoma | Female | <65 | I/II | Unknown | Unknown | SD |
| Page: 1 2 3 4 |
Top |
Related drugs of malignant transformation related genes |
| Identification of chemicals and drugs interact with genes involved in malignant transfromation |
| (DGIdb 4.0) |
| Entrez ID | Symbol | Category | Interaction Types | Drug Claim Name | Drug Name | PMIDs |
| Page: 1 |

Copyright 2023-Present -The University of Texas Health Science Center at Houston |