
|
|||||
|
 | |
| |
| |
| |
| |
| |
|
Gene: FIBIN |
Gene summary for FIBIN |
| Gene information | Species | Human | Gene symbol | FIBIN | Gene ID | 387758 |
| Gene name | fin bud initiation factor homolog | |
| Gene Alias | FIBIN | |
| Cytomap | 11p14.2 | |
| Gene Type | protein-coding | GO ID | GO:0007154 | UniProtAcc | Q8TAL6 |
Top |
Malignant transformation analysis |
| Identification of the aberrant gene expression in precancerous and cancerous lesions by comparing the gene expression of stem-like cells in diseased tissues with normal stem cells |
| Entrez ID | Symbol | Replicates | Species | Organ | Tissue | Adj P-value | Log2FC | Malignancy |
| 387758 | FIBIN | P9T-E | Human | Esophagus | ESCC | 1.77e-03 | 3.15e-01 | 0.1131 |
| 387758 | FIBIN | P19T-E | Human | Esophagus | ESCC | 9.01e-03 | 4.50e-01 | 0.1662 |
| 387758 | FIBIN | P37T-E | Human | Esophagus | ESCC | 9.03e-05 | 2.34e-01 | 0.1371 |
| 387758 | FIBIN | P44T-E | Human | Esophagus | ESCC | 2.45e-07 | 5.67e-01 | 0.1096 |
| 387758 | FIBIN | P79T-E | Human | Esophagus | ESCC | 1.66e-25 | 9.44e-01 | 0.1154 |
| 387758 | FIBIN | ATC12 | Human | Thyroid | ATC | 8.74e-10 | 2.87e-01 | 0.34 |
| 387758 | FIBIN | ATC13 | Human | Thyroid | ATC | 3.59e-57 | 1.74e+00 | 0.34 |
| 387758 | FIBIN | ATC3 | Human | Thyroid | ATC | 1.08e-02 | 2.41e-01 | 0.338 |
| 387758 | FIBIN | ATC4 | Human | Thyroid | ATC | 1.21e-13 | 4.06e-01 | 0.34 |
| 387758 | FIBIN | ATC5 | Human | Thyroid | ATC | 1.15e-65 | 1.81e+00 | 0.34 |
| Page: 1 |
| Tissue | Expression Dynamics | Abbreviation |
| Esophagus | 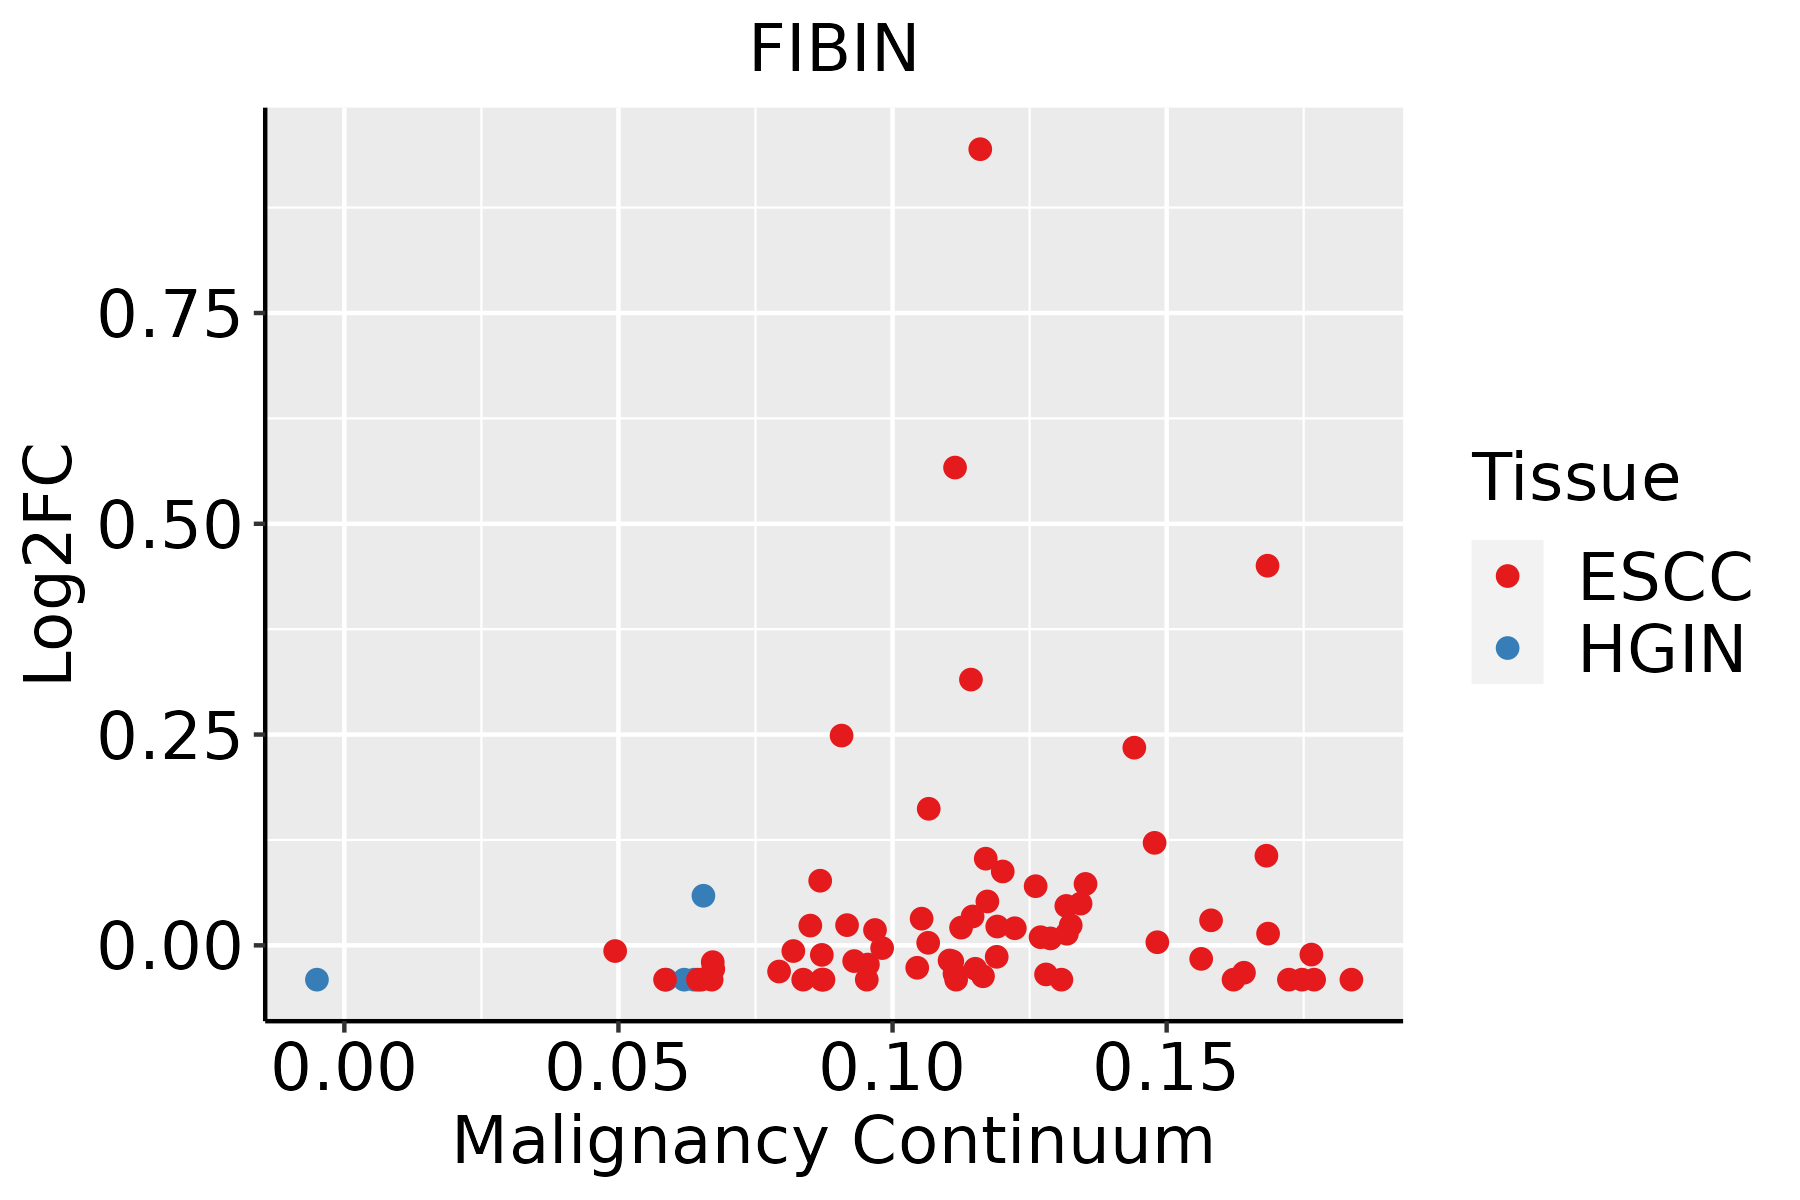 | ESCC: Esophageal squamous cell carcinoma |
| HGIN: High-grade intraepithelial neoplasias | ||
| LGIN: Low-grade intraepithelial neoplasias | ||
| Thyroid | 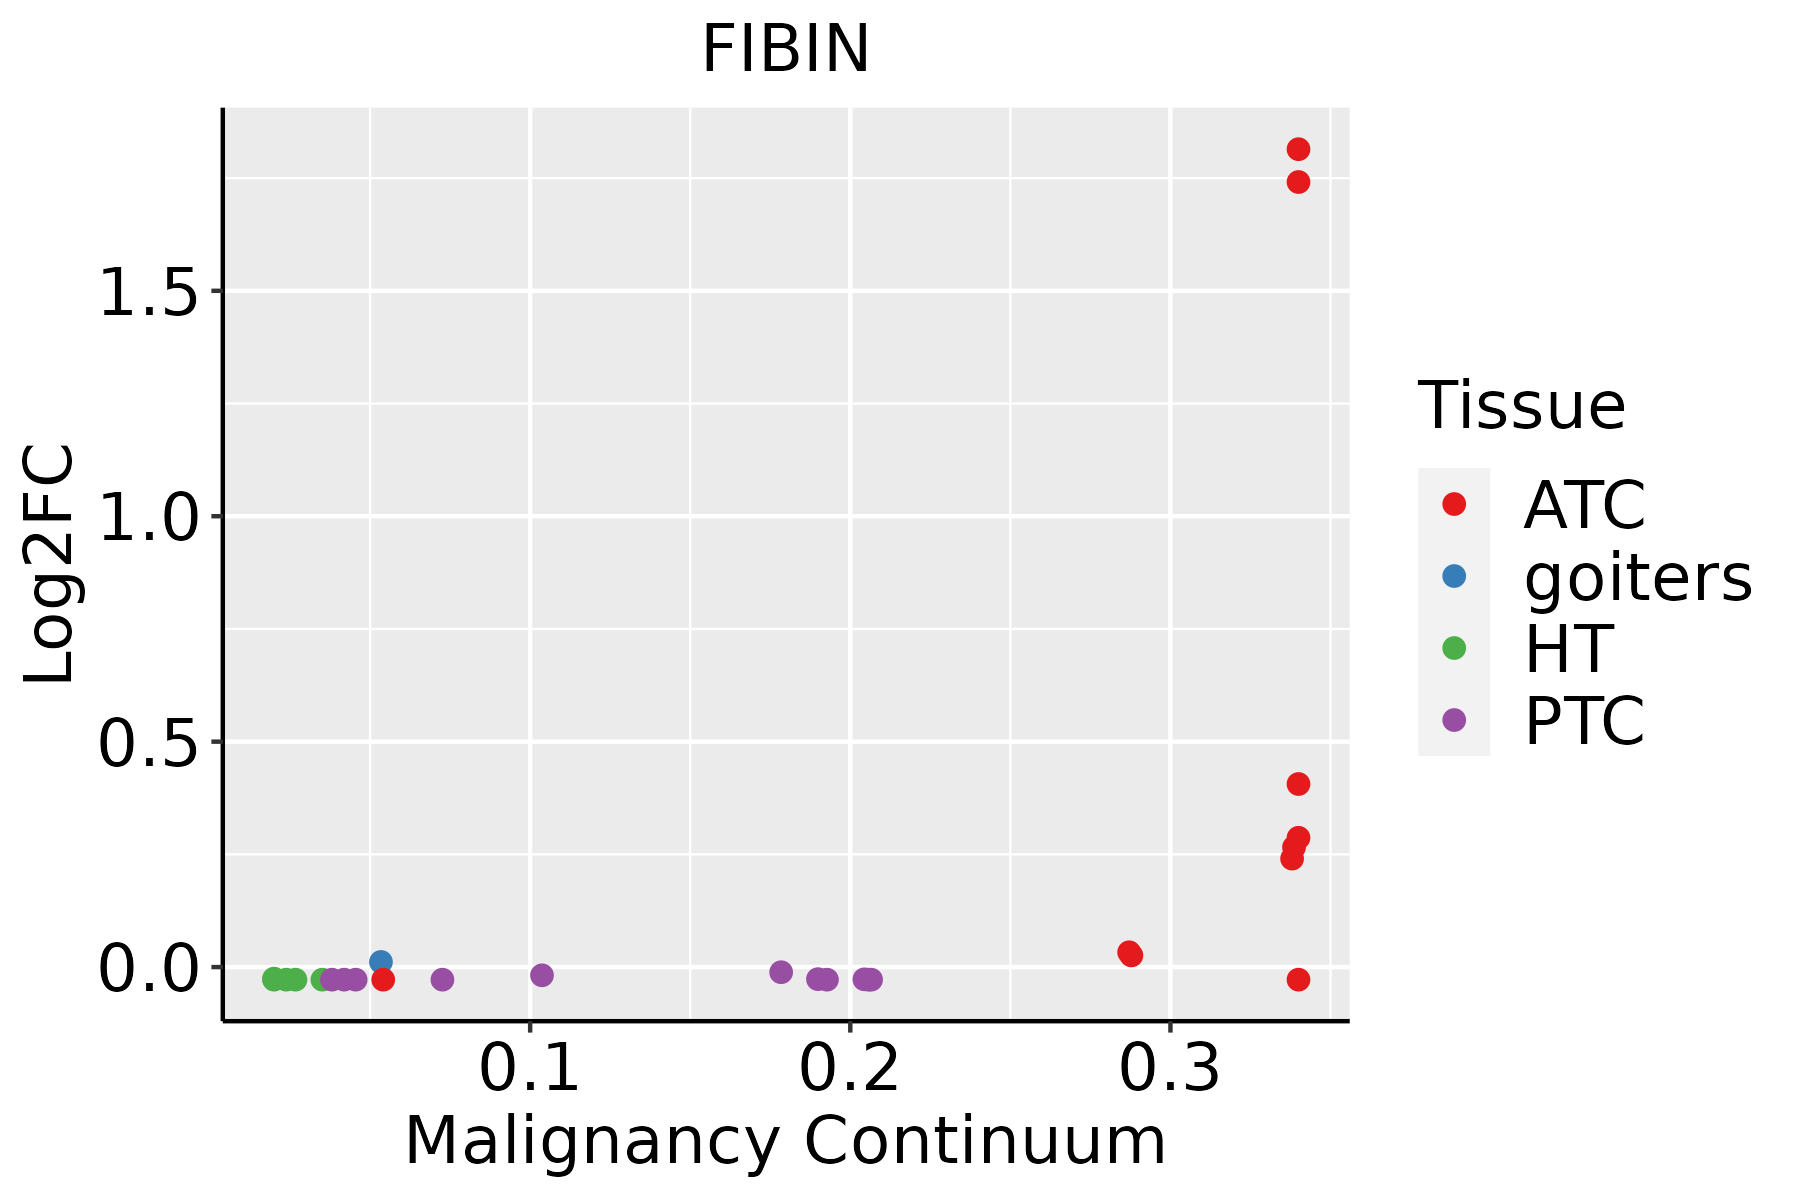 | ATC: Anaplastic thyroid cancer |
| HT: Hashimoto's thyroiditis | ||
| PTC: Papillary thyroid cancer |
| ∗log2FC in expression of this searched gene in stem-like cells from each diseased tissue sample relative to stem-like cells in normal samples in each tissue plotted against the malignancy continuum. Samples are colored based on if they are from different disease stage. |
Top |
Malignant transformation related pathway analysis |
| Find out the enriched GO biological processes and KEGG pathways involved in transition from healthy to precancer to cancer |
| Tissue | Disease Stage | Enriched GO biological Processes |
| Colorectum | AD |  |
| Colorectum | SER |  |
| Colorectum | MSS |  |
| Colorectum | MSI-H |  |
| Colorectum | FAP |  |
| ∗Top 15 enriched GO BP terms are showed in the bar plot of each disease state in each tissue. Each row represents a significant GO biological process which is colored according to the -log10(p.adjust). |
| Page: 1 2 3 4 5 6 7 8 9 |
| GO ID | Tissue | Disease Stage | Description | Gene Ratio | Bg Ratio | pvalue | p.adjust | Count |
| GO:0048545111 | Esophagus | ESCC | response to steroid hormone | 204/8552 | 339/18723 | 4.47e-08 | 8.11e-07 | 204 |
| GO:1901654111 | Esophagus | ESCC | response to ketone | 118/8552 | 194/18723 | 1.45e-05 | 1.31e-04 | 118 |
| GO:001003827 | Esophagus | ESCC | response to metal ion | 208/8552 | 373/18723 | 5.02e-05 | 3.90e-04 | 208 |
| GO:003196020 | Esophagus | ESCC | response to corticosteroid | 95/8552 | 167/18723 | 2.27e-03 | 9.99e-03 | 95 |
| GO:005138420 | Esophagus | ESCC | response to glucocorticoid | 85/8552 | 148/18723 | 2.60e-03 | 1.11e-02 | 85 |
| GO:00715487 | Esophagus | ESCC | response to dexamethasone | 26/8552 | 39/18723 | 6.63e-03 | 2.43e-02 | 26 |
| GO:0048545210 | Thyroid | ATC | response to steroid hormone | 168/6293 | 339/18723 | 7.21e-10 | 1.88e-08 | 168 |
| GO:190165427 | Thyroid | ATC | response to ketone | 105/6293 | 194/18723 | 2.96e-09 | 6.96e-08 | 105 |
| GO:0010038210 | Thyroid | ATC | response to metal ion | 165/6293 | 373/18723 | 1.07e-05 | 1.05e-04 | 165 |
| GO:005138427 | Thyroid | ATC | response to glucocorticoid | 65/6293 | 148/18723 | 5.62e-03 | 2.28e-02 | 65 |
| GO:003196027 | Thyroid | ATC | response to corticosteroid | 72/6293 | 167/18723 | 6.39e-03 | 2.55e-02 | 72 |
| Page: 1 |
| Pathway ID | Tissue | Disease Stage | Description | Gene Ratio | Bg Ratio | pvalue | p.adjust | qvalue | Count |
| Page: 1 |
Top |
Cell-cell communication analysis |
| Identification of potential cell-cell interactions between two cell types and their ligand-receptor pairs for different disease states |
| Ligand | Receptor | LRpair | Pathway | Tissue | Disease Stage |
| Page: 1 |
Top |
Single-cell gene regulatory network inference analysis |
| Find out the significant the regulons (TFs) and the target genes of each regulon across cell types for different disease states |
| TF | Cell Type | Tissue | Disease Stage | Target Gene | RSS | Regulon Activity |
| ∗The dot plots of a searched regulon are shown for all cell subpopulations in each disease state of each tissue based on the regulon specific score inferred using pySCENIC and by calculating the average expression. |
| Page: 1 |
Top |
Somatic mutation of malignant transformation related genes |
| Annotation of somatic variants for genes involved in malignant transformation |
| Hugo Symbol | Variant Class | Variant Classification | dbSNP RS | HGVSc | HGVSp | HGVSp Short | SWISSPROT | BIOTYPE | SIFT | PolyPhen | Tumor Sample Barcode | Tissue | Histology | Sex | Age | Stage | Therapy Types | Drugs | Outcome |
| FIBIN | SNV | Missense_Mutation | novel | c.444N>T | p.Gln148His | p.Q148H | Q8TAL6 | protein_coding | deleterious_low_confidence(0) | possibly_damaging(0.526) | TCGA-5L-AAT0-01 | Breast | breast invasive carcinoma | Female | <65 | I/II | Hormone Therapy | tamoxiphen | SD |
| FIBIN | SNV | Missense_Mutation | novel | c.268N>A | p.Gln90Lys | p.Q90K | Q8TAL6 | protein_coding | deleterious_low_confidence(0.03) | possibly_damaging(0.457) | TCGA-A7-A5ZX-01 | Breast | breast invasive carcinoma | Female | <65 | III/IV | Chemotherapy | doxorubicin | CR |
| FIBIN | SNV | Missense_Mutation | novel | c.362G>T | p.Arg121Leu | p.R121L | Q8TAL6 | protein_coding | deleterious_low_confidence(0) | possibly_damaging(0.481) | TCGA-OL-A6VR-01 | Breast | breast invasive carcinoma | Female | <65 | I/II | Unknown | Unknown | SD |
| FIBIN | insertion | Frame_Shift_Ins | novel | c.514_515insACAGCCCTAT | p.Leu172HisfsTer27 | p.L172Hfs*27 | Q8TAL6 | protein_coding | TCGA-AN-A0FX-01 | Breast | breast invasive carcinoma | Female | <65 | I/II | Unknown | Unknown | SD | ||
| FIBIN | insertion | In_Frame_Ins | novel | c.516_517insATGTCCAACTTA | p.Leu172_Leu173insMetSerAsnLeu | p.L172_L173insMSNL | Q8TAL6 | protein_coding | TCGA-AN-A0FX-01 | Breast | breast invasive carcinoma | Female | <65 | I/II | Unknown | Unknown | SD | ||
| FIBIN | SNV | Missense_Mutation | c.361N>T | p.Arg121Trp | p.R121W | Q8TAL6 | protein_coding | deleterious_low_confidence(0) | possibly_damaging(0.832) | TCGA-A6-6648-01 | Colorectum | colon adenocarcinoma | Male | <65 | I/II | Chemotherapy | oxaliplatin | PD | |
| FIBIN | SNV | Missense_Mutation | c.361N>T | p.Arg121Trp | p.R121W | Q8TAL6 | protein_coding | deleterious_low_confidence(0) | possibly_damaging(0.832) | TCGA-AA-3663-01 | Colorectum | colon adenocarcinoma | Male | <65 | I/II | Unknown | Unknown | SD | |
| FIBIN | SNV | Missense_Mutation | c.18C>A | p.Phe6Leu | p.F6L | Q8TAL6 | protein_coding | tolerated_low_confidence(0.92) | benign(0) | TCGA-CA-6718-01 | Colorectum | colon adenocarcinoma | Male | <65 | I/II | Unknown | Unknown | PD | |
| FIBIN | SNV | Missense_Mutation | rs759764078 | c.457N>T | p.Arg153Trp | p.R153W | Q8TAL6 | protein_coding | deleterious_low_confidence(0) | benign(0) | TCGA-F4-6570-01 | Colorectum | colon adenocarcinoma | Female | >=65 | I/II | Unknown | Unknown | SD |
| FIBIN | SNV | Missense_Mutation | rs147357826 | c.163C>T | p.Leu55Phe | p.L55F | Q8TAL6 | protein_coding | deleterious_low_confidence(0.01) | probably_damaging(0.998) | TCGA-AJ-A2QO-01 | Endometrium | uterine corpus endometrioid carcinoma | Female | >=65 | I/II | Unknown | Unknown | SD |
| Page: 1 2 3 |
Top |
Related drugs of malignant transformation related genes |
| Identification of chemicals and drugs interact with genes involved in malignant transfromation |
| (DGIdb 4.0) |
| Entrez ID | Symbol | Category | Interaction Types | Drug Claim Name | Drug Name | PMIDs |
| Page: 1 |

Copyright 2023-Present -The University of Texas Health Science Center at Houston |