
|
|||||
|
 | |
| |
| |
| |
| |
| |
|
Gene: FHL2 |
Gene summary for FHL2 |
| Gene information | Species | Human | Gene symbol | FHL2 | Gene ID | 2274 |
| Gene name | four and a half LIM domains 2 | |
| Gene Alias | AAG11 | |
| Cytomap | 2q12.2 | |
| Gene Type | protein-coding | GO ID | GO:0000122 | UniProtAcc | Q14192 |
Top |
Malignant transformation analysis |
| Identification of the aberrant gene expression in precancerous and cancerous lesions by comparing the gene expression of stem-like cells in diseased tissues with normal stem cells |
| Entrez ID | Symbol | Replicates | Species | Organ | Tissue | Adj P-value | Log2FC | Malignancy |
| 2274 | FHL2 | HTA11_3410_2000001011 | Human | Colorectum | AD | 3.30e-02 | 2.53e-01 | 0.0155 |
| 2274 | FHL2 | HTA11_2487_2000001011 | Human | Colorectum | SER | 1.46e-08 | 6.34e-01 | -0.1808 |
| 2274 | FHL2 | HTA11_1938_2000001011 | Human | Colorectum | AD | 2.12e-20 | 1.09e+00 | -0.0811 |
| 2274 | FHL2 | HTA11_78_2000001011 | Human | Colorectum | AD | 4.58e-13 | 7.65e-01 | -0.1088 |
| 2274 | FHL2 | HTA11_347_2000001011 | Human | Colorectum | AD | 1.61e-04 | 3.03e-01 | -0.1954 |
| 2274 | FHL2 | HTA11_411_2000001011 | Human | Colorectum | SER | 5.89e-06 | 1.54e+00 | -0.2602 |
| 2274 | FHL2 | HTA11_2112_2000001011 | Human | Colorectum | SER | 3.44e-04 | 1.07e+00 | -0.2196 |
| 2274 | FHL2 | HTA11_1391_2000001011 | Human | Colorectum | AD | 3.98e-17 | 1.05e+00 | -0.059 |
| 2274 | FHL2 | HTA11_866_3004761011 | Human | Colorectum | AD | 2.91e-06 | 5.65e-01 | 0.096 |
| 2274 | FHL2 | HTA11_6818_2000001021 | Human | Colorectum | AD | 3.54e-09 | 6.20e-01 | 0.0588 |
| 2274 | FHL2 | HTA11_99999970781_79442 | Human | Colorectum | MSS | 7.03e-05 | 5.12e-01 | 0.294 |
| 2274 | FHL2 | HTA11_99999971662_82457 | Human | Colorectum | MSS | 9.47e-07 | 6.47e-01 | 0.3859 |
| 2274 | FHL2 | HTA11_99999973899_84307 | Human | Colorectum | MSS | 2.62e-05 | 5.80e-01 | 0.2585 |
| 2274 | FHL2 | A015-C-203 | Human | Colorectum | FAP | 2.12e-07 | -2.05e-01 | -0.1294 |
| 2274 | FHL2 | A002-C-205 | Human | Colorectum | FAP | 1.31e-04 | -2.39e-01 | -0.1236 |
| 2274 | FHL2 | A015-C-106 | Human | Colorectum | FAP | 4.55e-02 | -1.35e-01 | -0.0511 |
| 2274 | FHL2 | A015-C-104 | Human | Colorectum | FAP | 6.53e-12 | -2.62e-01 | -0.1899 |
| 2274 | FHL2 | A002-C-016 | Human | Colorectum | FAP | 2.53e-04 | -7.15e-02 | 0.0521 |
| 2274 | FHL2 | A002-C-116 | Human | Colorectum | FAP | 2.05e-07 | -6.47e-02 | -0.0452 |
| 2274 | FHL2 | A018-E-020 | Human | Colorectum | FAP | 1.81e-02 | -1.67e-01 | -0.2034 |
| Page: 1 2 3 4 5 6 7 8 |
| Tissue | Expression Dynamics | Abbreviation |
| Colorectum (GSE201348) |  | FAP: Familial adenomatous polyposis |
| CRC: Colorectal cancer | ||
| Colorectum (HTA11) |  | AD: Adenomas |
| SER: Sessile serrated lesions | ||
| MSI-H: Microsatellite-high colorectal cancer | ||
| MSS: Microsatellite stable colorectal cancer | ||
| Endometrium | 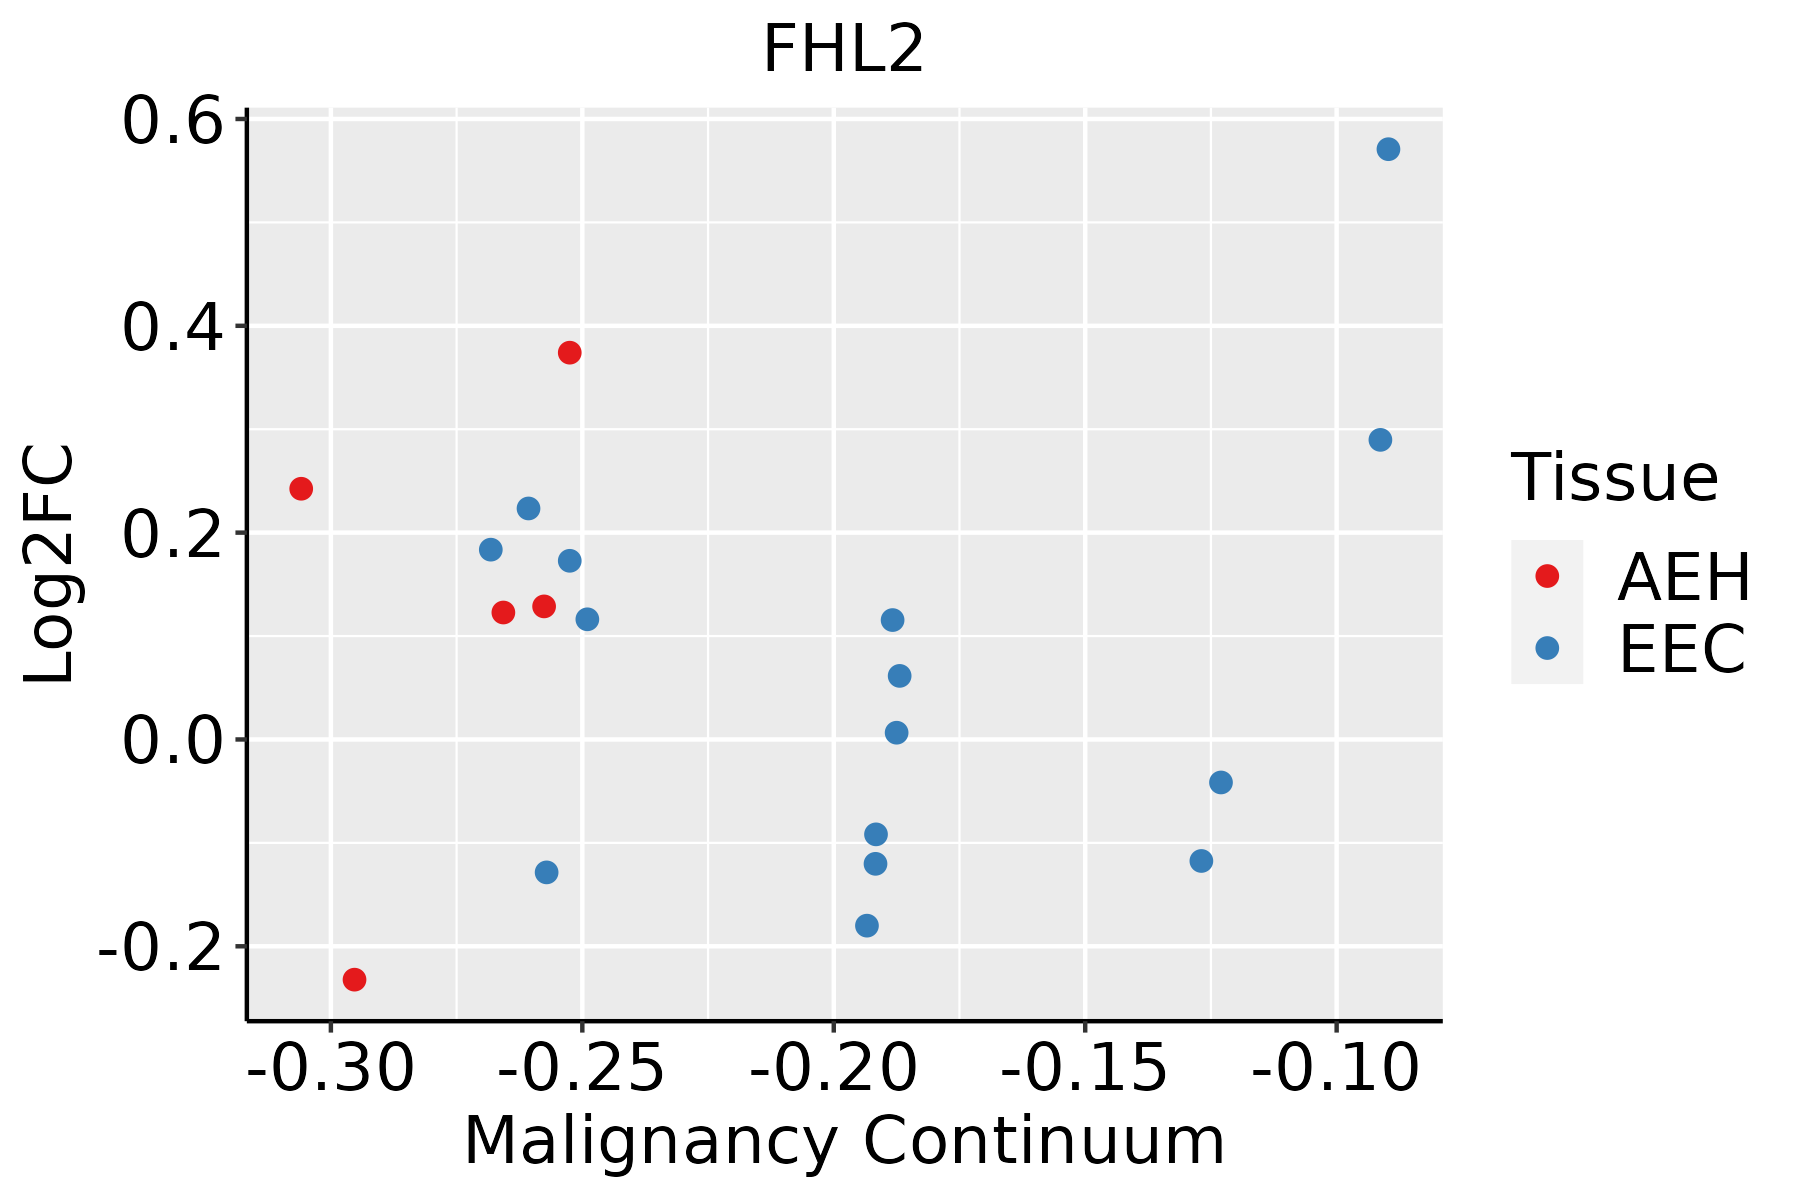 | AEH: Atypical endometrial hyperplasia |
| EEC: Endometrioid Cancer | ||
| Esophagus | 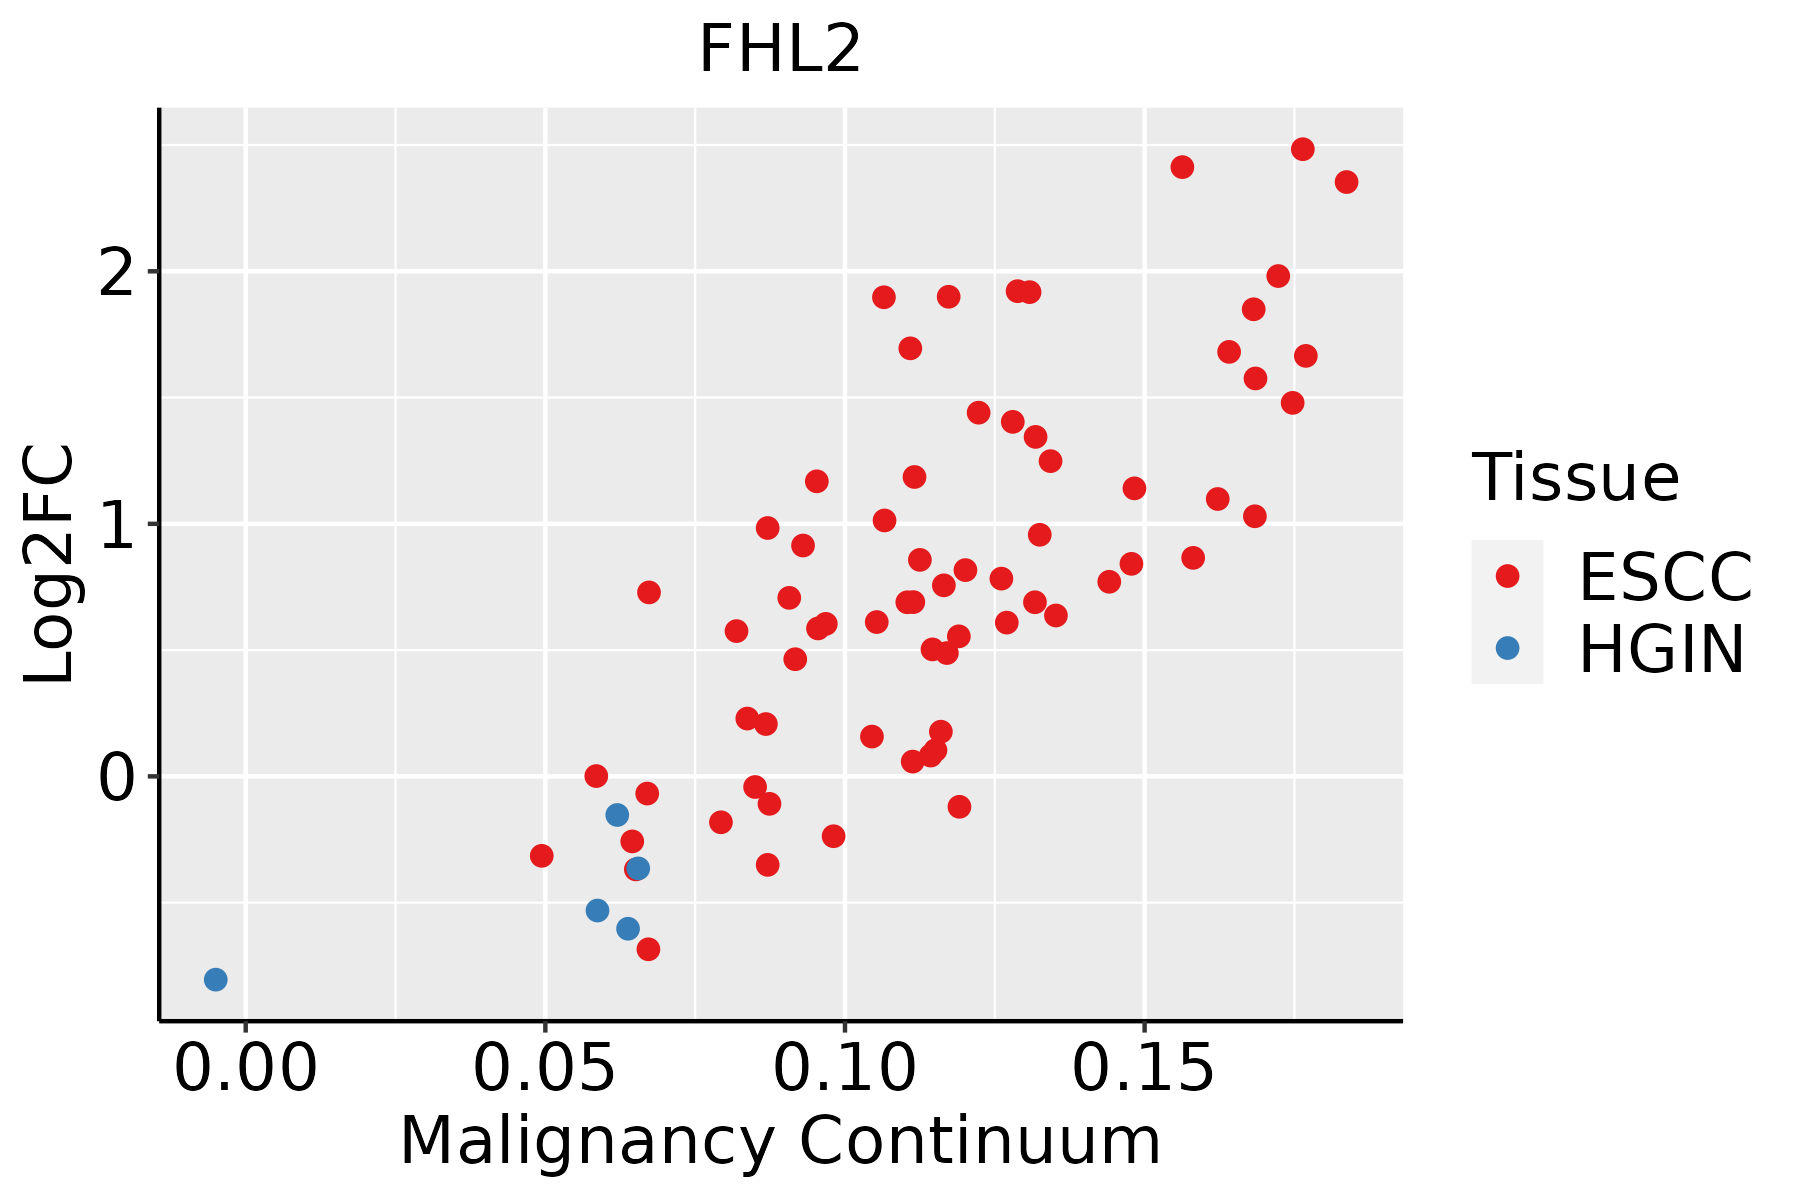 | ESCC: Esophageal squamous cell carcinoma |
| HGIN: High-grade intraepithelial neoplasias | ||
| LGIN: Low-grade intraepithelial neoplasias | ||
| Lung | 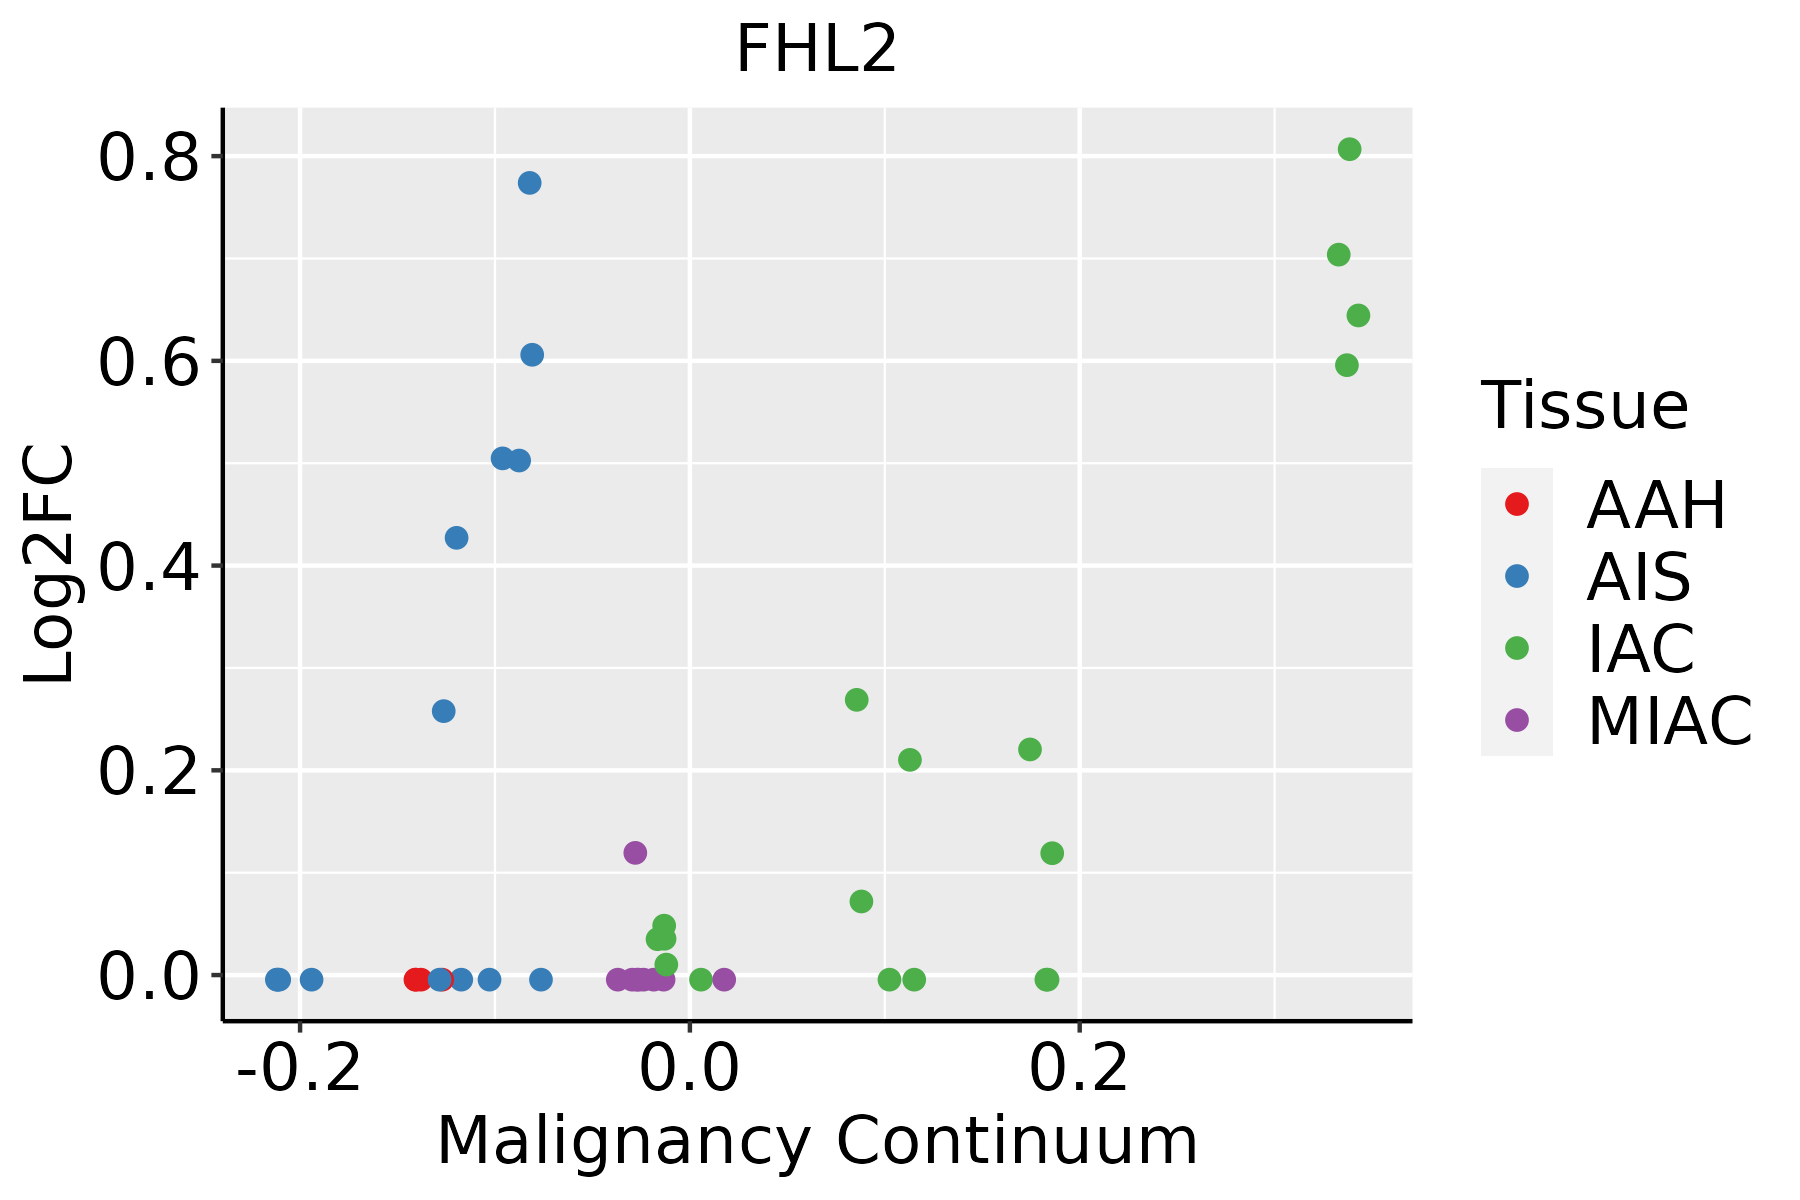 | AAH: Atypical adenomatous hyperplasia |
| AIS: Adenocarcinoma in situ | ||
| IAC: Invasive lung adenocarcinoma | ||
| MIA: Minimally invasive adenocarcinoma | ||
| Oral Cavity | 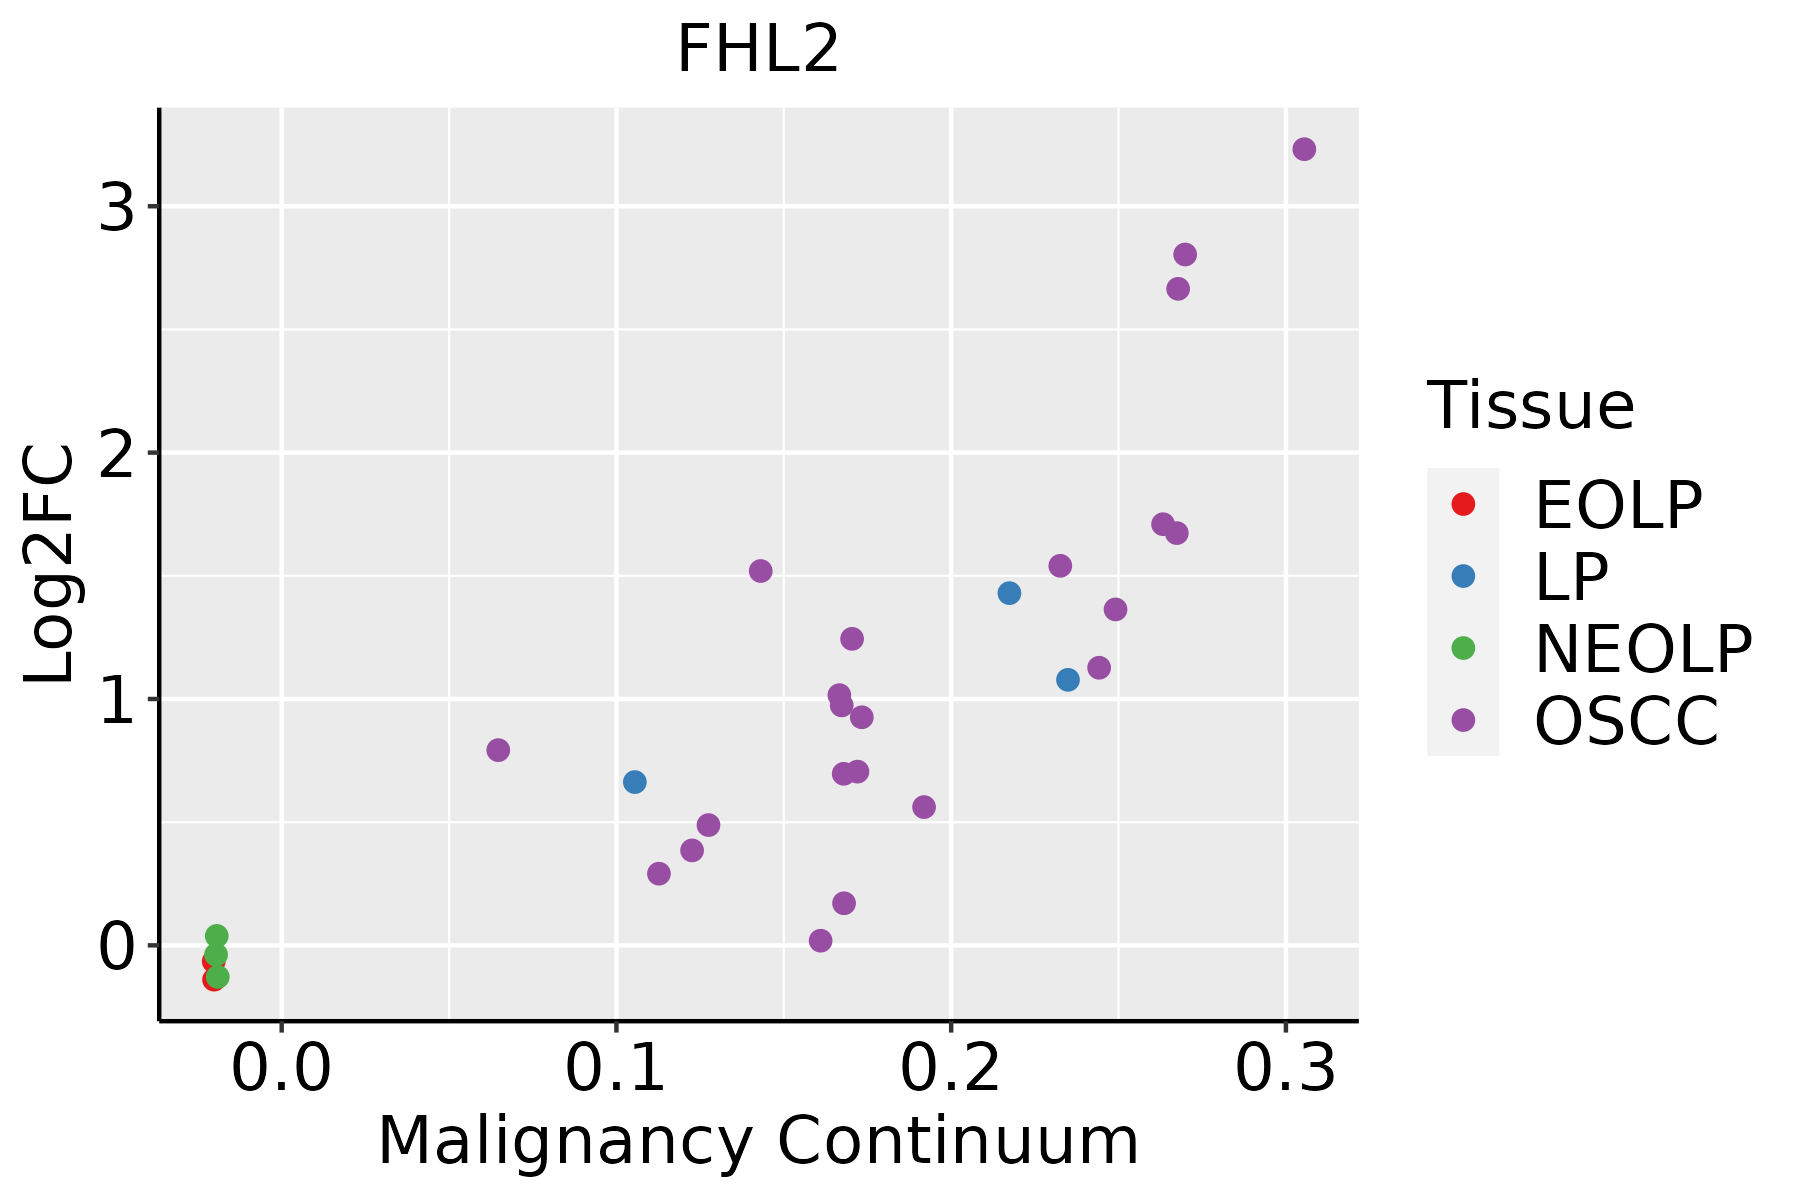 | EOLP: Erosive Oral lichen planus |
| LP: leukoplakia | ||
| NEOLP: Non-erosive oral lichen planus | ||
| OSCC: Oral squamous cell carcinoma | ||
| Prostate | 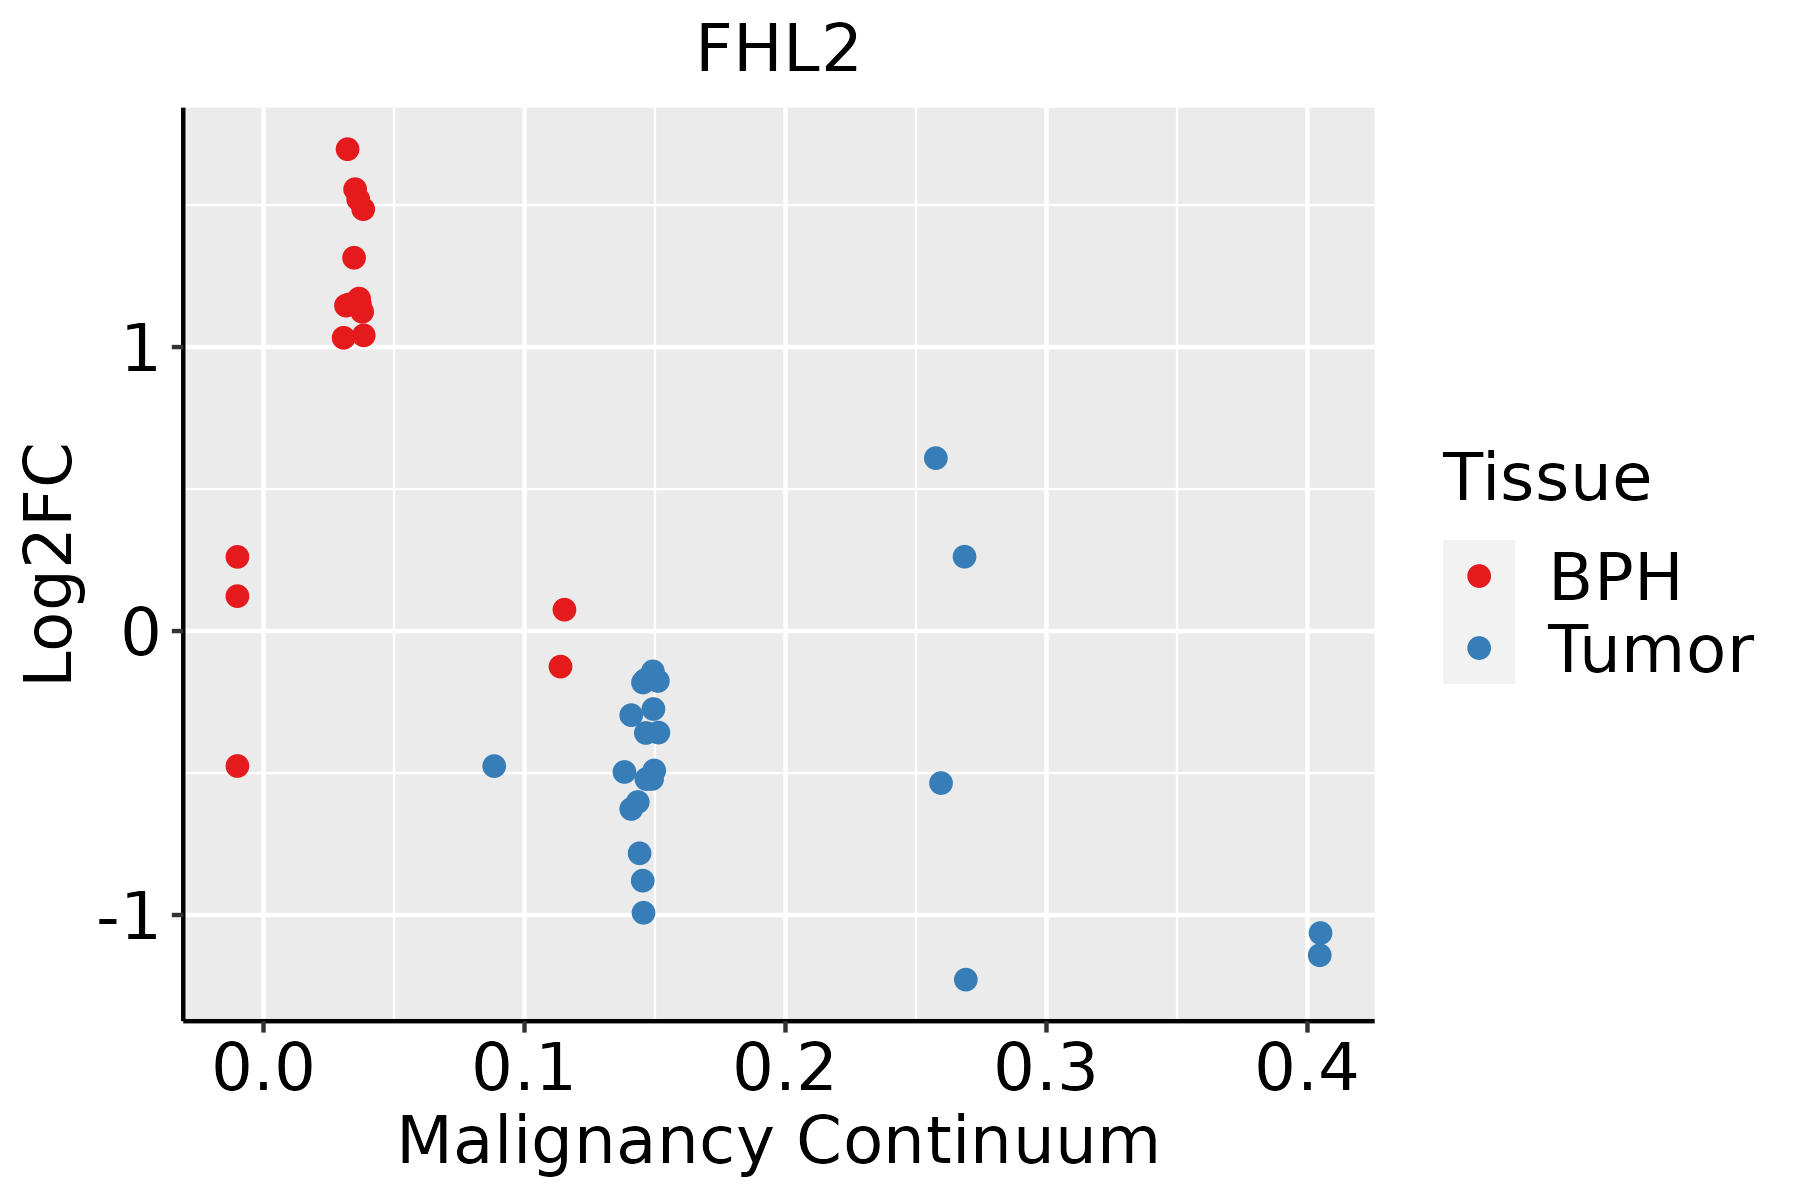 | BPH: Benign Prostatic Hyperplasia |
| Skin | 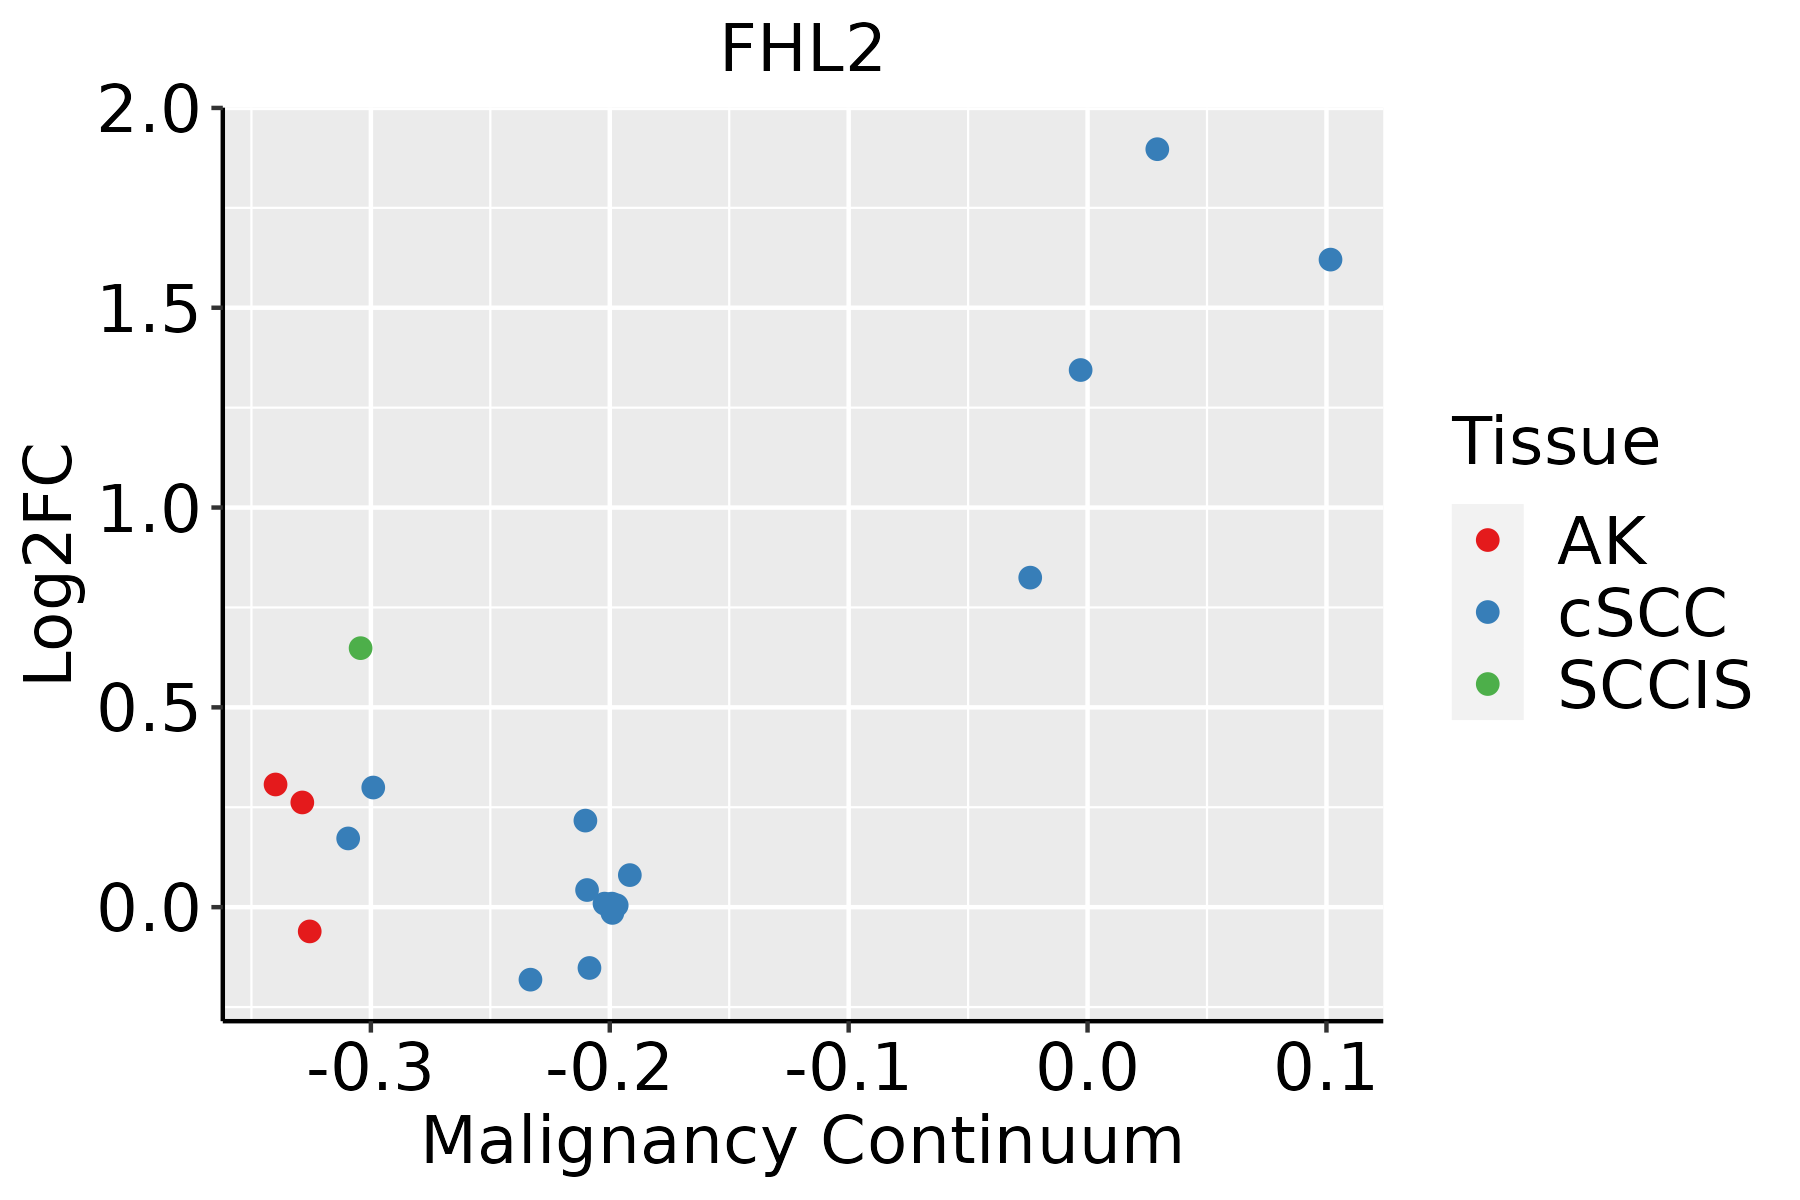 | AK: Actinic keratosis |
| cSCC: Cutaneous squamous cell carcinoma | ||
| SCCIS:squamous cell carcinoma in situ | ||
| Thyroid | 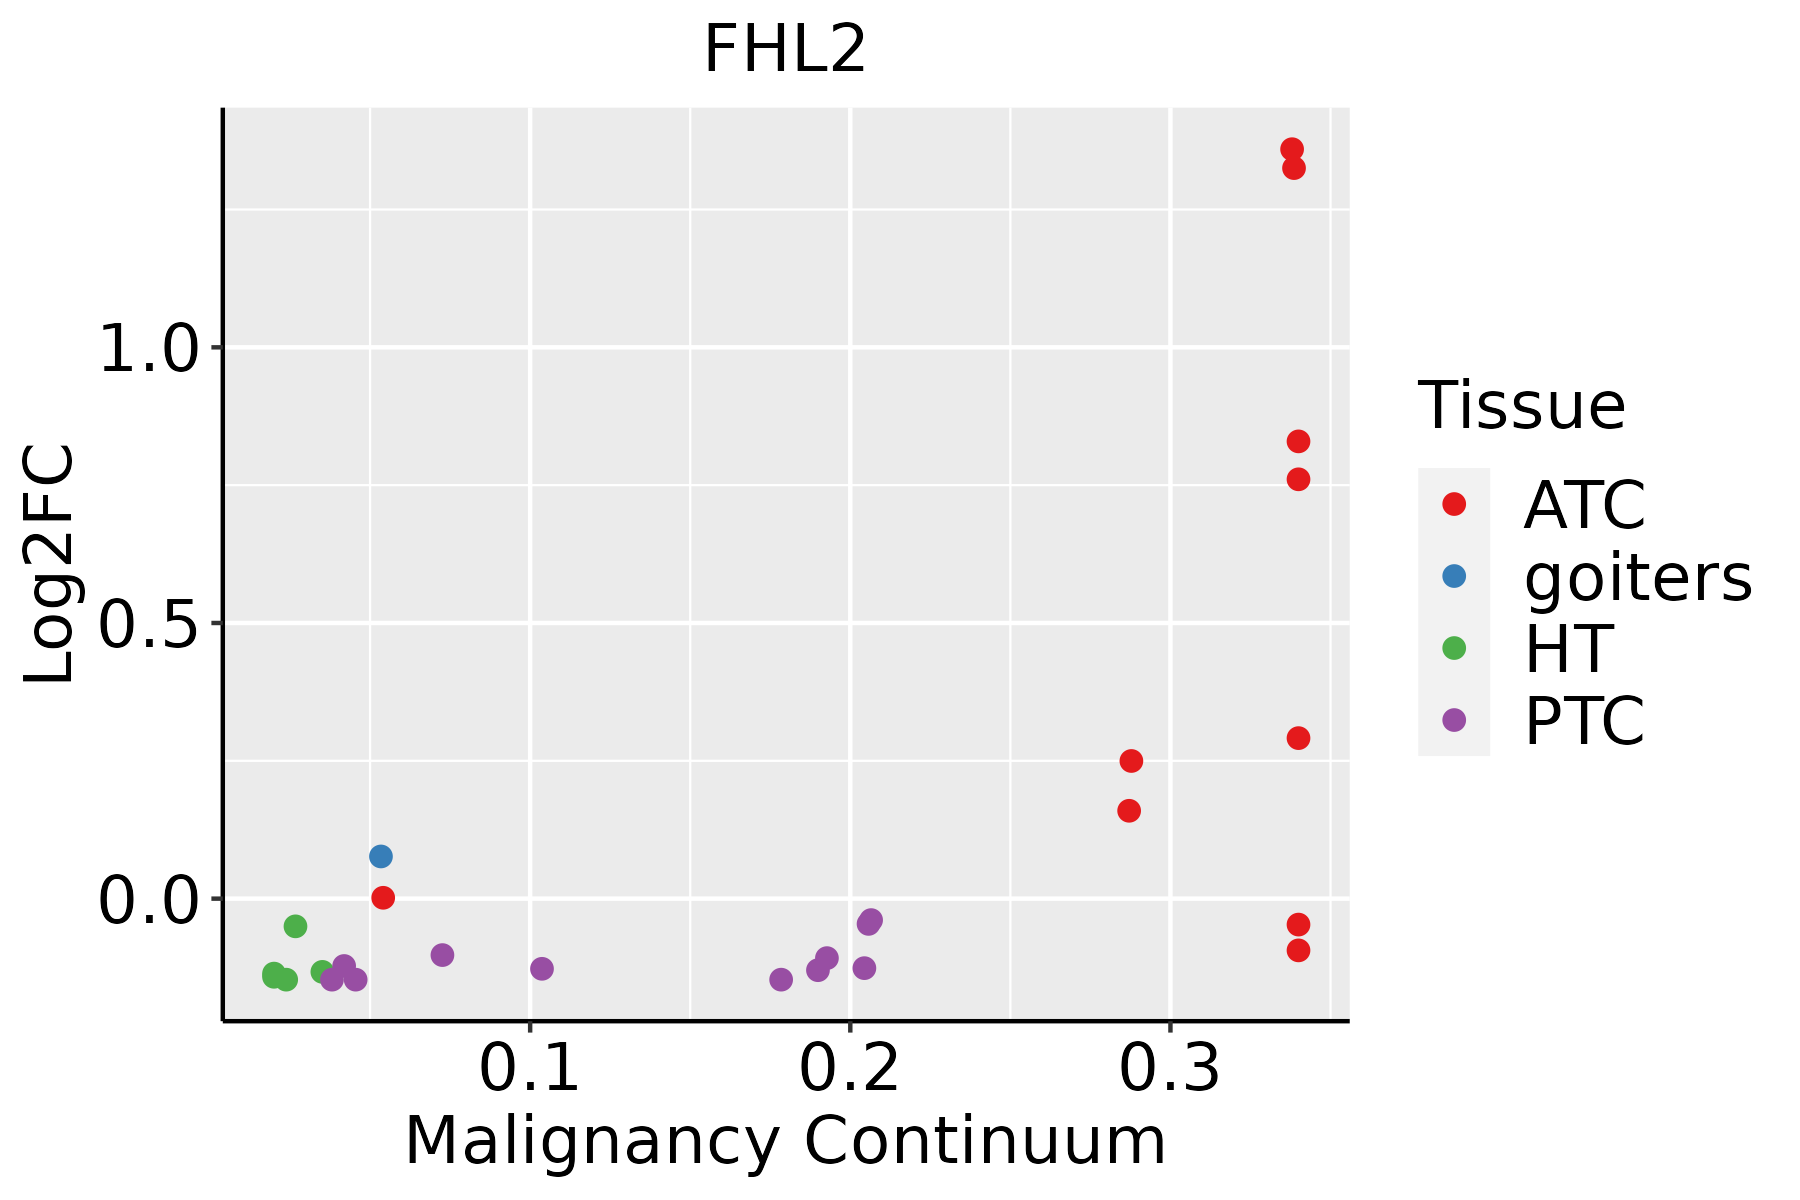 | ATC: Anaplastic thyroid cancer |
| HT: Hashimoto's thyroiditis | ||
| PTC: Papillary thyroid cancer |
| ∗log2FC in expression of this searched gene in stem-like cells from each diseased tissue sample relative to stem-like cells in normal samples in each tissue plotted against the malignancy continuum. Samples are colored based on if they are from different disease stage. |
Top |
Malignant transformation related pathway analysis |
| Find out the enriched GO biological processes and KEGG pathways involved in transition from healthy to precancer to cancer |
| Tissue | Disease Stage | Enriched GO biological Processes |
| Colorectum | AD |  |
| Colorectum | SER |  |
| Colorectum | MSS |  |
| Colorectum | MSI-H |  |
| Colorectum | FAP |  |
| ∗Top 15 enriched GO BP terms are showed in the bar plot of each disease state in each tissue. Each row represents a significant GO biological process which is colored according to the -log10(p.adjust). |
| Page: 1 2 3 4 5 6 7 8 9 |
| GO ID | Tissue | Disease Stage | Description | Gene Ratio | Bg Ratio | pvalue | p.adjust | Count |
| GO:0001649 | Colorectum | AD | osteoblast differentiation | 70/3918 | 229/18723 | 3.59e-04 | 4.18e-03 | 70 |
| GO:0001503 | Colorectum | AD | ossification | 106/3918 | 408/18723 | 7.68e-03 | 4.64e-02 | 106 |
| GO:00016491 | Colorectum | SER | osteoblast differentiation | 56/2897 | 229/18723 | 2.49e-04 | 4.21e-03 | 56 |
| GO:00015031 | Colorectum | SER | ossification | 82/2897 | 408/18723 | 6.76e-03 | 4.78e-02 | 82 |
| GO:00016492 | Colorectum | MSS | osteoblast differentiation | 64/3467 | 229/18723 | 2.91e-04 | 3.83e-03 | 64 |
| GO:00015032 | Colorectum | MSS | ossification | 96/3467 | 408/18723 | 6.09e-03 | 4.07e-02 | 96 |
| GO:00016493 | Colorectum | FAP | osteoblast differentiation | 51/2622 | 229/18723 | 4.40e-04 | 5.22e-03 | 51 |
| GO:00015033 | Colorectum | FAP | ossification | 79/2622 | 408/18723 | 1.53e-03 | 1.37e-02 | 79 |
| GO:0048016 | Colorectum | FAP | inositol phosphate-mediated signaling | 16/2622 | 55/18723 | 2.78e-03 | 2.15e-02 | 16 |
| GO:0055006 | Colorectum | FAP | cardiac cell development | 22/2622 | 91/18723 | 6.44e-03 | 4.01e-02 | 22 |
| GO:0003205 | Colorectum | FAP | cardiac chamber development | 34/2622 | 161/18723 | 8.57e-03 | 4.96e-02 | 34 |
| GO:0003206 | Colorectum | FAP | cardiac chamber morphogenesis | 27/2622 | 121/18723 | 8.64e-03 | 4.98e-02 | 27 |
| GO:0003007 | Colorectum | CRC | heart morphogenesis | 44/2078 | 246/18723 | 9.49e-04 | 1.15e-02 | 44 |
| GO:00016494 | Colorectum | CRC | osteoblast differentiation | 41/2078 | 229/18723 | 1.36e-03 | 1.50e-02 | 41 |
| GO:0097720 | Colorectum | CRC | calcineurin-mediated signaling | 13/2078 | 48/18723 | 1.72e-03 | 1.77e-02 | 13 |
| GO:0033173 | Colorectum | CRC | calcineurin-NFAT signaling cascade | 12/2078 | 43/18723 | 1.93e-03 | 1.96e-02 | 12 |
| GO:00480161 | Colorectum | CRC | inositol phosphate-mediated signaling | 14/2078 | 55/18723 | 2.21e-03 | 2.15e-02 | 14 |
| GO:00015034 | Colorectum | CRC | ossification | 64/2078 | 408/18723 | 2.73e-03 | 2.49e-02 | 64 |
| GO:0070884 | Colorectum | CRC | regulation of calcineurin-NFAT signaling cascade | 10/2078 | 34/18723 | 2.96e-03 | 2.66e-02 | 10 |
| GO:0060537 | Colorectum | CRC | muscle tissue development | 63/2078 | 403/18723 | 3.17e-03 | 2.78e-02 | 63 |
| Page: 1 2 3 4 5 6 7 8 |
| Pathway ID | Tissue | Disease Stage | Description | Gene Ratio | Bg Ratio | pvalue | p.adjust | qvalue | Count |
| hsa04380 | Lung | IAC | Osteoclast differentiation | 27/1053 | 128/8465 | 3.74e-03 | 1.84e-02 | 1.22e-02 | 27 |
| hsa043801 | Lung | IAC | Osteoclast differentiation | 27/1053 | 128/8465 | 3.74e-03 | 1.84e-02 | 1.22e-02 | 27 |
| hsa043806 | Oral cavity | OSCC | Osteoclast differentiation | 73/3704 | 128/8465 | 1.60e-03 | 4.44e-03 | 2.26e-03 | 73 |
| hsa0438011 | Oral cavity | OSCC | Osteoclast differentiation | 73/3704 | 128/8465 | 1.60e-03 | 4.44e-03 | 2.26e-03 | 73 |
| Page: 1 |
Top |
Cell-cell communication analysis |
| Identification of potential cell-cell interactions between two cell types and their ligand-receptor pairs for different disease states |
| Ligand | Receptor | LRpair | Pathway | Tissue | Disease Stage |
| Page: 1 |
Top |
Single-cell gene regulatory network inference analysis |
| Find out the significant the regulons (TFs) and the target genes of each regulon across cell types for different disease states |
| TF | Cell Type | Tissue | Disease Stage | Target Gene | RSS | Regulon Activity |
| FHL2 | STM | Pancreas | PanIN | TMC5,MLPH,ABHD17C, etc. | 2.89e-01 |  |
| ∗The dot plots of a searched regulon are shown for all cell subpopulations in each disease state of each tissue based on the regulon specific score inferred using pySCENIC and by calculating the average expression. |
| Page: 1 |
Top |
Somatic mutation of malignant transformation related genes |
| Annotation of somatic variants for genes involved in malignant transformation |
| Hugo Symbol | Variant Class | Variant Classification | dbSNP RS | HGVSc | HGVSp | HGVSp Short | SWISSPROT | BIOTYPE | SIFT | PolyPhen | Tumor Sample Barcode | Tissue | Histology | Sex | Age | Stage | Therapy Types | Drugs | Outcome |
| FHL2 | SNV | Missense_Mutation | c.584N>A | p.Leu195Gln | p.L195Q | Q14192 | protein_coding | deleterious(0) | probably_damaging(0.998) | TCGA-D8-A1JP-01 | Breast | breast invasive carcinoma | Female | >=65 | I/II | Hormone Therapy | tamoxiphen | SD | |
| FHL2 | insertion | Nonsense_Mutation | novel | c.567_568insTGTAATAACACAGGAGAAGTTTTATGATGTGGG | p.Thr189_Ala190insCysAsnAsnThrGlyGluValLeuTerCysGly | p.T189_A190insCNNTGEVL*CG | Q14192 | protein_coding | TCGA-A8-A08H-01 | Breast | breast invasive carcinoma | Female | >=65 | I/II | Unknown | Unknown | SD | ||
| FHL2 | deletion | Frame_Shift_Del | novel | c.429delC | p.Asp145ThrfsTer66 | p.D145Tfs*66 | Q14192 | protein_coding | TCGA-D8-A27V-01 | Breast | breast invasive carcinoma | Female | <65 | I/II | Hormone Therapy | tamoxiphen | SD | ||
| FHL2 | SNV | Missense_Mutation | rs536715218 | c.10C>T | p.Arg4Cys | p.R4C | Q14192 | protein_coding | tolerated(0.07) | benign(0.022) | TCGA-AA-3663-01 | Colorectum | colon adenocarcinoma | Male | <65 | I/II | Unknown | Unknown | SD |
| FHL2 | SNV | Missense_Mutation | c.613N>T | p.Asp205Tyr | p.D205Y | Q14192 | protein_coding | deleterious(0) | possibly_damaging(0.908) | TCGA-AA-A010-01 | Colorectum | colon adenocarcinoma | Female | <65 | I/II | Chemotherapy | folinic | CR | |
| FHL2 | SNV | Missense_Mutation | rs752531815 | c.338N>A | p.Arg113His | p.R113H | Q14192 | protein_coding | deleterious(0) | probably_damaging(0.988) | TCGA-AZ-4313-01 | Colorectum | colon adenocarcinoma | Female | <65 | I/II | Unknown | Unknown | SD |
| FHL2 | SNV | Missense_Mutation | rs188279857 | c.725N>A | p.Arg242Gln | p.R242Q | Q14192 | protein_coding | deleterious(0.04) | possibly_damaging(0.805) | TCGA-AG-A002-01 | Colorectum | rectum adenocarcinoma | Male | <65 | I/II | Unknown | Unknown | SD |
| FHL2 | SNV | Missense_Mutation | novel | c.363C>A | p.Ser121Arg | p.S121R | Q14192 | protein_coding | tolerated(0.12) | possibly_damaging(0.842) | TCGA-A5-A1OF-01 | Endometrium | uterine corpus endometrioid carcinoma | Female | <65 | I/II | Unknown | Unknown | SD |
| FHL2 | SNV | Missense_Mutation | novel | c.444N>A | p.Asn148Lys | p.N148K | Q14192 | protein_coding | tolerated(0.28) | benign(0.117) | TCGA-AX-A06F-01 | Endometrium | uterine corpus endometrioid carcinoma | Female | <65 | III/IV | Chemotherapy | carboplatin | SD |
| FHL2 | SNV | Missense_Mutation | rs373259092 | c.595C>T | p.Arg199Cys | p.R199C | Q14192 | protein_coding | deleterious(0) | probably_damaging(0.959) | TCGA-AX-A0J1-01 | Endometrium | uterine corpus endometrioid carcinoma | Female | >=65 | I/II | Unknown | Unknown | SD |
| Page: 1 2 3 |
Top |
Related drugs of malignant transformation related genes |
| Identification of chemicals and drugs interact with genes involved in malignant transfromation |
| (DGIdb 4.0) |
| Entrez ID | Symbol | Category | Interaction Types | Drug Claim Name | Drug Name | PMIDs |
| 2274 | FHL2 | TRANSCRIPTION FACTOR BINDING | gemcitabine | GEMCITABINE | 24444404 |
| Page: 1 |

Copyright 2023-Present -The University of Texas Health Science Center at Houston |