Schematic overview of the cellular and molecular mechanisms involved in the cancer progression, including the proposed cellular and molecular mechanisms in cancer cells trajectory. AT1: alveolar type 1 cells; AT2: alveolar type 2 cells; AAH: atypical adenomatous hyperplasia; AIS: adenocarcinoma in situ; MIA: minimally invasive adenocarcinoma; IA: invasive adenocarcinoma; EMT: epithelial-mesenchymal transition

Home

Download

Statistics

Help

Contact

Center for Computational Systems Medicine
leaf

Gene summary

leaf

Malignant transformation analysis

leaf

Malignant transformation related pathway analysis

leaf

Cell-cell communication analysis

leaf

Single-cell gene regulatory network inference analysis

leaf

Somatic mutation of malignant transformation related genes

leaf

Related drugs of malignant transformation related genes

Gene: FHL1

Gene summary for FHL1

check button Gene summary.

Gene informationSpeciesHuman
Gene symbol

FHL1

Gene ID

2273

Gene namefour and a half LIM domains 1
Gene AliasFCMSU
CytomapXq26.3
Gene Typeprotein-coding
GO ID

GO:0000082

UniProtAcc

Q13642


Top

Malignant transformation analysis

check button Identification of the aberrant gene expression in precancerous and cancerous lesions by comparing the gene expression of stem-like cells in diseased tissues with normal stem cells
check button Malignant transformation involving gene list.
Entrez IDSymbolReplicatesSpeciesOrganTissueAdj P-valueLog2FCMalignancy
2273FHL1P2T-EHumanEsophagusESCC1.28e-133.02e-010.1177
2273FHL1P8T-EHumanEsophagusESCC2.19e-022.64e-010.0889
2273FHL1P9T-EHumanEsophagusESCC6.53e-095.36e-010.1131
2273FHL1P10T-EHumanEsophagusESCC3.47e-132.78e-010.116
2273FHL1P11T-EHumanEsophagusESCC2.59e-116.00e-010.1426
2273FHL1P12T-EHumanEsophagusESCC6.89e-032.32e-010.1122
2273FHL1P16T-EHumanEsophagusESCC4.53e-05-4.44e-020.1153
2273FHL1P19T-EHumanEsophagusESCC7.74e-081.13e+000.1662
2273FHL1P21T-EHumanEsophagusESCC2.62e-441.11e+000.1617
2273FHL1P22T-EHumanEsophagusESCC6.33e-193.00e-010.1236
2273FHL1P26T-EHumanEsophagusESCC8.90e-681.36e+000.1276
2273FHL1P28T-EHumanEsophagusESCC1.70e-02-5.15e-020.1149
2273FHL1P31T-EHumanEsophagusESCC1.88e-113.70e-010.1251
2273FHL1P32T-EHumanEsophagusESCC6.17e-051.39e-010.1666
2273FHL1P38T-EHumanEsophagusESCC2.45e-044.87e-010.127
2273FHL1P49T-EHumanEsophagusESCC8.72e-212.24e+000.1768
2273FHL1P52T-EHumanEsophagusESCC1.06e-149.92e-010.1555
2273FHL1P61T-EHumanEsophagusESCC1.42e-072.19e-010.099
2273FHL1P79T-EHumanEsophagusESCC8.45e-248.51e-010.1154
2273FHL1P80T-EHumanEsophagusESCC3.89e-155.34e-010.155
Page: 1 2 3 4 

check button Transcriptomic changes along malignancy continuum.
TissueExpression DynamicsAbbreviation
EsophagusThe image shows the transcriptomic changes along malignancy continuum.log2FC in expression of this searched gene in stem-like cells from each diseased tissue sample relative to stem-like cells in normal samples in each tissue plotted against the malignancy continuum. Samples are colored based on if they are from different disease stage.
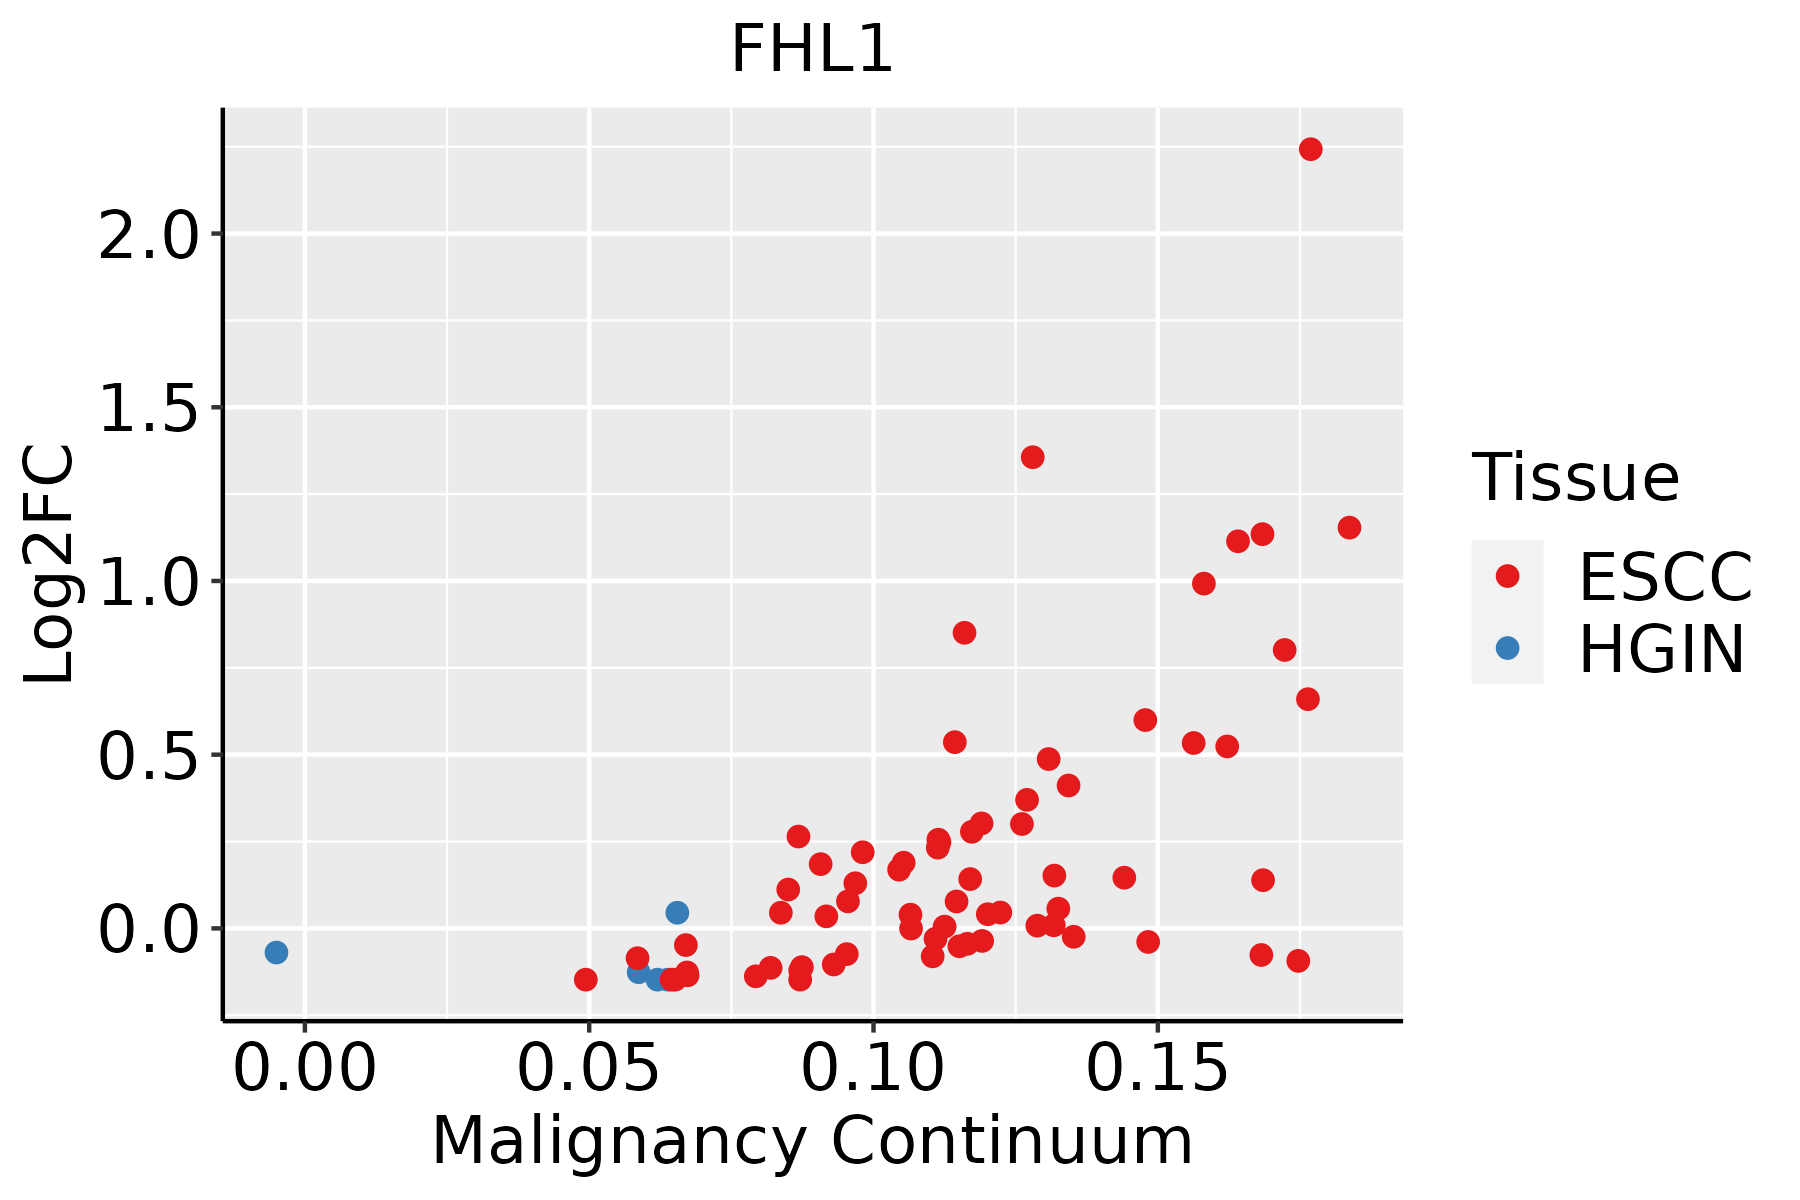
ESCC: Esophageal squamous cell carcinoma
HGIN: High-grade intraepithelial neoplasias
LGIN: Low-grade intraepithelial neoplasias
Oral CavityThe image shows the transcriptomic changes along malignancy continuum.log2FC in expression of this searched gene in stem-like cells from each diseased tissue sample relative to stem-like cells in normal samples in each tissue plotted against the malignancy continuum. Samples are colored based on if they are from different disease stage.
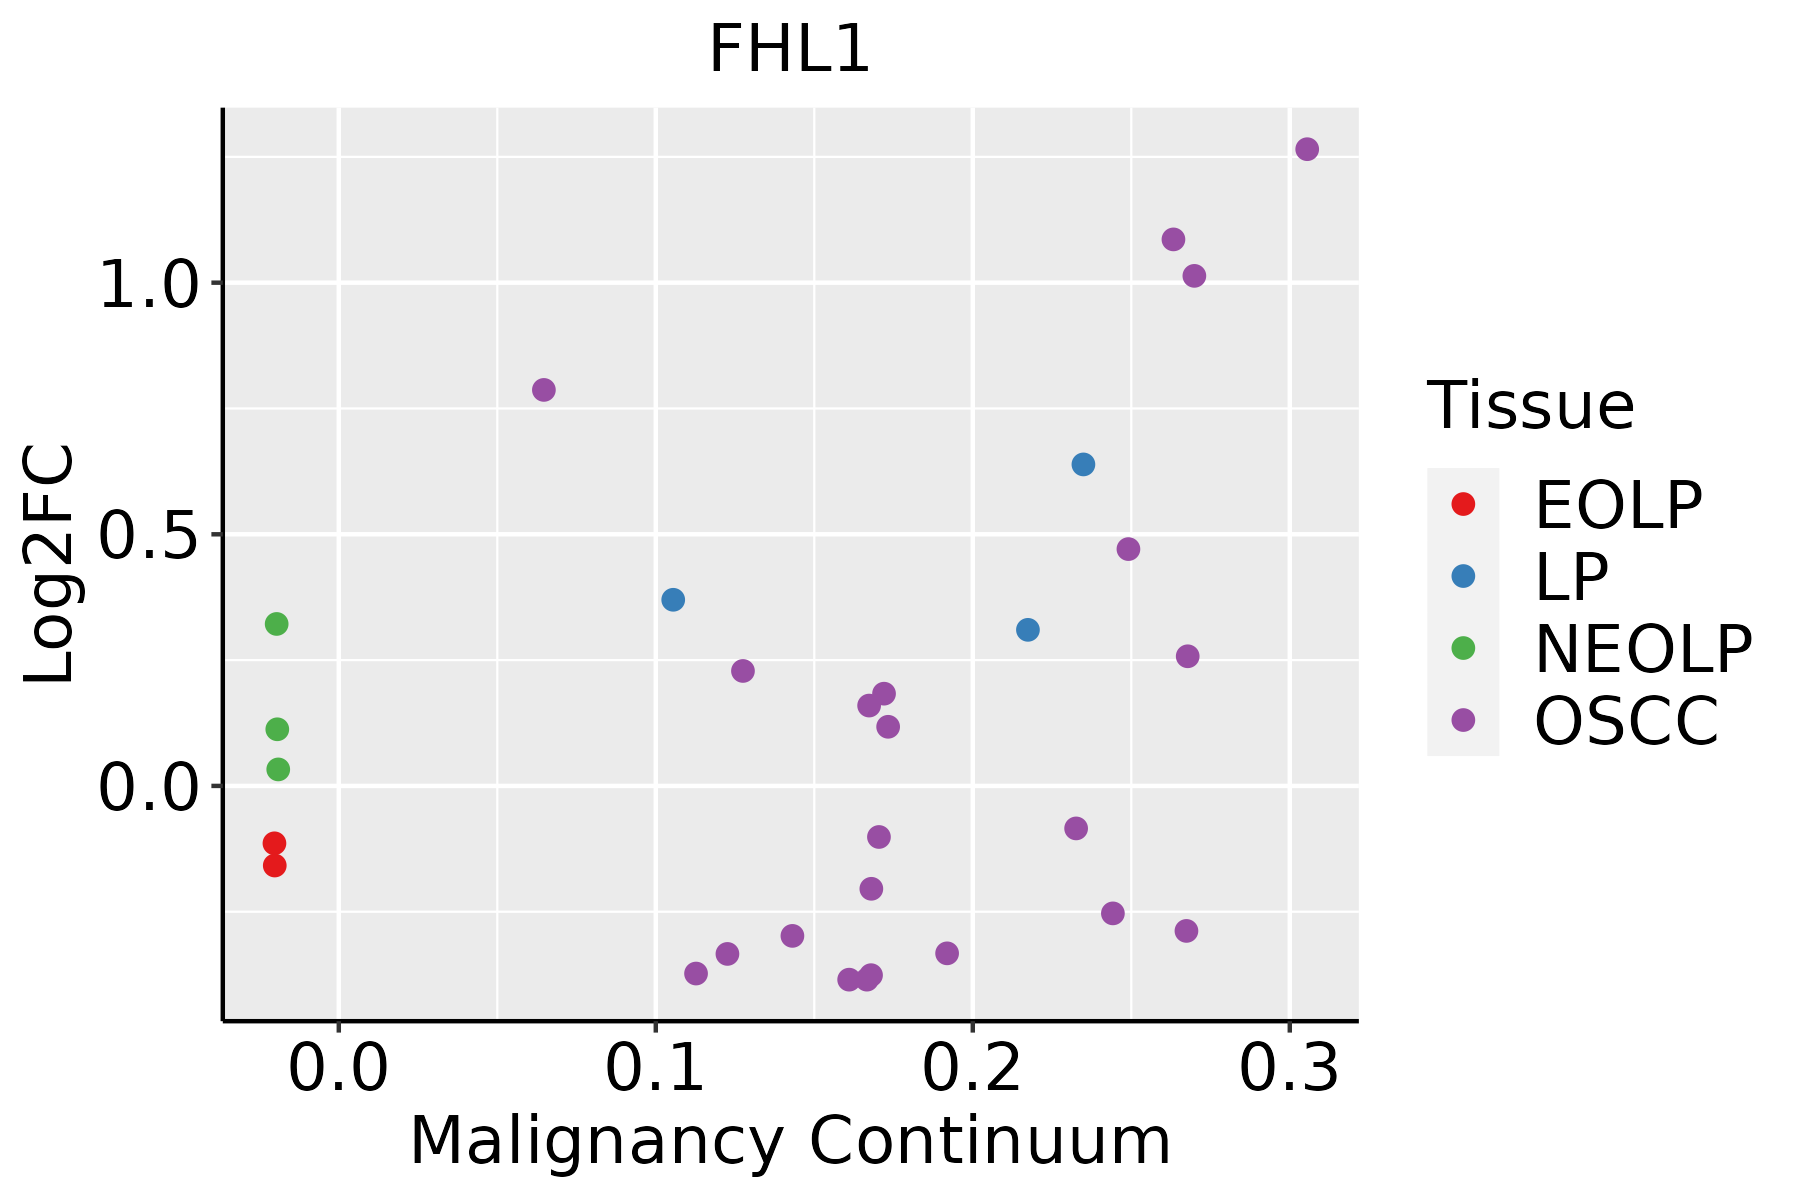
EOLP: Erosive Oral lichen planus
LP: leukoplakia
NEOLP: Non-erosive oral lichen planus
OSCC: Oral squamous cell carcinoma
SkinThe image shows the transcriptomic changes along malignancy continuum.log2FC in expression of this searched gene in stem-like cells from each diseased tissue sample relative to stem-like cells in normal samples in each tissue plotted against the malignancy continuum. Samples are colored based on if they are from different disease stage.
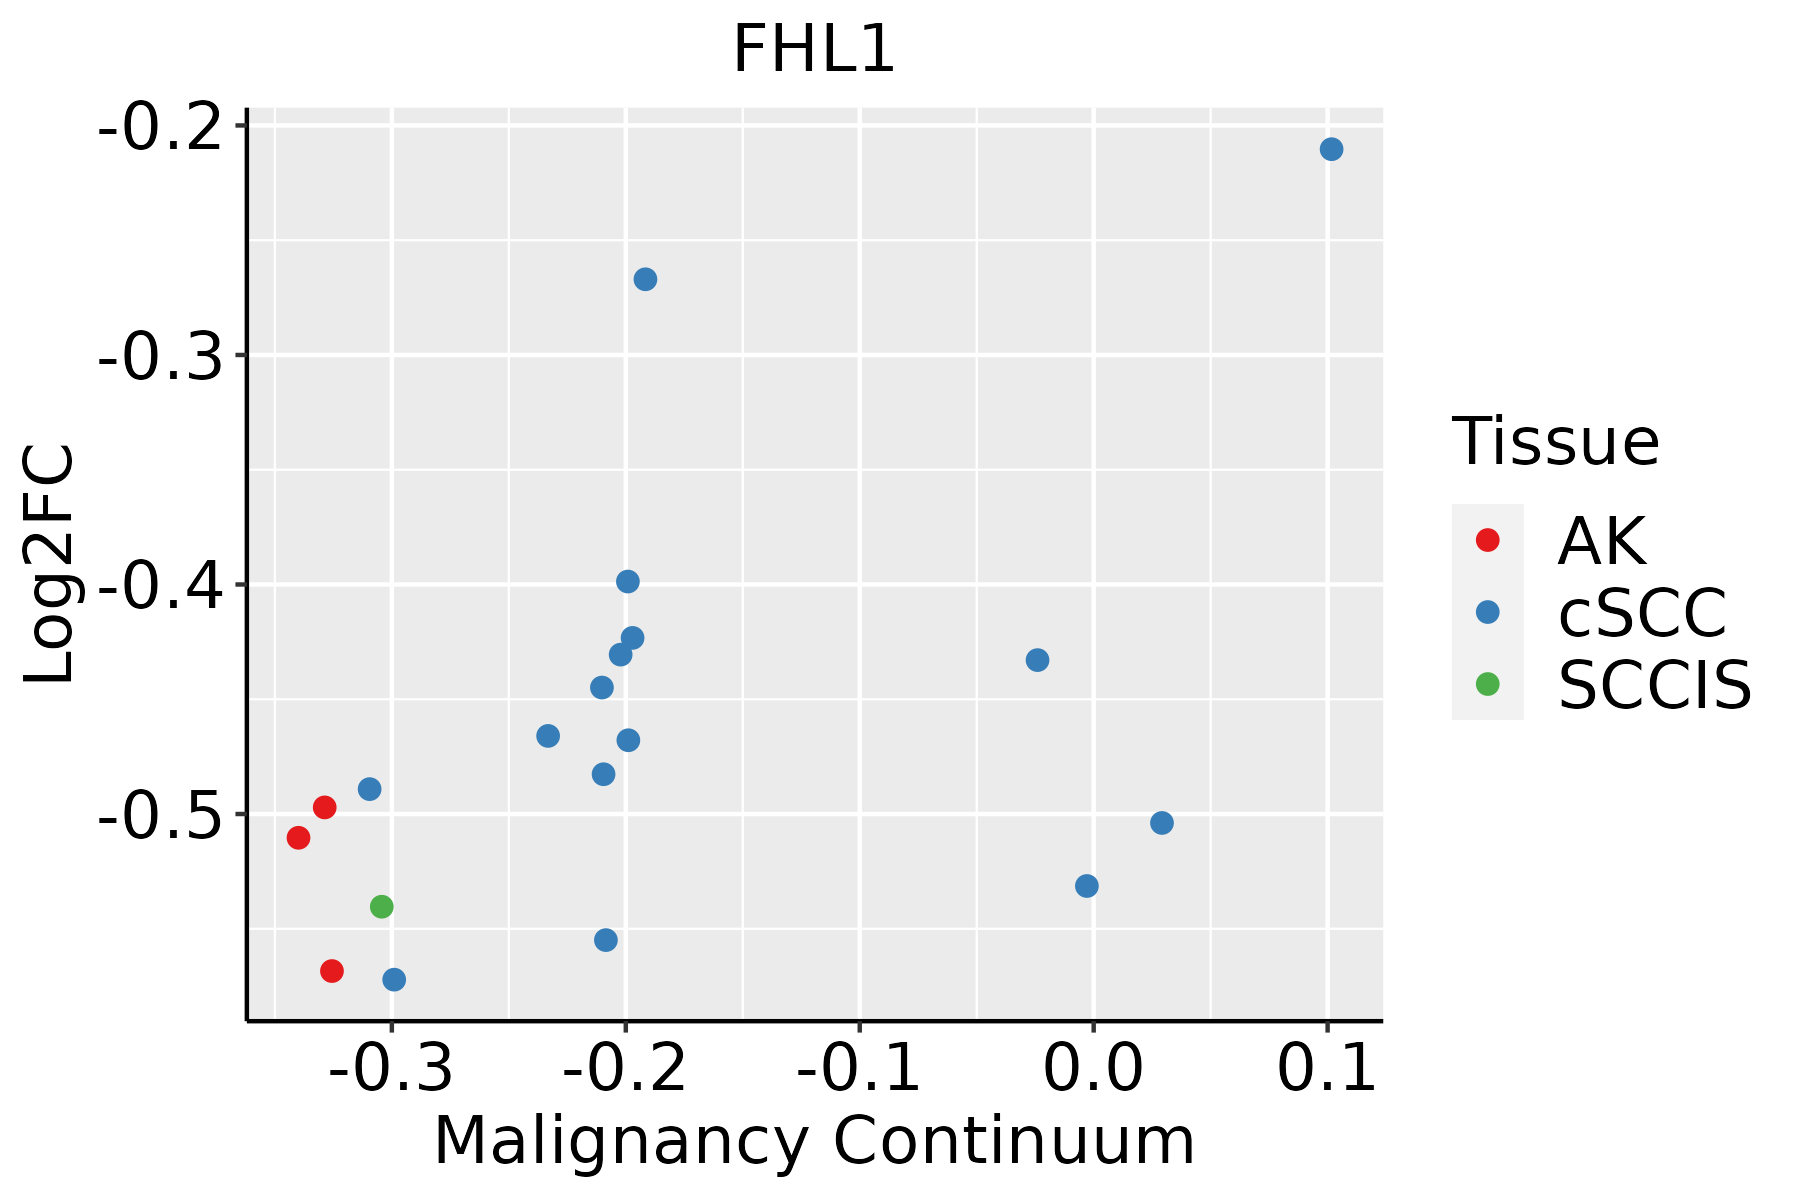
AK: Actinic keratosis
cSCC: Cutaneous squamous cell carcinoma
SCCIS:squamous cell carcinoma in situ
ThyroidThe image shows the transcriptomic changes along malignancy continuum.log2FC in expression of this searched gene in stem-like cells from each diseased tissue sample relative to stem-like cells in normal samples in each tissue plotted against the malignancy continuum. Samples are colored based on if they are from different disease stage.ATC: Anaplastic thyroid cancer
HT: Hashimoto's thyroiditis
PTC: Papillary thyroid cancer
∗log2FC in expression of this searched gene in stem-like cells from each diseased tissue sample relative to stem-like cells in normal samples in each tissue plotted against the malignancy continuum. Samples are colored based on if they are from different disease stage.

Top

Malignant transformation related pathway analysis

check buttonFind out the enriched GO biological processes and KEGG pathways involved in transition from healthy to precancer to cancer
check button Figure of enriched GO biological processes.
TissueDisease StageEnriched GO biological Processes
ColorectumADGO analysis - Figure of enriched GO biological processes: Top 15 enriched GO BP terms are showed in the bar plot of each disease state in each tissue. Each row represents a significant GO biological process which is colored according to the -log10(p.adjust).
ColorectumSERGO analysis - Figure of enriched GO biological processes: Top 15 enriched GO BP terms are showed in the bar plot of each disease state in each tissue. Each row represents a significant GO biological process which is colored according to the -log10(p.adjust).
ColorectumMSSGO analysis - Figure of enriched GO biological processes: Top 15 enriched GO BP terms are showed in the bar plot of each disease state in each tissue. Each row represents a significant GO biological process which is colored according to the -log10(p.adjust).
ColorectumMSI-HGO analysis - Figure of enriched GO biological processes: Top 15 enriched GO BP terms are showed in the bar plot of each disease state in each tissue. Each row represents a significant GO biological process which is colored according to the -log10(p.adjust).
ColorectumFAPGO analysis - Figure of enriched GO biological processes: Top 15 enriched GO BP terms are showed in the bar plot of each disease state in each tissue. Each row represents a significant GO biological process which is colored according to the -log10(p.adjust).
∗Top 15 enriched GO BP terms are showed in the bar plot of each disease state in each tissue. Each row represents a significant GO biological process which is colored according to the -log10(p.adjust).
Page: 1 2 3 4 5 6 7 8 9 

check button Enriched GO biological processes.
GO IDTissueDisease StageDescriptionGene RatioBg Ratiopvaluep.adjustCount
GO:004477216EsophagusESCCmitotic cell cycle phase transition281/8552424/187234.63e-184.45e-16281
GO:000734615EsophagusESCCregulation of mitotic cell cycle293/8552457/187238.00e-165.64e-14293
GO:190198713EsophagusESCCregulation of cell cycle phase transition242/8552390/187233.86e-111.26e-09242
GO:0016049110EsophagusESCCcell growth289/8552482/187231.29e-103.77e-09289
GO:190199013EsophagusESCCregulation of mitotic cell cycle phase transition191/8552299/187231.35e-103.94e-09191
GO:00457865EsophagusESCCnegative regulation of cell cycle236/8552385/187233.62e-109.93e-09236
GO:000155819EsophagusESCCregulation of cell growth248/8552414/187232.97e-096.45e-08248
GO:00448394EsophagusESCCcell cycle G2/M phase transition103/8552148/187233.09e-096.67e-08103
GO:00000864EsophagusESCCG2/M transition of mitotic cell cycle96/8552137/187236.00e-091.23e-0796
GO:00109484EsophagusESCCnegative regulation of cell cycle process177/8552294/187233.26e-074.59e-06177
GO:000008214EsophagusESCCG1/S transition of mitotic cell cycle134/8552214/187234.04e-075.55e-06134
GO:004484314EsophagusESCCcell cycle G1/S phase transition148/8552241/187235.68e-077.48e-06148
GO:19019883EsophagusESCCnegative regulation of cell cycle phase transition151/8552249/187231.28e-061.57e-05151
GO:004593013EsophagusESCCnegative regulation of mitotic cell cycle143/8552235/187231.84e-062.15e-05143
GO:190199113EsophagusESCCnegative regulation of mitotic cell cycle phase transition112/8552179/187233.69e-064.03e-05112
GO:00459267EsophagusESCCnegative regulation of growth148/8552249/187237.88e-067.73e-05148
GO:00103891EsophagusESCCregulation of G2/M transition of mitotic cell cycle64/855294/187239.21e-068.82e-0564
GO:19027491EsophagusESCCregulation of cell cycle G2/M phase transition68/8552102/187231.48e-051.33e-0468
GO:00109721EsophagusESCCnegative regulation of G2/M transition of mitotic cell cycle41/855260/187233.25e-041.91e-0341
GO:19027501EsophagusESCCnegative regulation of cell cycle G2/M phase transition42/855262/187233.69e-042.14e-0342
Page: 1 2 3 4 5 6 7 8 9 

check button Enriched KEGG pathways.
Pathway IDTissueDisease StageDescriptionGene RatioBg Ratiopvaluep.adjustqvalueCount
hsa04630Oral cavityEOLPJAK-STAT signaling pathway35/1218166/84651.15e-023.07e-021.81e-0235
hsa046301Oral cavityEOLPJAK-STAT signaling pathway35/1218166/84651.15e-023.07e-021.81e-0235
Page: 1 

Top

Cell-cell communication analysis

check buttonIdentification of potential cell-cell interactions between two cell types and their ligand-receptor pairs for different disease states
LigandReceptorLRpairPathwayTissueDisease Stage
Page: 1 

Top

Single-cell gene regulatory network inference analysis

check buttonFind out the significant the regulons (TFs) and the target genes of each regulon across cell types for different disease states
TFCell TypeTissueDisease StageTarget GeneRSSRegulon Activity
∗The dot plots of a searched regulon are shown for all cell subpopulations in each disease state of each tissue based on the regulon specific score inferred using pySCENIC and by calculating the average expression.
Page: 1 

Top

Somatic mutation of malignant transformation related genes

check buttonAnnotation of somatic variants for genes involved in malignant transformation
Hugo SymbolVariant ClassVariant ClassificationdbSNP RSHGVScHGVSpHGVSp ShortSWISSPROTBIOTYPESIFTPolyPhenTumor Sample BarcodeTissueHistologySexAgeStageTherapy TypesDrugsOutcome
FHL1SNVMissense_Mutationc.550G>Ap.Asp184Asnp.D184NQ13642protein_codingdeleterious(0)possibly_damaging(0.582)TCGA-A1-A0SE-01Breastbreast invasive carcinomaFemale<65I/IIUnknownUnknownSD
FHL1SNVMissense_Mutationc.769N>Tp.Leu257Phep.L257FQ13642protein_codingdeleterious(0)possibly_damaging(0.771)TCGA-A8-A092-01Breastbreast invasive carcinomaFemale<65III/IVChemotherapypaclitaxelCR
FHL1SNVMissense_Mutationrs199818971c.797N>Ap.Arg266Glnp.R266QQ13642protein_codingdeleterious_low_confidence(0.01)possibly_damaging(0.49)TCGA-EK-A2RO-01Cervixcervical & endocervical cancerFemale<65I/IIUnknownUnknownSD
FHL1SNVMissense_Mutationnovelc.36N>Ap.Asp12Glup.D12EQ13642protein_codingtolerated(1)benign(0.047)TCGA-VS-A953-01Cervixcervical & endocervical cancerFemale<65I/IIUnknownUnknownPD
FHL1SNVMissense_Mutationc.293N>Tp.Ser98Phep.S98FQ13642protein_codingdeleterious(0.03)benign(0.015)TCGA-VS-A9V0-01Cervixcervical & endocervical cancerFemale<65I/IIChemotherapycisplatinPD
FHL1SNVMissense_Mutationnovelc.199C>Tp.Arg67Cysp.R67CQ13642protein_codingdeleterious(0.01)probably_damaging(0.969)TCGA-AA-3950-01Colorectumcolon adenocarcinomaFemale>=65I/IIUnknownUnknownSD
FHL1SNVMissense_Mutationnovelc.796C>Tp.Arg266Trpp.R266WQ13642protein_codingdeleterious_low_confidence(0)probably_damaging(0.993)TCGA-A5-A0G1-01Endometriumuterine corpus endometrioid carcinomaFemale>=65I/IIUnknownUnknownSD
FHL1SNVMissense_Mutationnovelc.695N>Ap.Arg232Lysp.R232KQ13642protein_codingtolerated(0.26)benign(0)TCGA-A5-A0G2-01Endometriumuterine corpus endometrioid carcinomaFemale<65III/IVUnknownUnknownSD
FHL1SNVMissense_Mutationnovelc.761N>Ap.Arg254Hisp.R254HQ13642protein_codingdeleterious(0.02)possibly_damaging(0.715)TCGA-AJ-A3OJ-01Endometriumuterine corpus endometrioid carcinomaFemale<65I/IIChemotherapycarboplatinCR
FHL1SNVMissense_Mutationrs763012291c.467N>Tp.Thr156Ilep.T156IQ13642protein_codingdeleterious(0.04)benign(0.038)TCGA-AP-A059-01Endometriumuterine corpus endometrioid carcinomaFemale>=65I/IIUnknownUnknownSD
Page: 1 2 3 4 5 

Top

Related drugs of malignant transformation related genes

check buttonIdentification of chemicals and drugs interact with genes involved in malignant transfromation
(DGIdb 4.0)
Entrez IDSymbolCategoryInteraction TypesDrug Claim NameDrug NamePMIDs
Page: 1