
|
|||||
|
 | |
| |
| |
| |
| |
| |
|
Gene: FHIT |
Gene summary for FHIT |
| Gene information | Species | Human | Gene symbol | FHIT | Gene ID | 2272 |
| Gene name | fragile histidine triad diadenosine triphosphatase | |
| Gene Alias | AP3Aase | |
| Cytomap | 3p14.2 | |
| Gene Type | protein-coding | GO ID | GO:0006139 | UniProtAcc | A0A024R366 |
Top |
Malignant transformation analysis |
| Identification of the aberrant gene expression in precancerous and cancerous lesions by comparing the gene expression of stem-like cells in diseased tissues with normal stem cells |
| Entrez ID | Symbol | Replicates | Species | Organ | Tissue | Adj P-value | Log2FC | Malignancy |
| 2272 | FHIT | CCI_3 | Human | Cervix | CC | 5.31e-05 | 5.47e-01 | 0.516 |
| 2272 | FHIT | sample3 | Human | Cervix | CC | 3.40e-02 | -8.43e-02 | 0.1387 |
| 2272 | FHIT | HTA11_3410_2000001011 | Human | Colorectum | AD | 3.19e-03 | -3.76e-01 | 0.0155 |
| 2272 | FHIT | HTA11_2487_2000001011 | Human | Colorectum | SER | 1.31e-07 | -6.11e-01 | -0.1808 |
| 2272 | FHIT | HTA11_2951_2000001011 | Human | Colorectum | AD | 5.30e-04 | -5.91e-01 | 0.0216 |
| 2272 | FHIT | HTA11_347_2000001011 | Human | Colorectum | AD | 9.01e-09 | 5.16e-01 | -0.1954 |
| 2272 | FHIT | HTA11_3361_2000001011 | Human | Colorectum | AD | 1.26e-21 | -7.70e-01 | -0.1207 |
| 2272 | FHIT | HTA11_696_2000001011 | Human | Colorectum | AD | 9.12e-07 | -3.90e-01 | -0.1464 |
| 2272 | FHIT | HTA11_1391_2000001011 | Human | Colorectum | AD | 1.21e-02 | 2.79e-01 | -0.059 |
| 2272 | FHIT | HTA11_5212_2000001011 | Human | Colorectum | AD | 1.90e-07 | -8.57e-01 | -0.2061 |
| 2272 | FHIT | HTA11_866_3004761011 | Human | Colorectum | AD | 3.66e-02 | -3.98e-01 | 0.096 |
| 2272 | FHIT | HTA11_9408_2000001011 | Human | Colorectum | AD | 1.80e-06 | -8.57e-01 | 0.0451 |
| 2272 | FHIT | HTA11_8622_2000001021 | Human | Colorectum | SER | 1.14e-11 | -8.09e-01 | 0.0528 |
| 2272 | FHIT | HTA11_7469_2000001011 | Human | Colorectum | AD | 6.80e-06 | -7.29e-01 | -0.0124 |
| 2272 | FHIT | HTA11_11156_2000001011 | Human | Colorectum | AD | 5.56e-05 | -8.08e-01 | 0.0397 |
| 2272 | FHIT | HTA11_99999965062_69753 | Human | Colorectum | MSI-H | 6.74e-08 | 6.79e-01 | 0.3487 |
| 2272 | FHIT | HTA11_99999965104_69814 | Human | Colorectum | MSS | 8.54e-22 | 1.29e+00 | 0.281 |
| 2272 | FHIT | HTA11_99999971662_82457 | Human | Colorectum | MSS | 6.40e-06 | -1.69e-01 | 0.3859 |
| 2272 | FHIT | HTA11_99999973899_84307 | Human | Colorectum | MSS | 4.74e-20 | -9.76e-01 | 0.2585 |
| 2272 | FHIT | HTA11_99999974143_84620 | Human | Colorectum | MSS | 4.56e-17 | -5.68e-01 | 0.3005 |
| Page: 1 2 3 4 5 6 7 8 9 |
| Tissue | Expression Dynamics | Abbreviation |
| Cervix | 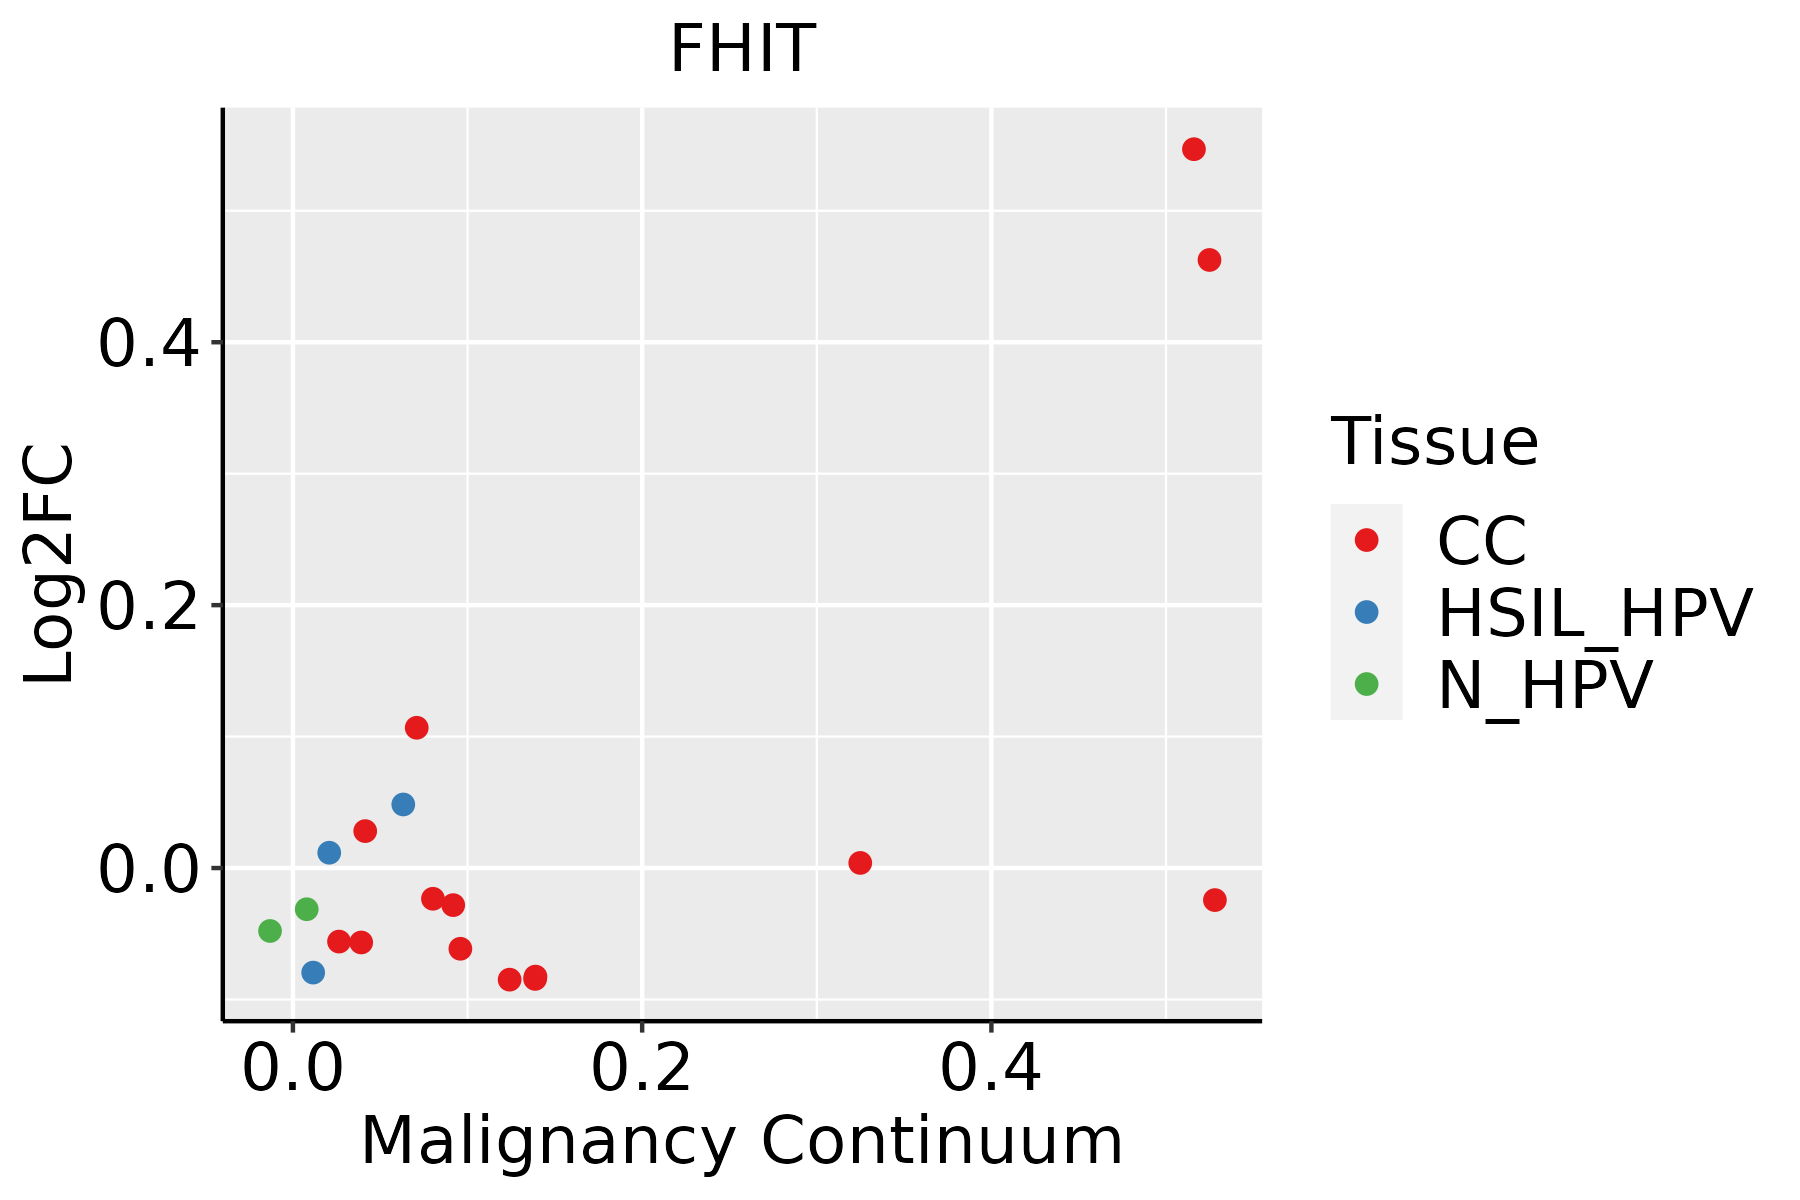 | CC: Cervix cancer |
| HSIL_HPV: HPV-infected high-grade squamous intraepithelial lesions | ||
| N_HPV: HPV-infected normal cervix | ||
| Colorectum (GSE201348) |  | FAP: Familial adenomatous polyposis |
| CRC: Colorectal cancer | ||
| Colorectum (HTA11) |  | AD: Adenomas |
| SER: Sessile serrated lesions | ||
| MSI-H: Microsatellite-high colorectal cancer | ||
| MSS: Microsatellite stable colorectal cancer | ||
| Endometrium |  | AEH: Atypical endometrial hyperplasia |
| EEC: Endometrioid Cancer | ||
| GC | 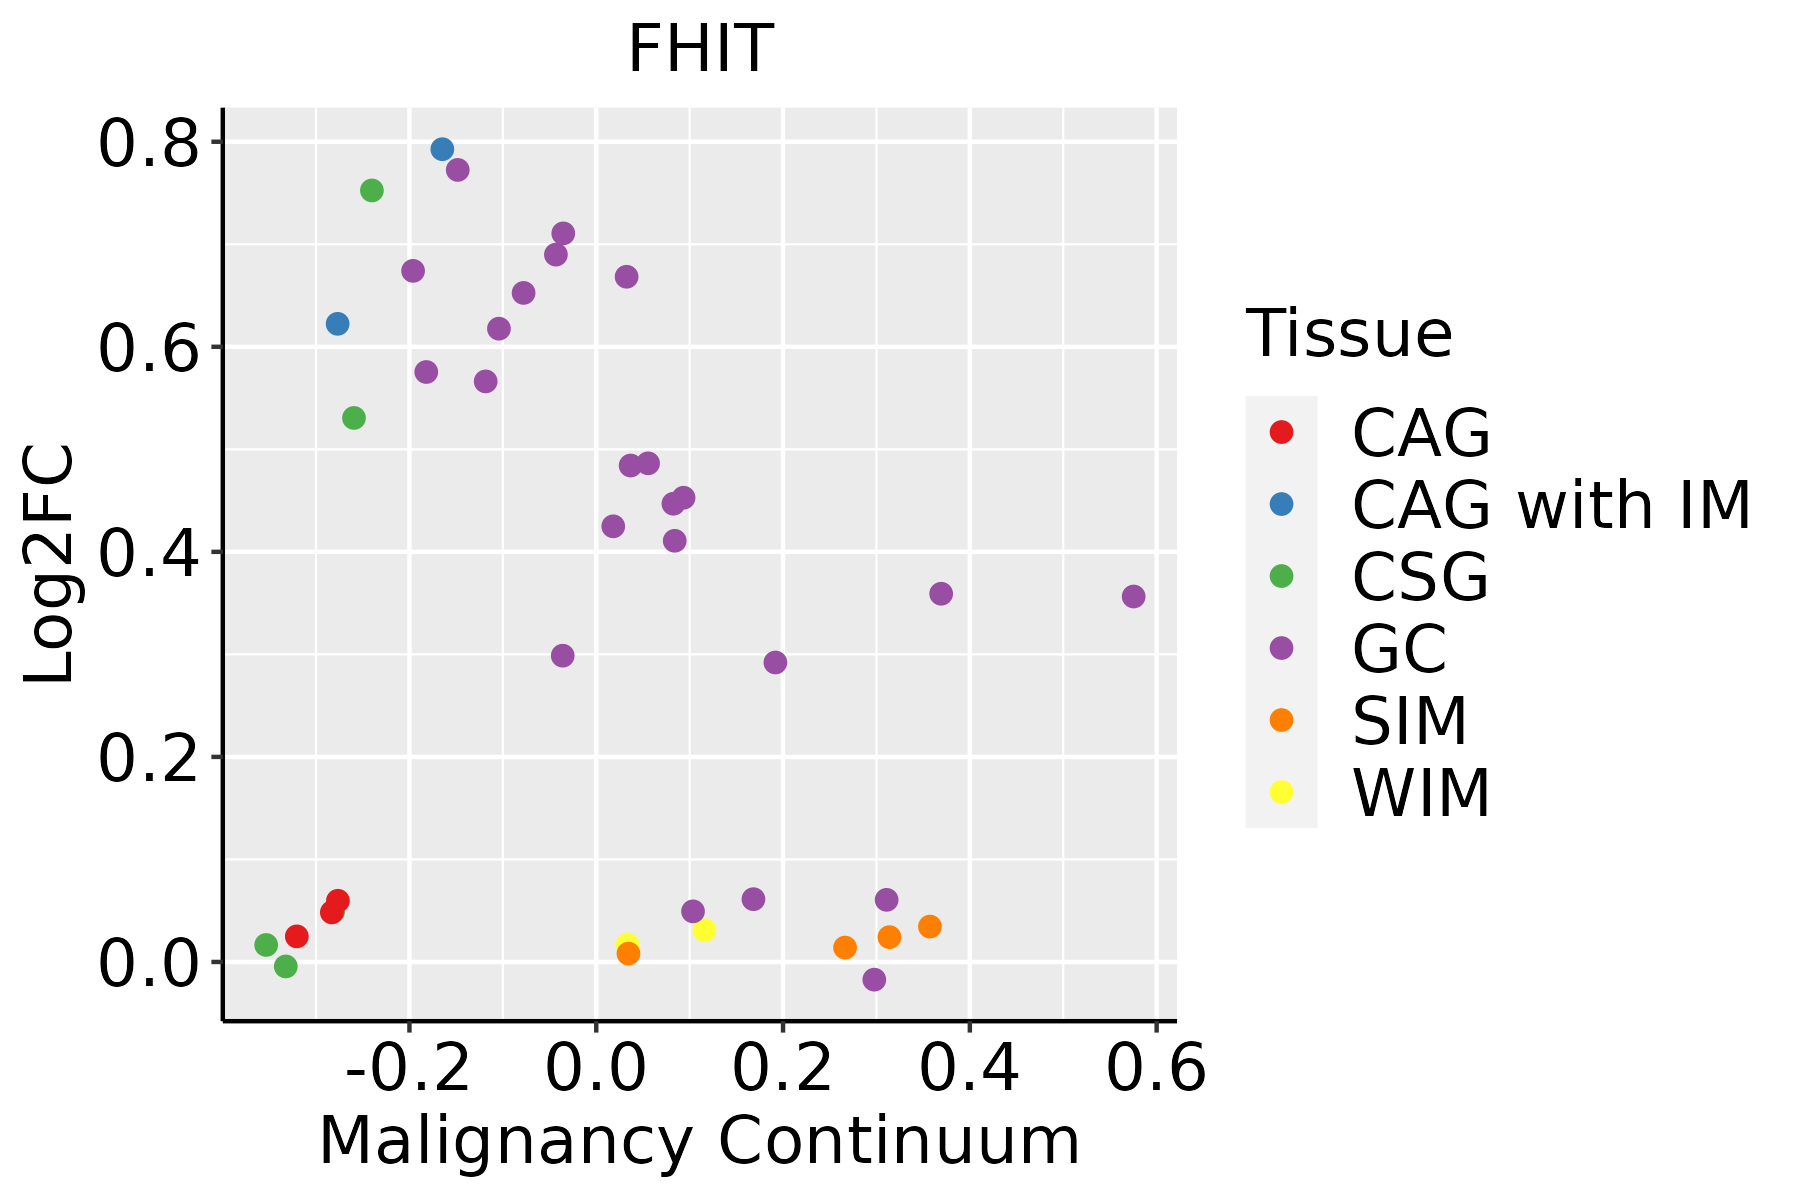 | CAG: Chronic atrophic gastritis |
| CAG with IM: Chronic atrophic gastritis with intestinal metaplasia | ||
| CSG: Chronic superficial gastritis | ||
| GC: Gastric cancer | ||
| SIM: Severe intestinal metaplasia | ||
| WIM: Wild intestinal metaplasia | ||
| Liver | 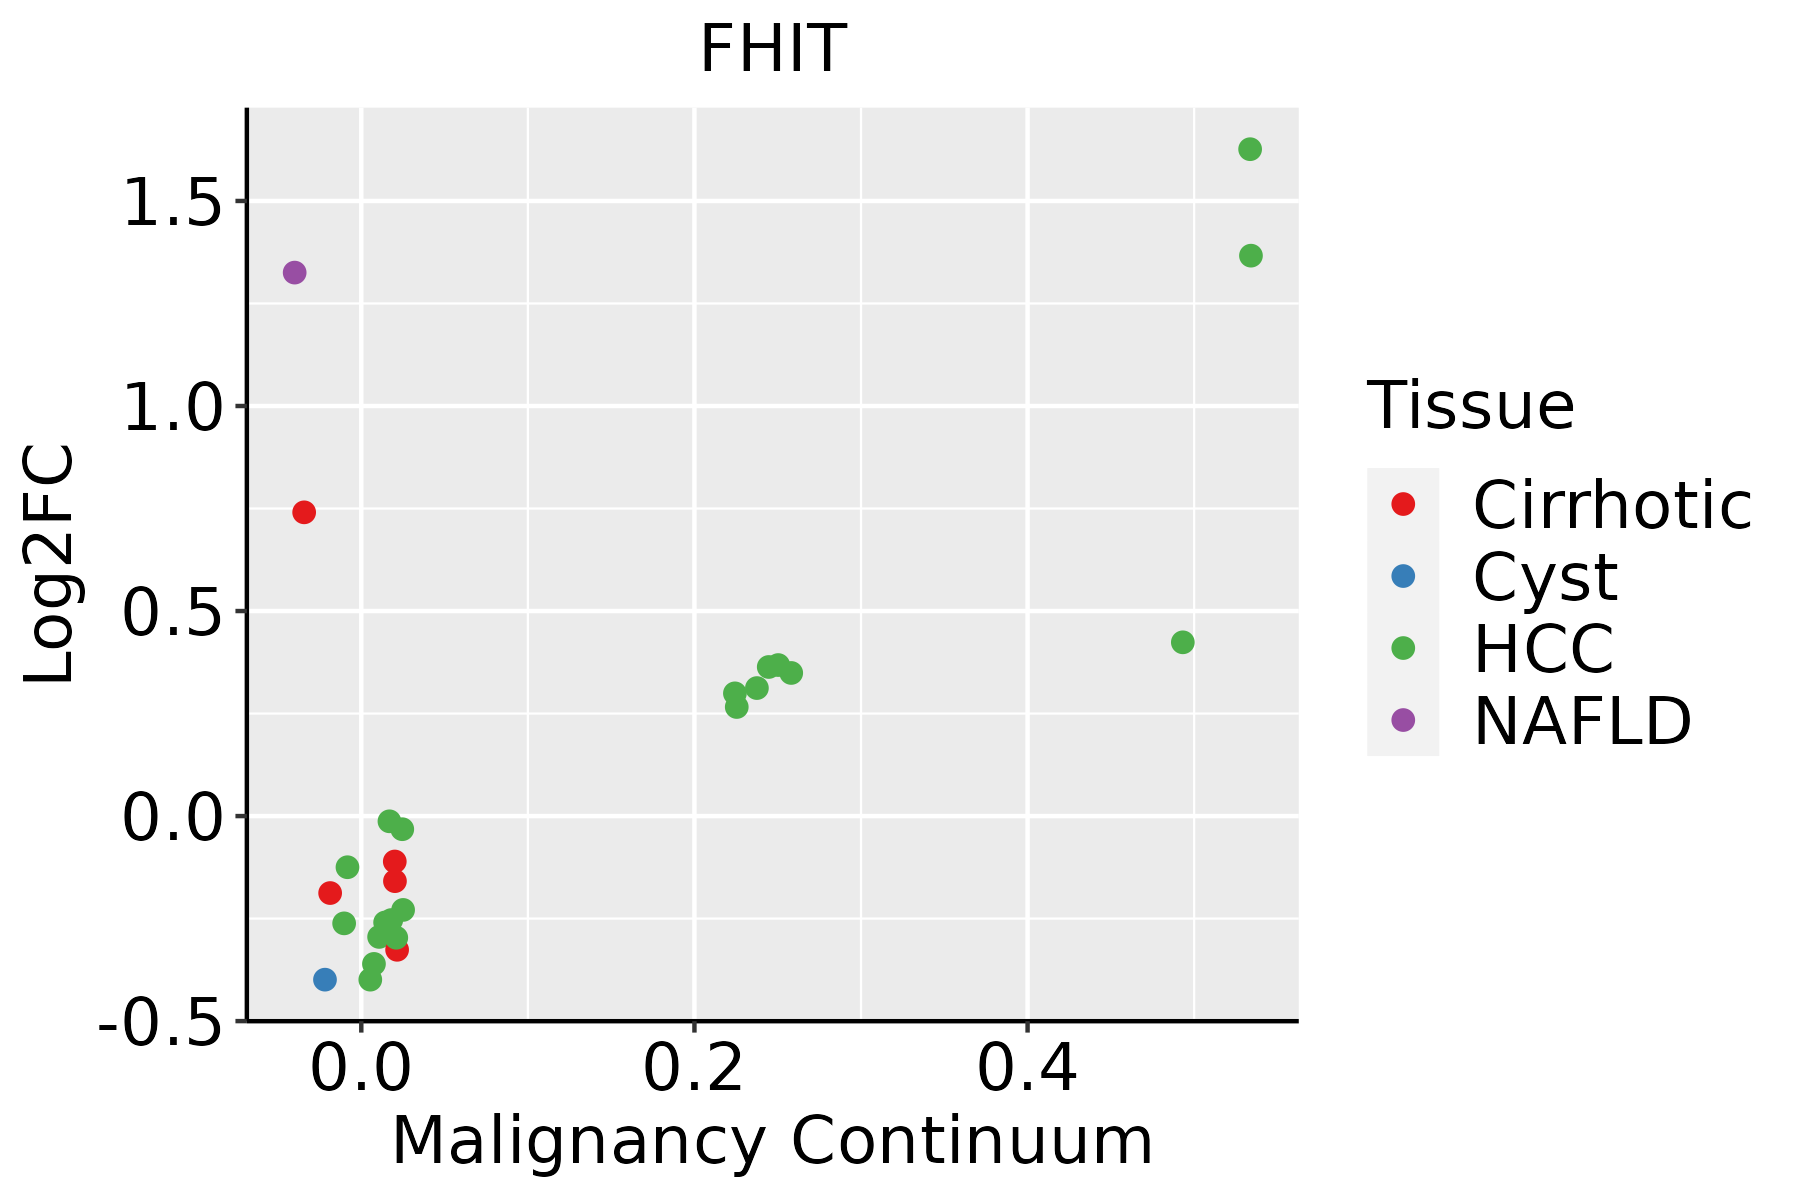 | HCC: Hepatocellular carcinoma |
| NAFLD: Non-alcoholic fatty liver disease | ||
| Lung | 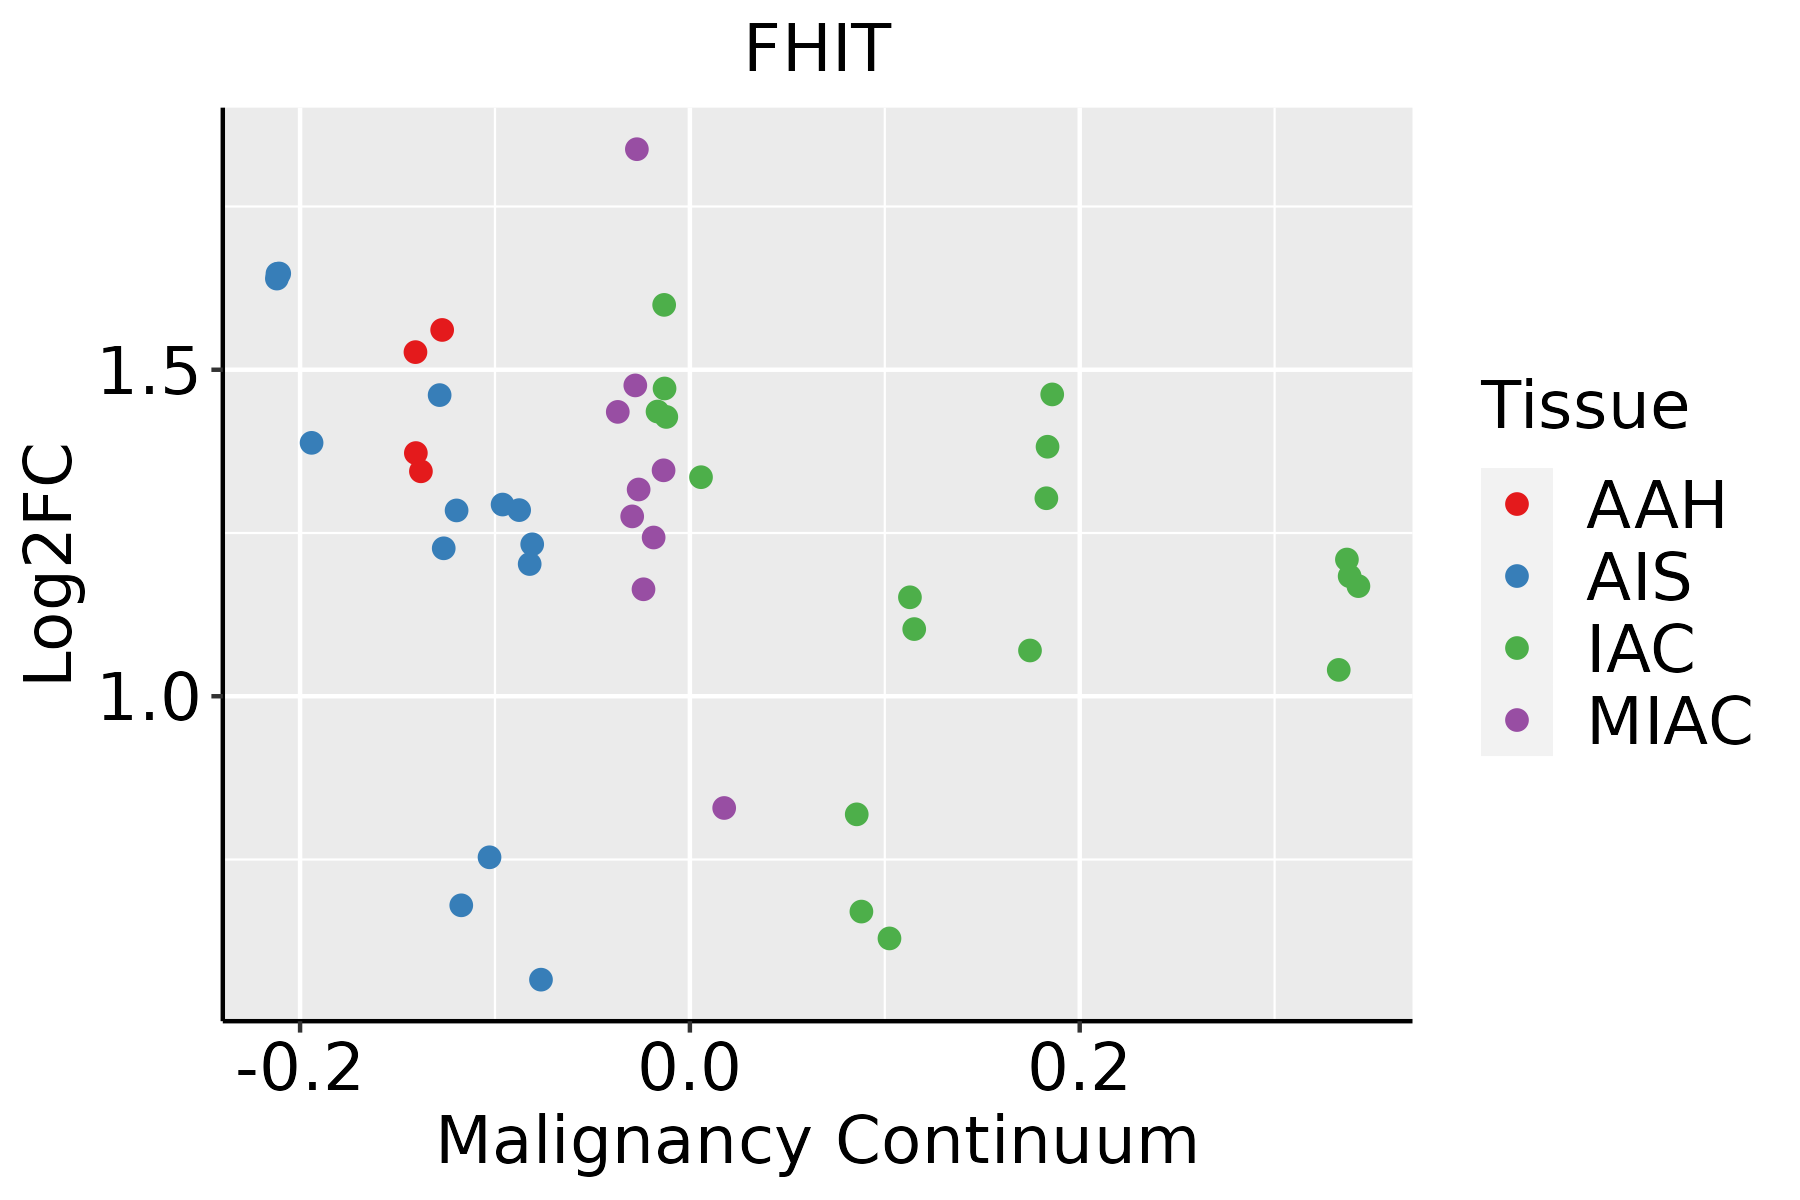 | AAH: Atypical adenomatous hyperplasia |
| AIS: Adenocarcinoma in situ | ||
| IAC: Invasive lung adenocarcinoma | ||
| MIA: Minimally invasive adenocarcinoma | ||
| Prostate | 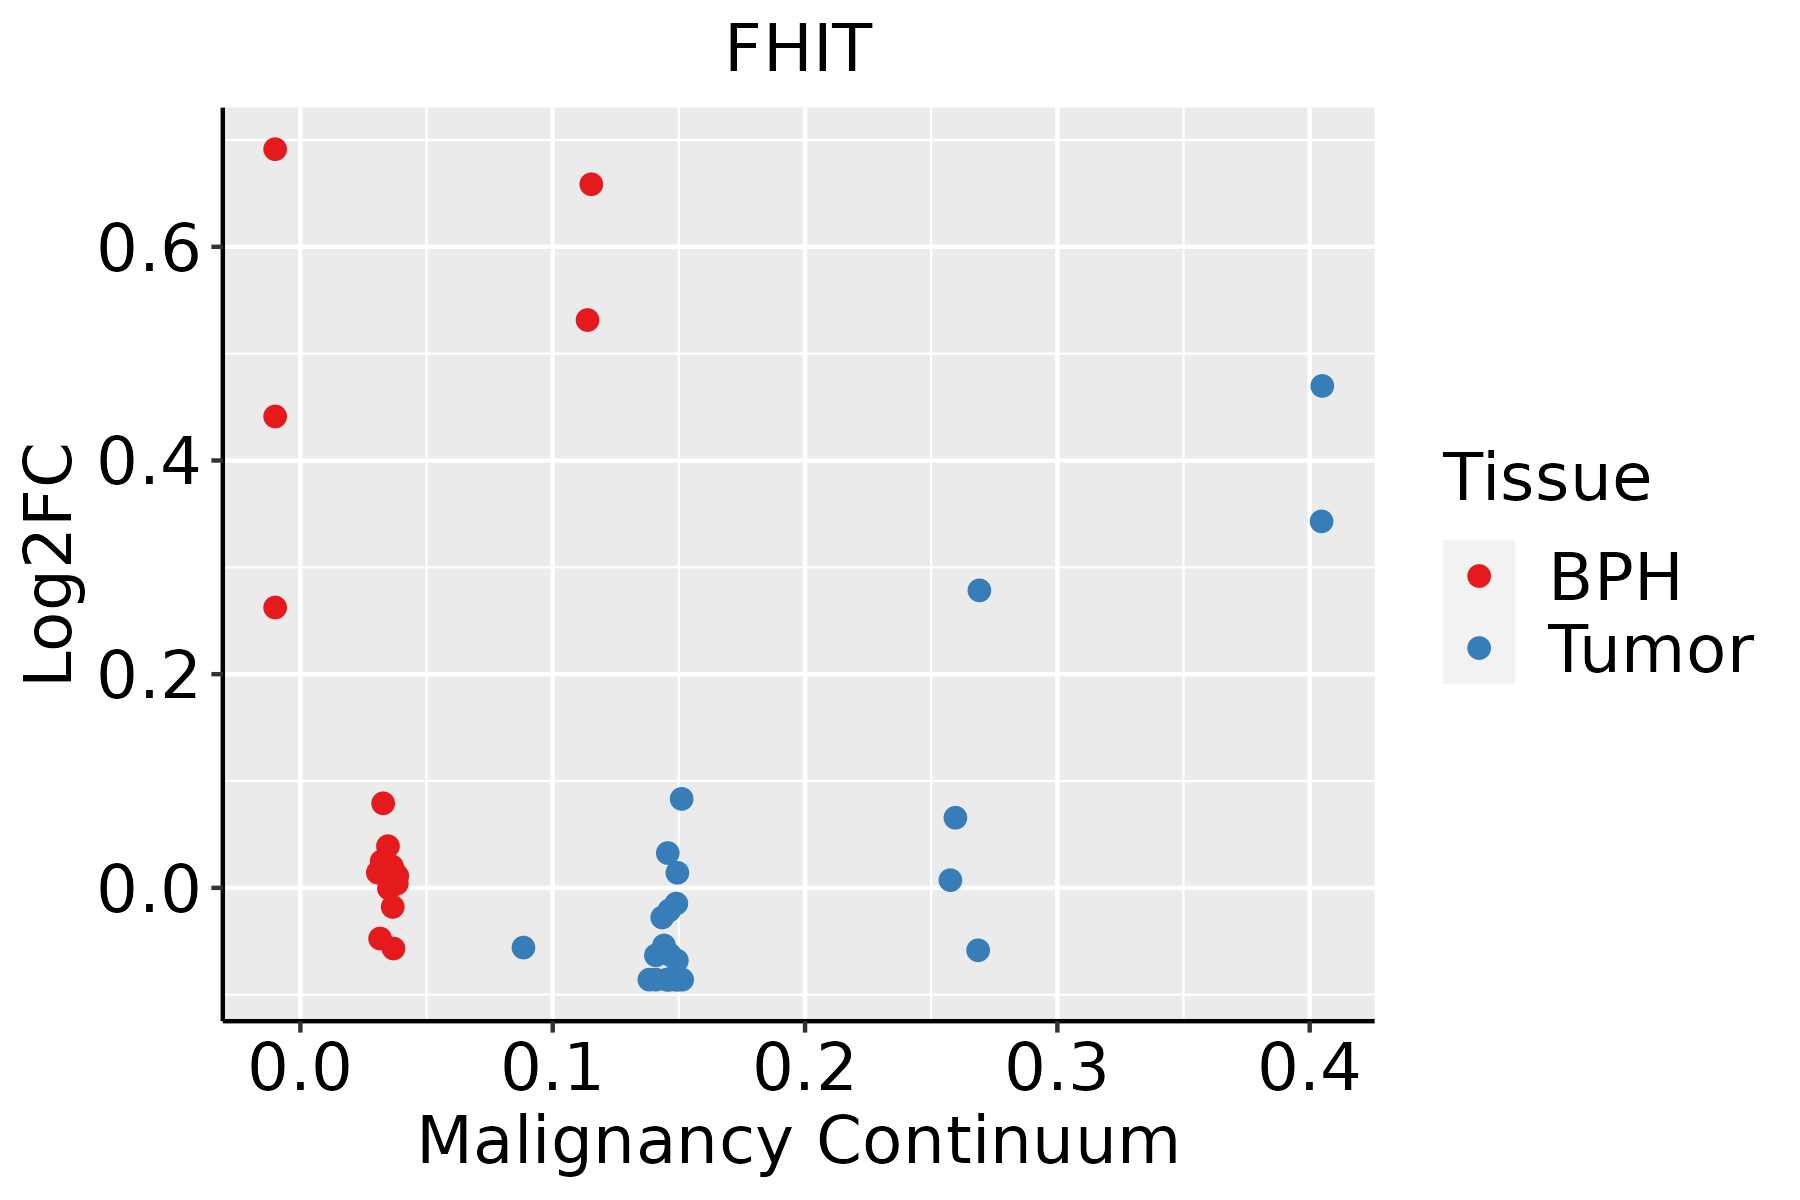 | BPH: Benign Prostatic Hyperplasia |
| Skin |  | AK: Actinic keratosis |
| cSCC: Cutaneous squamous cell carcinoma | ||
| SCCIS:squamous cell carcinoma in situ |
| ∗log2FC in expression of this searched gene in stem-like cells from each diseased tissue sample relative to stem-like cells in normal samples in each tissue plotted against the malignancy continuum. Samples are colored based on if they are from different disease stage. |
Top |
Malignant transformation related pathway analysis |
| Find out the enriched GO biological processes and KEGG pathways involved in transition from healthy to precancer to cancer |
| Tissue | Disease Stage | Enriched GO biological Processes |
| Colorectum | AD |  |
| Colorectum | SER |  |
| Colorectum | MSS |  |
| Colorectum | MSI-H |  |
| Colorectum | FAP |  |
| ∗Top 15 enriched GO BP terms are showed in the bar plot of each disease state in each tissue. Each row represents a significant GO biological process which is colored according to the -log10(p.adjust). |
| Page: 1 2 3 4 5 6 7 8 9 |
| GO ID | Tissue | Disease Stage | Description | Gene Ratio | Bg Ratio | pvalue | p.adjust | Count |
| GO:009719310 | Cervix | CC | intrinsic apoptotic signaling pathway | 85/2311 | 288/18723 | 4.56e-15 | 6.46e-12 | 85 |
| GO:004217610 | Cervix | CC | regulation of protein catabolic process | 104/2311 | 391/18723 | 9.39e-15 | 9.36e-12 | 104 |
| GO:190336210 | Cervix | CC | regulation of cellular protein catabolic process | 72/2311 | 255/18723 | 5.98e-12 | 2.10e-09 | 72 |
| GO:001049810 | Cervix | CC | proteasomal protein catabolic process | 111/2311 | 490/18723 | 8.98e-11 | 1.58e-08 | 111 |
| GO:190305010 | Cervix | CC | regulation of proteolysis involved in cellular protein catabolic process | 60/2311 | 221/18723 | 1.82e-09 | 1.98e-07 | 60 |
| GO:200005810 | Cervix | CC | regulation of ubiquitin-dependent protein catabolic process | 47/2311 | 164/18723 | 1.63e-08 | 1.25e-06 | 47 |
| GO:004316110 | Cervix | CC | proteasome-mediated ubiquitin-dependent protein catabolic process | 91/2311 | 412/18723 | 1.65e-08 | 1.25e-06 | 91 |
| GO:004586110 | Cervix | CC | negative regulation of proteolysis | 80/2311 | 351/18723 | 2.88e-08 | 1.98e-06 | 80 |
| GO:003133010 | Cervix | CC | negative regulation of cellular catabolic process | 63/2311 | 262/18723 | 1.10e-07 | 5.68e-06 | 63 |
| GO:006113610 | Cervix | CC | regulation of proteasomal protein catabolic process | 48/2311 | 187/18723 | 4.63e-07 | 1.77e-05 | 48 |
| GO:003243410 | Cervix | CC | regulation of proteasomal ubiquitin-dependent protein catabolic process | 38/2311 | 134/18723 | 4.99e-07 | 1.88e-05 | 38 |
| GO:000989510 | Cervix | CC | negative regulation of catabolic process | 69/2311 | 320/18723 | 2.15e-06 | 6.55e-05 | 69 |
| GO:19033639 | Cervix | CC | negative regulation of cellular protein catabolic process | 24/2311 | 75/18723 | 6.43e-06 | 1.55e-04 | 24 |
| GO:00723329 | Cervix | CC | intrinsic apoptotic signaling pathway by p53 class mediator | 23/2311 | 76/18723 | 2.76e-05 | 4.60e-04 | 23 |
| GO:19030519 | Cervix | CC | negative regulation of proteolysis involved in cellular protein catabolic process | 20/2311 | 64/18723 | 5.44e-05 | 8.04e-04 | 20 |
| GO:007233110 | Cervix | CC | signal transduction by p53 class mediator | 38/2311 | 163/18723 | 7.06e-05 | 9.85e-04 | 38 |
| GO:004217710 | Cervix | CC | negative regulation of protein catabolic process | 30/2311 | 121/18723 | 1.23e-04 | 1.53e-03 | 30 |
| GO:200005910 | Cervix | CC | negative regulation of ubiquitin-dependent protein catabolic process | 16/2311 | 48/18723 | 1.27e-04 | 1.58e-03 | 16 |
| GO:00467008 | Cervix | CC | heterocycle catabolic process | 80/2311 | 445/18723 | 3.23e-04 | 3.42e-03 | 80 |
| GO:00346559 | Cervix | CC | nucleobase-containing compound catabolic process | 74/2311 | 407/18723 | 3.77e-04 | 3.88e-03 | 74 |
| Page: 1 2 3 4 5 6 7 8 9 10 11 12 13 14 15 16 17 18 19 20 21 22 23 24 25 26 27 28 29 30 31 |
| Pathway ID | Tissue | Disease Stage | Description | Gene Ratio | Bg Ratio | pvalue | p.adjust | qvalue | Count |
| hsa052226 | Cervix | CC | Small cell lung cancer | 29/1267 | 92/8465 | 4.38e-05 | 3.09e-04 | 1.83e-04 | 29 |
| hsa052234 | Cervix | CC | Non-small cell lung cancer | 21/1267 | 72/8465 | 1.48e-03 | 6.32e-03 | 3.74e-03 | 21 |
| hsa0522213 | Cervix | CC | Small cell lung cancer | 29/1267 | 92/8465 | 4.38e-05 | 3.09e-04 | 1.83e-04 | 29 |
| hsa0522313 | Cervix | CC | Non-small cell lung cancer | 21/1267 | 72/8465 | 1.48e-03 | 6.32e-03 | 3.74e-03 | 21 |
| hsa05222 | Colorectum | MSS | Small cell lung cancer | 30/1875 | 92/8465 | 1.31e-02 | 4.30e-02 | 2.64e-02 | 30 |
| hsa052221 | Colorectum | MSS | Small cell lung cancer | 30/1875 | 92/8465 | 1.31e-02 | 4.30e-02 | 2.64e-02 | 30 |
| hsa05223 | Colorectum | FAP | Non-small cell lung cancer | 20/1404 | 72/8465 | 1.14e-02 | 3.92e-02 | 2.38e-02 | 20 |
| hsa052222 | Colorectum | FAP | Small cell lung cancer | 24/1404 | 92/8465 | 1.33e-02 | 4.46e-02 | 2.71e-02 | 24 |
| hsa052231 | Colorectum | FAP | Non-small cell lung cancer | 20/1404 | 72/8465 | 1.14e-02 | 3.92e-02 | 2.38e-02 | 20 |
| hsa052223 | Colorectum | FAP | Small cell lung cancer | 24/1404 | 92/8465 | 1.33e-02 | 4.46e-02 | 2.71e-02 | 24 |
| hsa052224 | Liver | HCC | Small cell lung cancer | 57/4020 | 92/8465 | 3.54e-03 | 1.12e-02 | 6.22e-03 | 57 |
| hsa052232 | Liver | HCC | Non-small cell lung cancer | 46/4020 | 72/8465 | 3.61e-03 | 1.12e-02 | 6.22e-03 | 46 |
| hsa0522211 | Liver | HCC | Small cell lung cancer | 57/4020 | 92/8465 | 3.54e-03 | 1.12e-02 | 6.22e-03 | 57 |
| hsa0522311 | Liver | HCC | Non-small cell lung cancer | 46/4020 | 72/8465 | 3.61e-03 | 1.12e-02 | 6.22e-03 | 46 |
| hsa052225 | Lung | IAC | Small cell lung cancer | 22/1053 | 92/8465 | 1.66e-03 | 9.66e-03 | 6.41e-03 | 22 |
| hsa0522212 | Lung | IAC | Small cell lung cancer | 22/1053 | 92/8465 | 1.66e-03 | 9.66e-03 | 6.41e-03 | 22 |
| hsa0522221 | Lung | AIS | Small cell lung cancer | 21/961 | 92/8465 | 1.23e-03 | 9.02e-03 | 5.77e-03 | 21 |
| hsa0522231 | Lung | AIS | Small cell lung cancer | 21/961 | 92/8465 | 1.23e-03 | 9.02e-03 | 5.77e-03 | 21 |
| hsa052227 | Prostate | BPH | Small cell lung cancer | 38/1718 | 92/8465 | 3.15e-06 | 2.74e-05 | 1.69e-05 | 38 |
| hsa052235 | Prostate | BPH | Non-small cell lung cancer | 25/1718 | 72/8465 | 2.98e-03 | 1.12e-02 | 6.92e-03 | 25 |
| Page: 1 2 |
Top |
Cell-cell communication analysis |
| Identification of potential cell-cell interactions between two cell types and their ligand-receptor pairs for different disease states |
| Ligand | Receptor | LRpair | Pathway | Tissue | Disease Stage |
| Page: 1 |
Top |
Single-cell gene regulatory network inference analysis |
| Find out the significant the regulons (TFs) and the target genes of each regulon across cell types for different disease states |
| TF | Cell Type | Tissue | Disease Stage | Target Gene | RSS | Regulon Activity |
| ∗The dot plots of a searched regulon are shown for all cell subpopulations in each disease state of each tissue based on the regulon specific score inferred using pySCENIC and by calculating the average expression. |
| Page: 1 |
Top |
Somatic mutation of malignant transformation related genes |
| Annotation of somatic variants for genes involved in malignant transformation |
| Hugo Symbol | Variant Class | Variant Classification | dbSNP RS | HGVSc | HGVSp | HGVSp Short | SWISSPROT | BIOTYPE | SIFT | PolyPhen | Tumor Sample Barcode | Tissue | Histology | Sex | Age | Stage | Therapy Types | Drugs | Outcome |
| FHIT | SNV | Missense_Mutation | c.191N>C | p.Arg64Thr | p.R64T | P49789 | protein_coding | tolerated(0.13) | benign(0.031) | TCGA-D8-A1JA-01 | Breast | breast invasive carcinoma | Female | <65 | III/IV | Chemotherapy | adriamycin | PD | |
| FHIT | SNV | Missense_Mutation | c.64N>C | p.Ser22Pro | p.S22P | P49789 | protein_coding | deleterious(0) | probably_damaging(0.966) | TCGA-E2-A15D-01 | Breast | breast invasive carcinoma | Female | <65 | I/II | Hormone Therapy | tamoxiphen | SD | |
| FHIT | SNV | Missense_Mutation | rs139666727 | c.289N>A | p.Val97Ile | p.V97I | P49789 | protein_coding | tolerated(0.81) | benign(0.011) | TCGA-AA-3875-01 | Colorectum | colon adenocarcinoma | Female | >=65 | I/II | Unknown | Unknown | SD |
| FHIT | SNV | Missense_Mutation | c.8T>A | p.Phe3Tyr | p.F3Y | P49789 | protein_coding | tolerated(1) | benign(0.003) | TCGA-CK-4951-01 | Colorectum | colon adenocarcinoma | Female | >=65 | I/II | Unknown | Unknown | PD | |
| FHIT | SNV | Missense_Mutation | rs747139143 | c.259N>A | p.Glu87Lys | p.E87K | P49789 | protein_coding | deleterious(0.02) | possibly_damaging(0.757) | TCGA-F5-6814-01 | Colorectum | rectum adenocarcinoma | Male | <65 | I/II | Unknown | Unknown | SD |
| FHIT | SNV | Missense_Mutation | rs372120945 | c.70G>A | p.Ala24Thr | p.A24T | P49789 | protein_coding | deleterious(0) | possibly_damaging(0.89) | TCGA-A5-A0GP-01 | Endometrium | uterine corpus endometrioid carcinoma | Female | <65 | I/II | Unknown | Unknown | SD |
| FHIT | SNV | Missense_Mutation | rs766467575 | c.124N>T | p.Arg42Trp | p.R42W | P49789 | protein_coding | deleterious(0) | probably_damaging(0.999) | TCGA-A5-A0VQ-01 | Endometrium | uterine corpus endometrioid carcinoma | Female | <65 | I/II | Chemotherapy | carboplatin | SD |
| FHIT | SNV | Missense_Mutation | rs148747004 | c.182N>T | p.Thr61Met | p.T61M | P49789 | protein_coding | deleterious(0.05) | possibly_damaging(0.846) | TCGA-AX-A1CE-01 | Endometrium | uterine corpus endometrioid carcinoma | Female | <65 | I/II | Unspecific | Paclitaxel | SD |
| FHIT | SNV | Missense_Mutation | rs371000765 | c.416N>T | p.Ala139Val | p.A139V | P49789 | protein_coding | deleterious(0) | possibly_damaging(0.908) | TCGA-BG-A0VW-01 | Endometrium | uterine corpus endometrioid carcinoma | Female | >=65 | I/II | Unknown | Unknown | SD |
| FHIT | SNV | Missense_Mutation | c.145N>T | p.Asp49Tyr | p.D49Y | P49789 | protein_coding | deleterious(0) | probably_damaging(0.939) | TCGA-BS-A0UV-01 | Endometrium | uterine corpus endometrioid carcinoma | Female | <65 | III/IV | Unknown | Unknown | SD |
| Page: 1 2 |
Top |
Related drugs of malignant transformation related genes |
| Identification of chemicals and drugs interact with genes involved in malignant transfromation |
| (DGIdb 4.0) |
| Entrez ID | Symbol | Category | Interaction Types | Drug Claim Name | Drug Name | PMIDs |
| 2272 | FHIT | CLINICALLY ACTIONABLE, ENZYME, TRANSPORTER | TRICHOSTATIN A | 17019711 | ||
| 2272 | FHIT | CLINICALLY ACTIONABLE, ENZYME, TRANSPORTER | interferon beta-1b | 27001119 | ||
| 2272 | FHIT | CLINICALLY ACTIONABLE, ENZYME, TRANSPORTER | antidepressants | |||
| 2272 | FHIT | CLINICALLY ACTIONABLE, ENZYME, TRANSPORTER | interferon beta-1a | 27001119 | ||
| 2272 | FHIT | CLINICALLY ACTIONABLE, ENZYME, TRANSPORTER | Fructose | FRUCTOSE |
| Page: 1 |

Copyright 2023-Present -The University of Texas Health Science Center at Houston |