
|
|||||
|
 | |
| |
| |
| |
| |
| |
|
Gene: FHAD1 |
Gene summary for FHAD1 |
| Gene information | Species | Human | Gene symbol | FHAD1 | Gene ID | 114827 |
| Gene name | forkhead associated phosphopeptide binding domain 1 | |
| Gene Alias | FHAD1 | |
| Cytomap | 1p36.21 | |
| Gene Type | protein-coding | GO ID | NA | UniProtAcc | B1AJZ9 |
Top |
Malignant transformation analysis |
| Identification of the aberrant gene expression in precancerous and cancerous lesions by comparing the gene expression of stem-like cells in diseased tissues with normal stem cells |
| Entrez ID | Symbol | Replicates | Species | Organ | Tissue | Adj P-value | Log2FC | Malignancy |
| 114827 | FHAD1 | LZE5T | Human | Esophagus | ESCC | 1.48e-05 | 3.36e-01 | 0.0514 |
| 114827 | FHAD1 | LZE24T | Human | Esophagus | ESCC | 1.09e-06 | 2.12e-01 | 0.0596 |
| 114827 | FHAD1 | P8T-E | Human | Esophagus | ESCC | 7.90e-03 | 8.54e-02 | 0.0889 |
| 114827 | FHAD1 | P62T-E | Human | Esophagus | ESCC | 8.84e-38 | 5.98e-01 | 0.1302 |
| 114827 | FHAD1 | P75T-E | Human | Esophagus | ESCC | 2.28e-35 | 6.41e-01 | 0.1125 |
| 114827 | FHAD1 | P128T-E | Human | Esophagus | ESCC | 4.43e-07 | 2.04e-01 | 0.1241 |
| 114827 | FHAD1 | P130T-E | Human | Esophagus | ESCC | 9.74e-22 | 5.71e-01 | 0.1676 |
| 114827 | FHAD1 | HCC1 | Human | Liver | HCC | 9.88e-03 | 8.90e-01 | 0.5336 |
| 114827 | FHAD1 | HCC2 | Human | Liver | HCC | 2.39e-03 | 4.70e-01 | 0.5341 |
| 114827 | FHAD1 | HCC5 | Human | Liver | HCC | 2.61e-04 | 5.81e-01 | 0.4932 |
| 114827 | FHAD1 | S014 | Human | Liver | HCC | 3.32e-05 | 2.49e-01 | 0.2254 |
| 114827 | FHAD1 | S016 | Human | Liver | HCC | 1.85e-06 | 2.35e-01 | 0.2243 |
| 114827 | FHAD1 | ATC12 | Human | Thyroid | ATC | 2.19e-05 | 1.44e-01 | 0.34 |
| 114827 | FHAD1 | ATC13 | Human | Thyroid | ATC | 1.96e-22 | 4.64e-01 | 0.34 |
| 114827 | FHAD1 | ATC2 | Human | Thyroid | ATC | 1.80e-12 | 9.87e-01 | 0.34 |
| 114827 | FHAD1 | ATC4 | Human | Thyroid | ATC | 4.56e-09 | 1.99e-01 | 0.34 |
| 114827 | FHAD1 | ATC5 | Human | Thyroid | ATC | 4.37e-21 | 5.14e-01 | 0.34 |
| Page: 1 |
| Tissue | Expression Dynamics | Abbreviation |
| Esophagus | 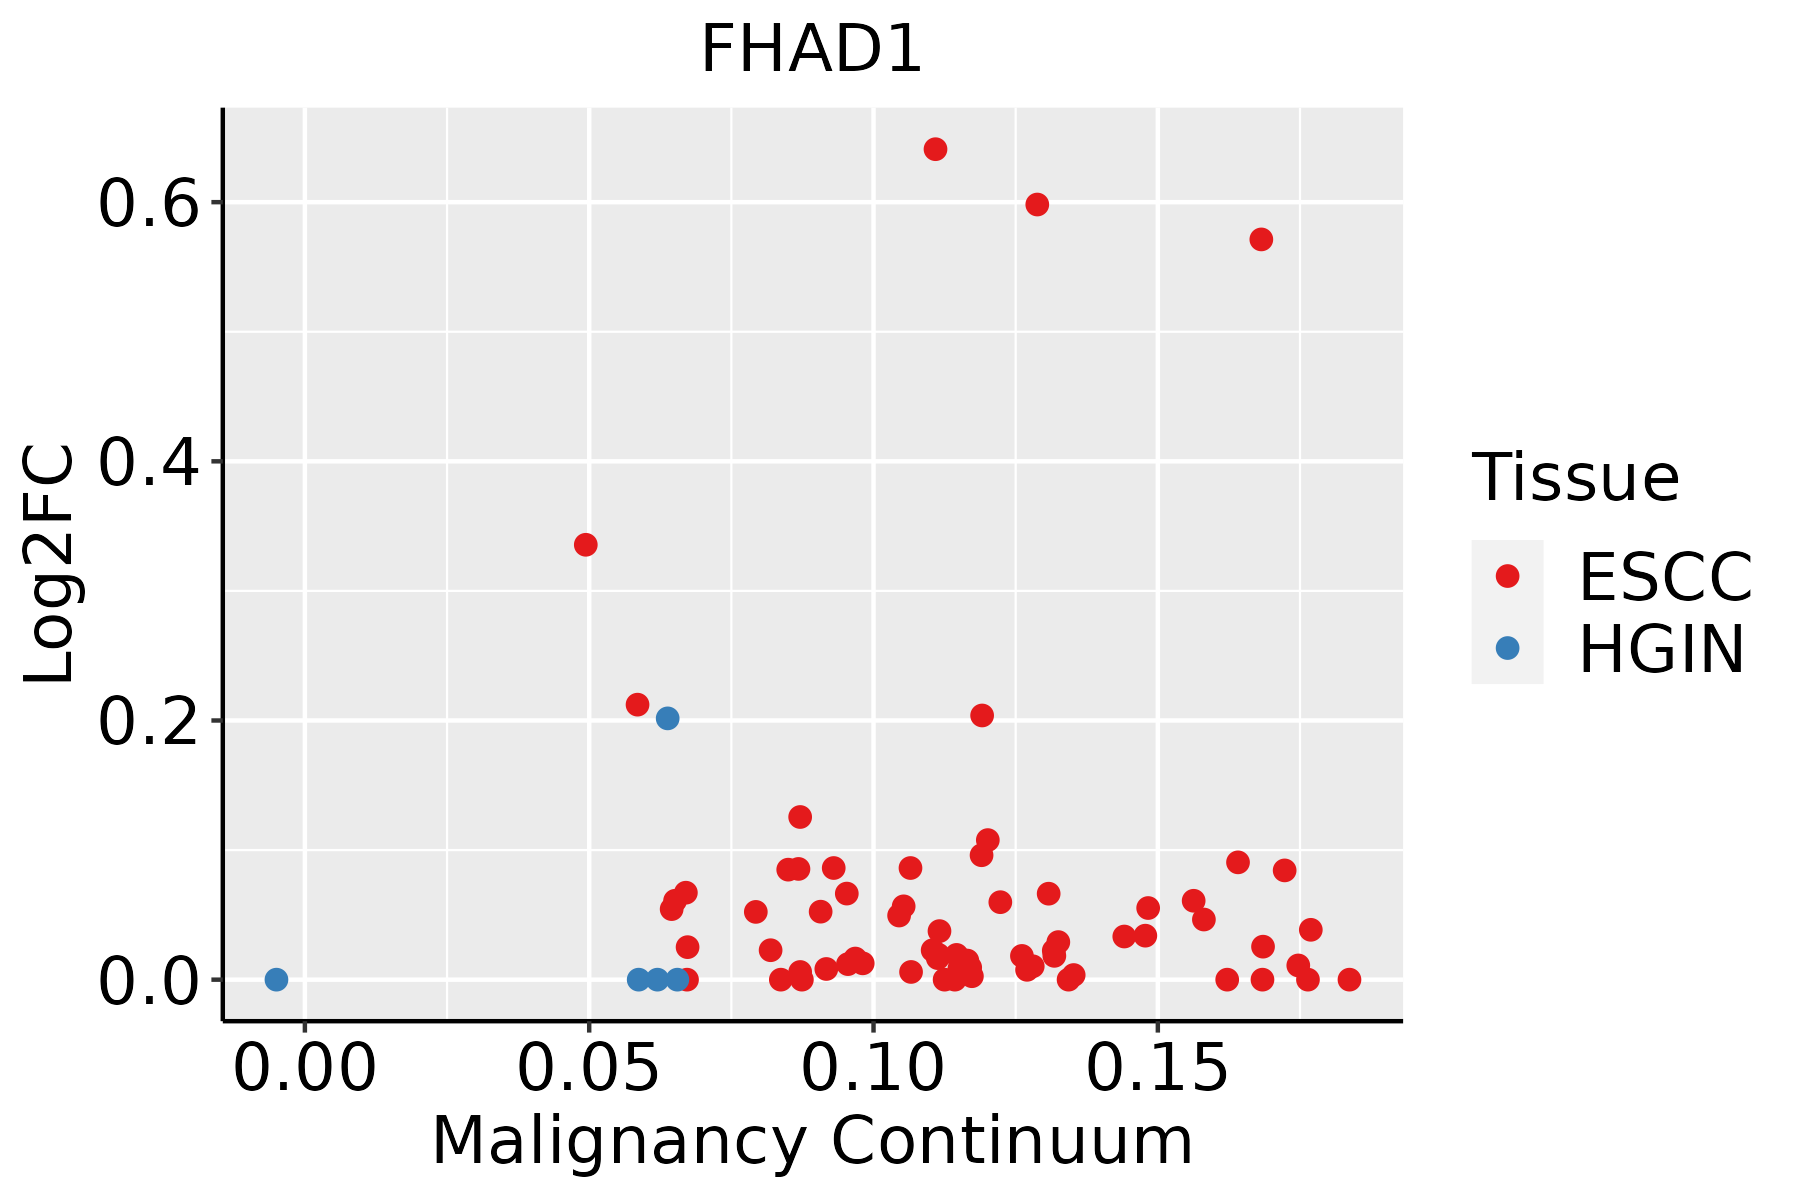 | ESCC: Esophageal squamous cell carcinoma |
| HGIN: High-grade intraepithelial neoplasias | ||
| LGIN: Low-grade intraepithelial neoplasias | ||
| Liver |  | HCC: Hepatocellular carcinoma |
| NAFLD: Non-alcoholic fatty liver disease | ||
| Thyroid | 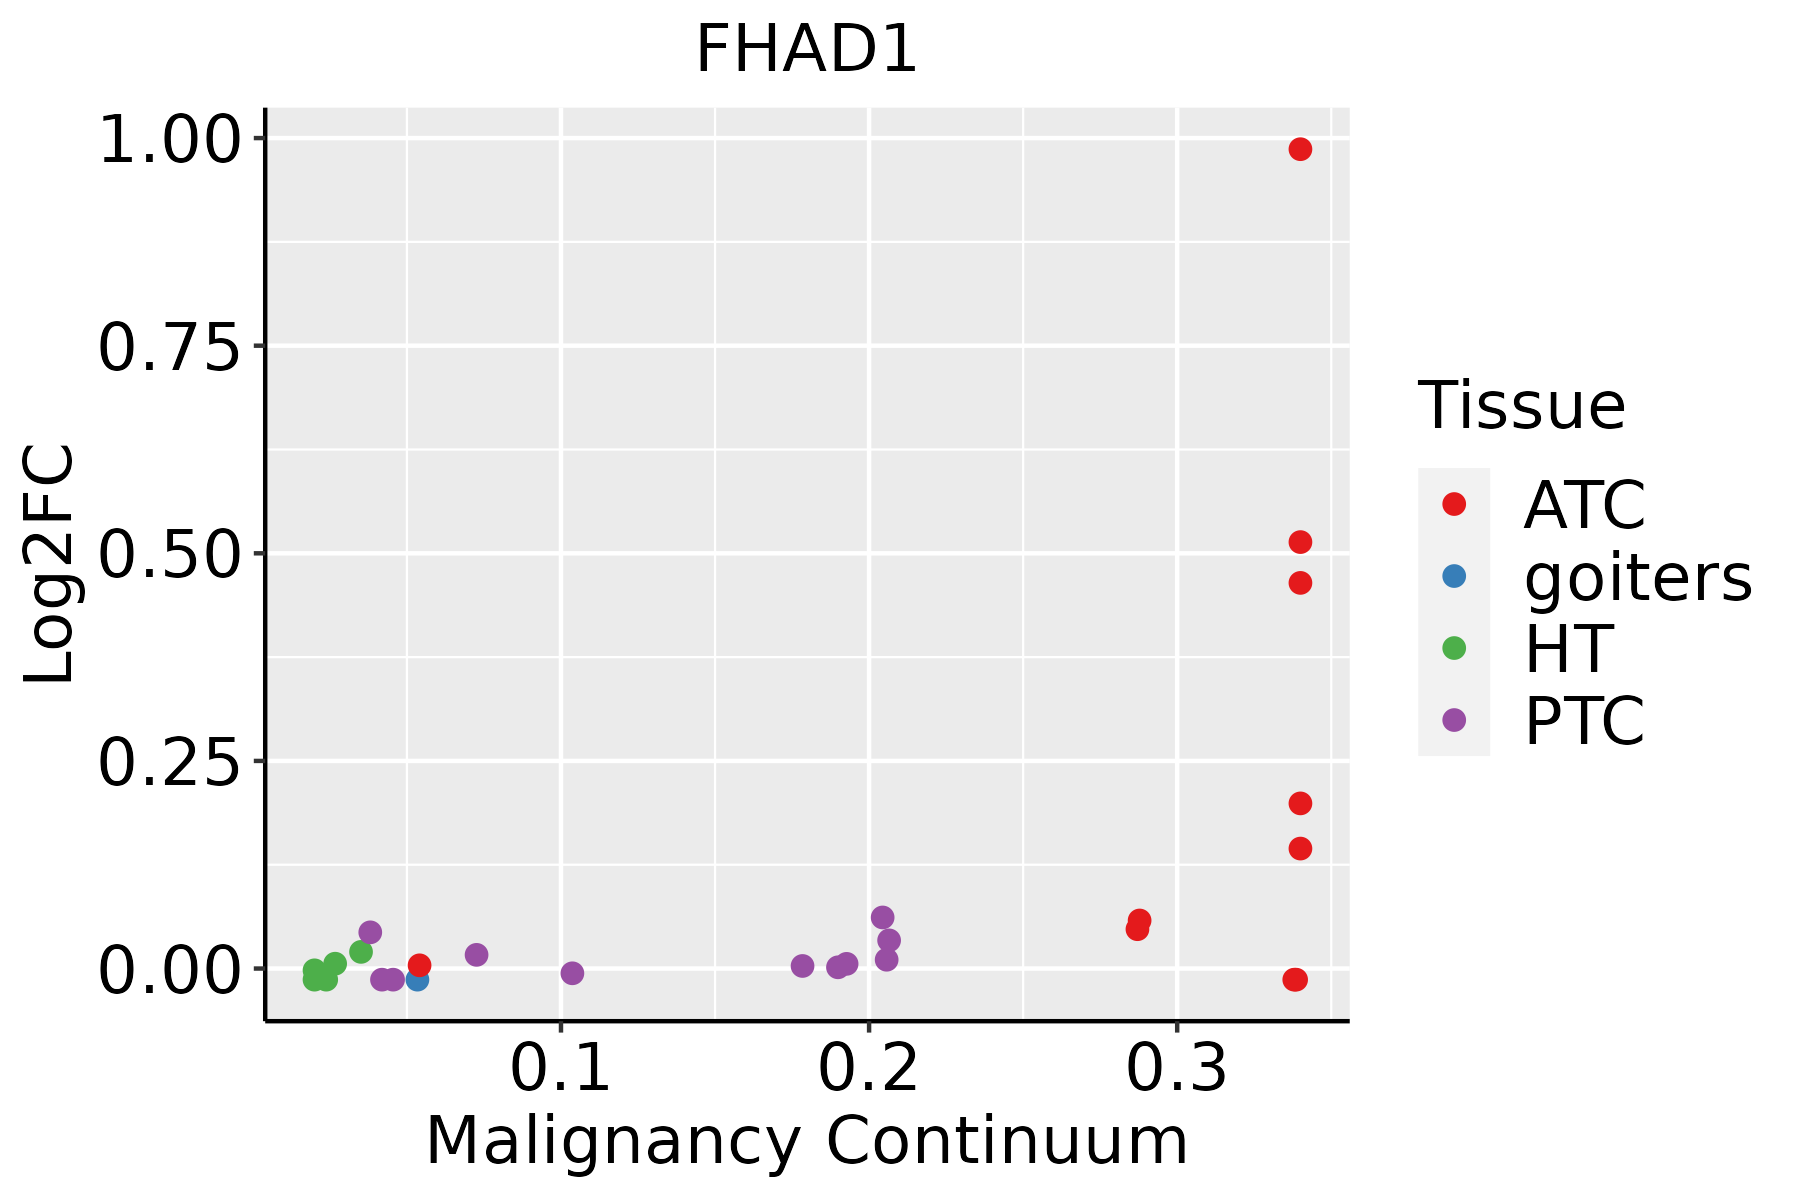 | ATC: Anaplastic thyroid cancer |
| HT: Hashimoto's thyroiditis | ||
| PTC: Papillary thyroid cancer |
| ∗log2FC in expression of this searched gene in stem-like cells from each diseased tissue sample relative to stem-like cells in normal samples in each tissue plotted against the malignancy continuum. Samples are colored based on if they are from different disease stage. |
Top |
Malignant transformation related pathway analysis |
| Find out the enriched GO biological processes and KEGG pathways involved in transition from healthy to precancer to cancer |
| Tissue | Disease Stage | Enriched GO biological Processes |
| Colorectum | AD |  |
| Colorectum | SER |  |
| Colorectum | MSS |  |
| Colorectum | MSI-H |  |
| Colorectum | FAP |  |
| ∗Top 15 enriched GO BP terms are showed in the bar plot of each disease state in each tissue. Each row represents a significant GO biological process which is colored according to the -log10(p.adjust). |
| Page: 1 2 3 4 5 6 7 8 9 |
| GO ID | Tissue | Disease Stage | Description | Gene Ratio | Bg Ratio | pvalue | p.adjust | Count |
| Page: 1 |
| Pathway ID | Tissue | Disease Stage | Description | Gene Ratio | Bg Ratio | pvalue | p.adjust | qvalue | Count |
| Page: 1 |
Top |
Cell-cell communication analysis |
| Identification of potential cell-cell interactions between two cell types and their ligand-receptor pairs for different disease states |
| Ligand | Receptor | LRpair | Pathway | Tissue | Disease Stage |
| Page: 1 |
Top |
Single-cell gene regulatory network inference analysis |
| Find out the significant the regulons (TFs) and the target genes of each regulon across cell types for different disease states |
| TF | Cell Type | Tissue | Disease Stage | Target Gene | RSS | Regulon Activity |
| ∗The dot plots of a searched regulon are shown for all cell subpopulations in each disease state of each tissue based on the regulon specific score inferred using pySCENIC and by calculating the average expression. |
| Page: 1 |
Top |
Somatic mutation of malignant transformation related genes |
| Annotation of somatic variants for genes involved in malignant transformation |
| Hugo Symbol | Variant Class | Variant Classification | dbSNP RS | HGVSc | HGVSp | HGVSp Short | SWISSPROT | BIOTYPE | SIFT | PolyPhen | Tumor Sample Barcode | Tissue | Histology | Sex | Age | Stage | Therapy Types | Drugs | Outcome |
| FHAD1 | SNV | Missense_Mutation | rs528012255 | c.2818N>A | p.Glu940Lys | p.E940K | B1AJZ9 | protein_coding | deleterious(0) | possibly_damaging(0.856) | TCGA-3C-AALI-01 | Breast | breast invasive carcinoma | Female | <65 | I/II | Unspecific | Poly E | Complete Response |
| FHAD1 | SNV | Missense_Mutation | novel | c.328N>A | p.Ala110Thr | p.A110T | B1AJZ9 | protein_coding | tolerated(0.6) | benign(0.003) | TCGA-A2-A0EQ-01 | Breast | breast invasive carcinoma | Female | <65 | I/II | Chemotherapy | adriamycin | SD |
| FHAD1 | SNV | Missense_Mutation | novel | c.4118N>G | p.Gln1373Arg | p.Q1373R | B1AJZ9 | protein_coding | tolerated(0.22) | benign(0.177) | TCGA-A2-A0EY-01 | Breast | breast invasive carcinoma | Female | <65 | I/II | Chemotherapy | adriamycin | SD |
| FHAD1 | SNV | Missense_Mutation | c.3700N>T | p.Asp1234Tyr | p.D1234Y | B1AJZ9 | protein_coding | deleterious(0) | possibly_damaging(0.781) | TCGA-A8-A07R-01 | Breast | breast invasive carcinoma | Female | >=65 | III/IV | Ancillary | zoledronic | SD | |
| FHAD1 | SNV | Missense_Mutation | c.70G>A | p.Glu24Lys | p.E24K | B1AJZ9 | protein_coding | tolerated(0.14) | benign(0.043) | TCGA-AC-A23H-01 | Breast | breast invasive carcinoma | Female | >=65 | I/II | Unknown | Unknown | PD | |
| FHAD1 | SNV | Missense_Mutation | novel | c.1880N>A | p.Gly627Glu | p.G627E | B1AJZ9 | protein_coding | tolerated(0.08) | possibly_damaging(0.476) | TCGA-AC-A3EH-01 | Breast | breast invasive carcinoma | Female | >=65 | III/IV | Unknown | Unknown | SD |
| FHAD1 | SNV | Missense_Mutation | c.4040N>T | p.Ala1347Val | p.A1347V | B1AJZ9 | protein_coding | deleterious(0) | probably_damaging(0.977) | TCGA-B6-A0RO-01 | Breast | breast invasive carcinoma | Female | >=65 | III/IV | Unknown | Unknown | SD | |
| FHAD1 | SNV | Missense_Mutation | c.2762N>C | p.Glu921Ala | p.E921A | B1AJZ9 | protein_coding | deleterious(0) | possibly_damaging(0.527) | TCGA-D8-A1JL-01 | Breast | breast invasive carcinoma | Female | >=65 | I/II | Unknown | Unknown | SD | |
| FHAD1 | insertion | In_Frame_Ins | novel | c.4015_4016insTCTACAAAGAGGCATTACCCGCGGCCGCTGGTGGCCGCTTTAAGGAGGCCAATG | p.Ala1343_Glu1344insLeuProAlaAlaAlaGlyGlyArgPheLysGluAlaAsnValTyrLysGluAla | p.A1343_E1344insLPAAAGGRFKEANVYKEA | B1AJZ9 | protein_coding | TCGA-A2-A0EY-01 | Breast | breast invasive carcinoma | Female | <65 | I/II | Chemotherapy | adriamycin | SD | ||
| FHAD1 | insertion | Nonsense_Mutation | novel | c.4120_4121insCTGAAAATCAACTCTCTTGAGTTAATCTTCGGTAATC | p.Lys1374ThrfsTer7 | p.K1374Tfs*7 | B1AJZ9 | protein_coding | TCGA-A2-A0EY-01 | Breast | breast invasive carcinoma | Female | <65 | I/II | Chemotherapy | adriamycin | SD |
| Page: 1 2 3 4 5 6 7 8 9 10 |
Top |
Related drugs of malignant transformation related genes |
| Identification of chemicals and drugs interact with genes involved in malignant transfromation |
| (DGIdb 4.0) |
| Entrez ID | Symbol | Category | Interaction Types | Drug Claim Name | Drug Name | PMIDs |
| Page: 1 |

Copyright 2023-Present -The University of Texas Health Science Center at Houston |