
|
|||||
|
 | |
| |
| |
| |
| |
| |
|
Gene: FH |
Gene summary for FH |
| Gene information | Species | Human | Gene symbol | FH | Gene ID | 2271 |
| Gene name | fumarate hydratase | |
| Gene Alias | FMRD | |
| Cytomap | 1q43 | |
| Gene Type | protein-coding | GO ID | GO:0001659 | UniProtAcc | A0A0S2Z4C3 |
Top |
Malignant transformation analysis |
| Identification of the aberrant gene expression in precancerous and cancerous lesions by comparing the gene expression of stem-like cells in diseased tissues with normal stem cells |
| Entrez ID | Symbol | Replicates | Species | Organ | Tissue | Adj P-value | Log2FC | Malignancy |
| 2271 | FH | HTA11_347_2000001011 | Human | Colorectum | AD | 1.58e-06 | 3.01e-01 | -0.1954 |
| 2271 | FH | HTA11_2992_2000001011 | Human | Colorectum | SER | 1.12e-02 | 4.79e-01 | -0.1706 |
| 2271 | FH | A002-C-205 | Human | Colorectum | FAP | 4.94e-02 | -1.06e-01 | -0.1236 |
| 2271 | FH | A002-C-116 | Human | Colorectum | FAP | 3.61e-02 | -9.86e-02 | -0.0452 |
| 2271 | FH | LZE4T | Human | Esophagus | ESCC | 6.44e-07 | 1.96e-01 | 0.0811 |
| 2271 | FH | LZE7T | Human | Esophagus | ESCC | 4.81e-09 | 7.61e-01 | 0.0667 |
| 2271 | FH | LZE8T | Human | Esophagus | ESCC | 2.37e-02 | 1.35e-01 | 0.067 |
| 2271 | FH | LZE22T | Human | Esophagus | ESCC | 6.37e-07 | 2.85e-01 | 0.068 |
| 2271 | FH | LZE24T | Human | Esophagus | ESCC | 8.09e-10 | 3.08e-01 | 0.0596 |
| 2271 | FH | LZE21T | Human | Esophagus | ESCC | 3.77e-04 | 2.13e-01 | 0.0655 |
| 2271 | FH | LZE6T | Human | Esophagus | ESCC | 3.76e-06 | 1.05e-01 | 0.0845 |
| 2271 | FH | P1T-E | Human | Esophagus | ESCC | 5.79e-10 | 3.64e-01 | 0.0875 |
| 2271 | FH | P2T-E | Human | Esophagus | ESCC | 3.96e-37 | 8.23e-01 | 0.1177 |
| 2271 | FH | P4T-E | Human | Esophagus | ESCC | 1.64e-22 | 4.99e-01 | 0.1323 |
| 2271 | FH | P5T-E | Human | Esophagus | ESCC | 8.71e-43 | 9.22e-01 | 0.1327 |
| 2271 | FH | P8T-E | Human | Esophagus | ESCC | 6.70e-18 | 2.65e-01 | 0.0889 |
| 2271 | FH | P9T-E | Human | Esophagus | ESCC | 7.31e-25 | 5.49e-01 | 0.1131 |
| 2271 | FH | P10T-E | Human | Esophagus | ESCC | 3.37e-23 | 3.57e-01 | 0.116 |
| 2271 | FH | P11T-E | Human | Esophagus | ESCC | 1.77e-19 | 8.35e-01 | 0.1426 |
| 2271 | FH | P12T-E | Human | Esophagus | ESCC | 1.01e-25 | 4.56e-01 | 0.1122 |
| Page: 1 2 3 4 5 6 |
| Tissue | Expression Dynamics | Abbreviation |
| Colorectum (GSE201348) |  | FAP: Familial adenomatous polyposis |
| CRC: Colorectal cancer | ||
| Colorectum (HTA11) |  | AD: Adenomas |
| SER: Sessile serrated lesions | ||
| MSI-H: Microsatellite-high colorectal cancer | ||
| MSS: Microsatellite stable colorectal cancer | ||
| Esophagus | 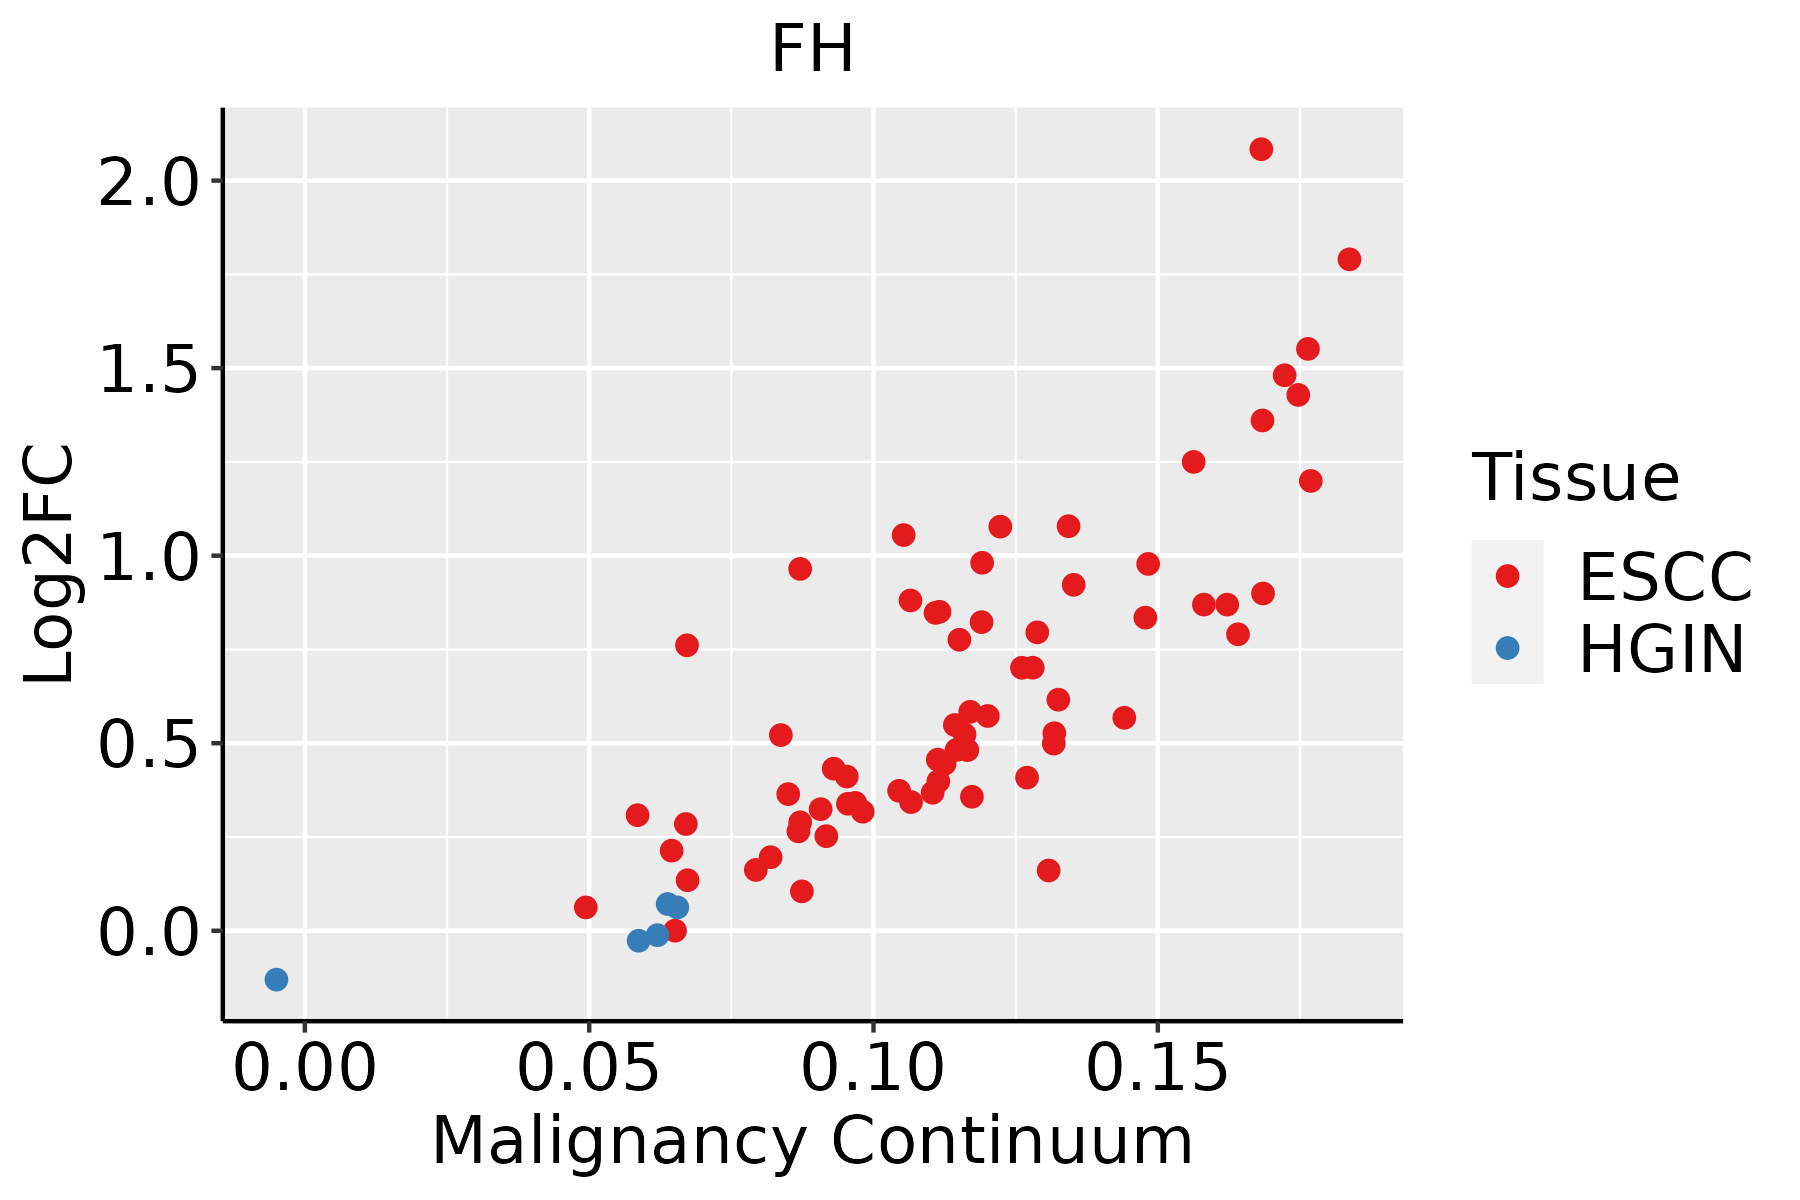 | ESCC: Esophageal squamous cell carcinoma |
| HGIN: High-grade intraepithelial neoplasias | ||
| LGIN: Low-grade intraepithelial neoplasias | ||
| Liver | 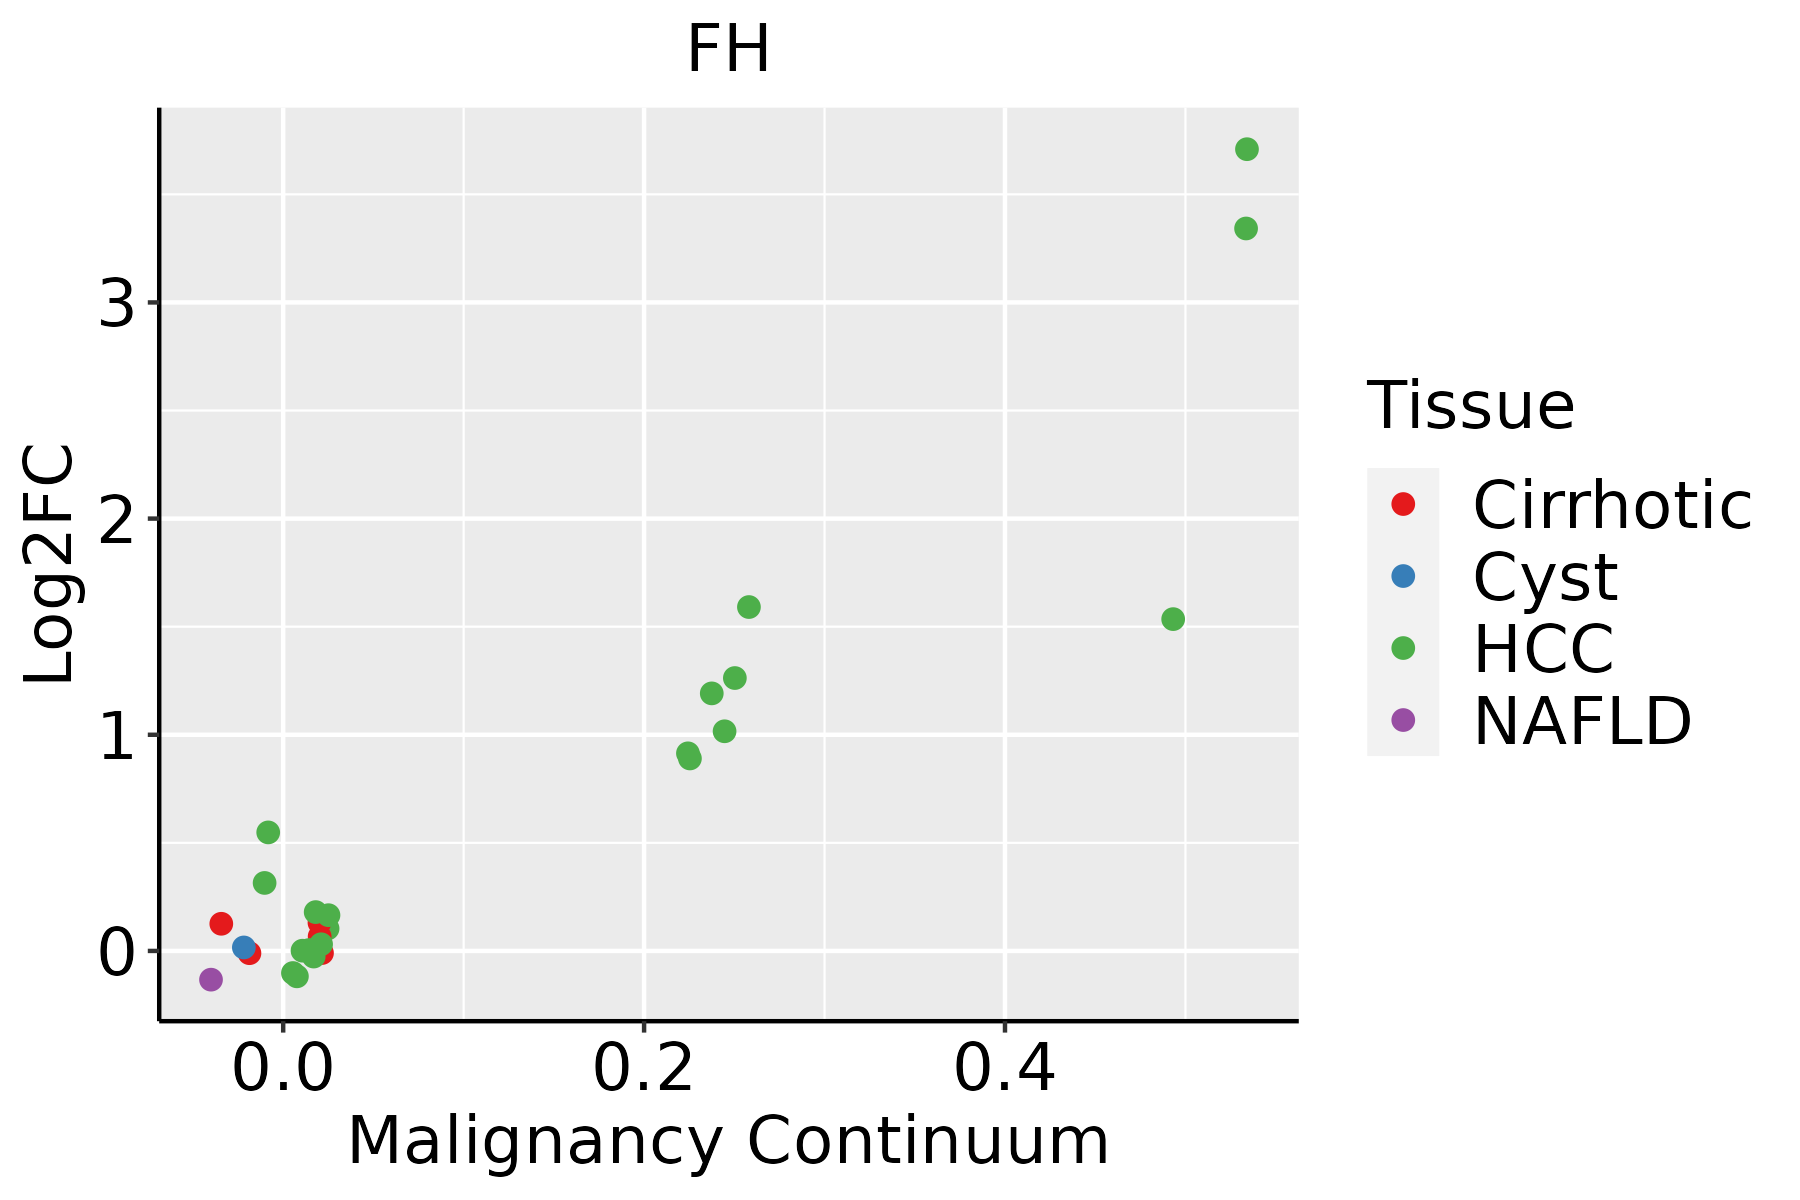 | HCC: Hepatocellular carcinoma |
| NAFLD: Non-alcoholic fatty liver disease | ||
| Oral Cavity | 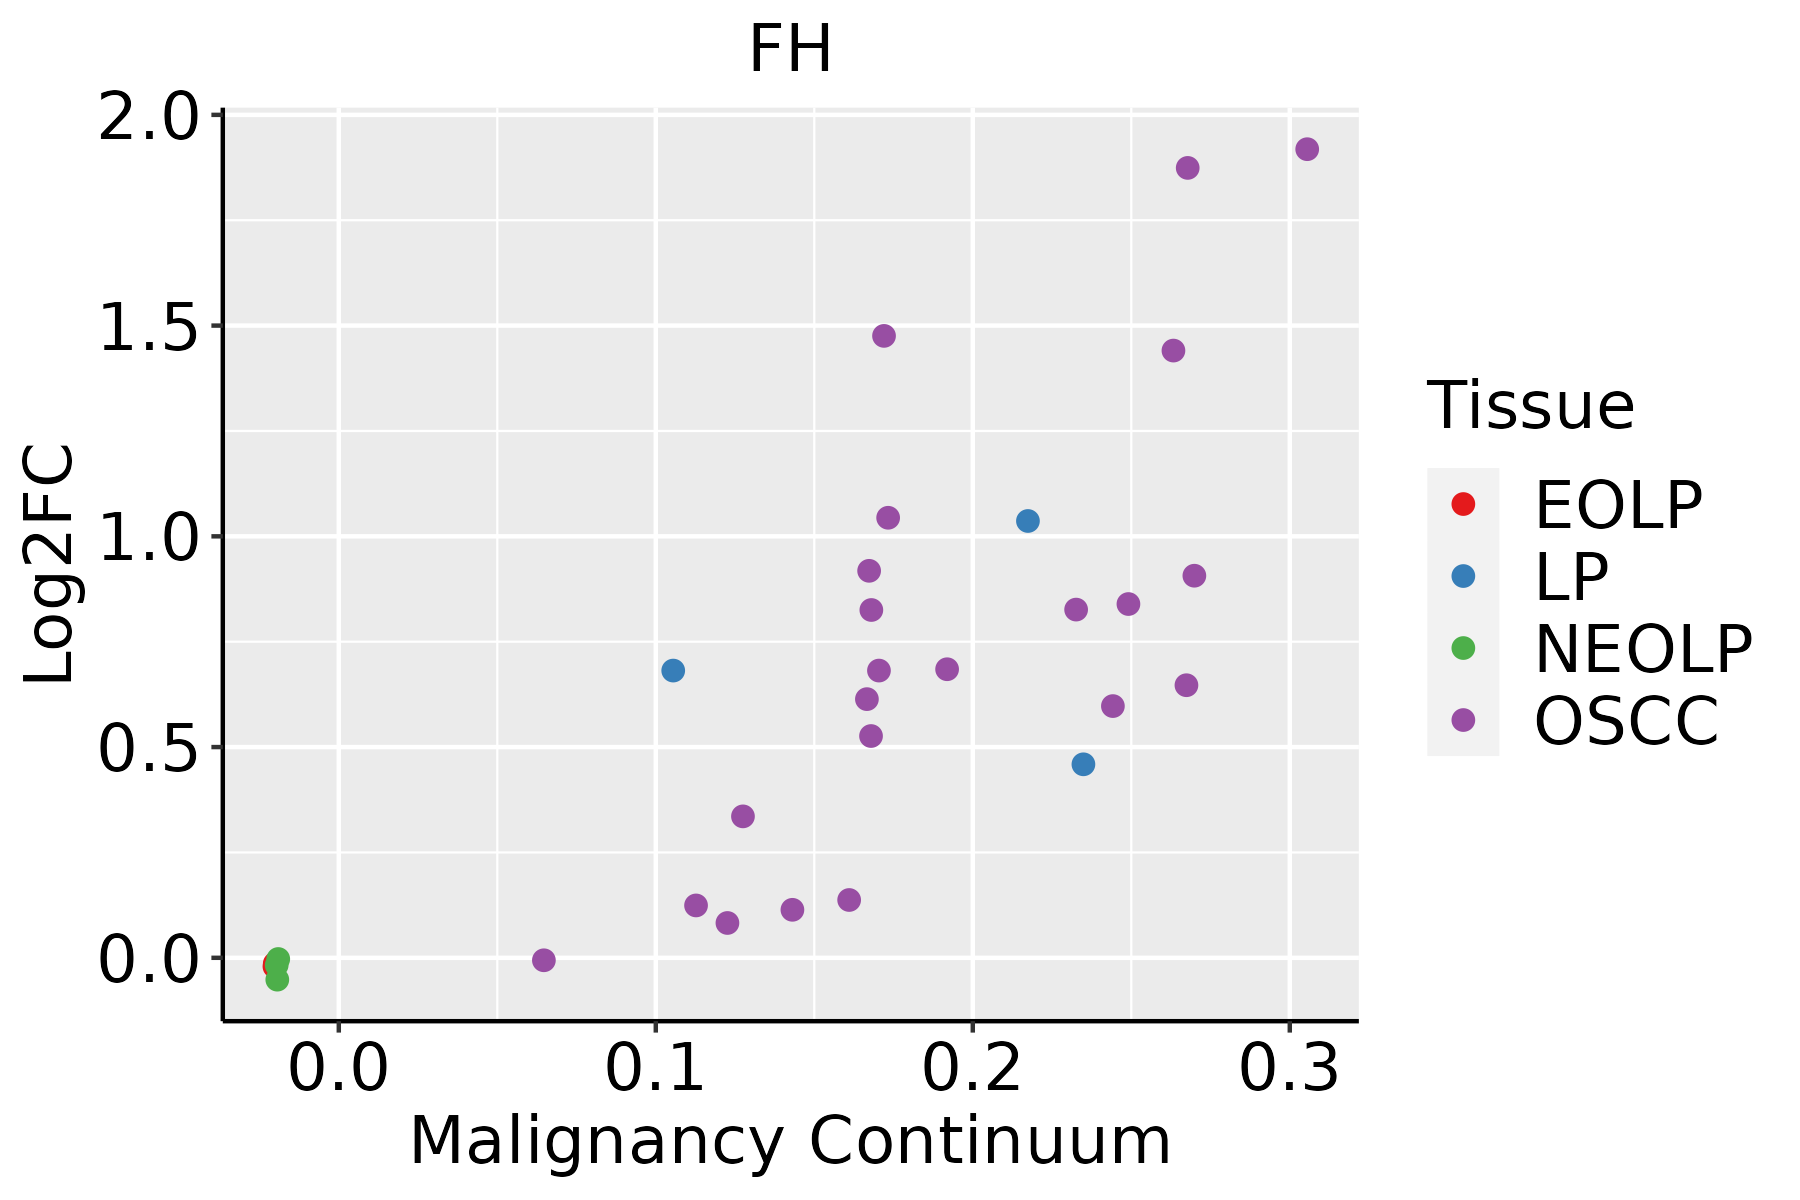 | EOLP: Erosive Oral lichen planus |
| LP: leukoplakia | ||
| NEOLP: Non-erosive oral lichen planus | ||
| OSCC: Oral squamous cell carcinoma | ||
| Skin |  | AK: Actinic keratosis |
| cSCC: Cutaneous squamous cell carcinoma | ||
| SCCIS:squamous cell carcinoma in situ | ||
| Thyroid | 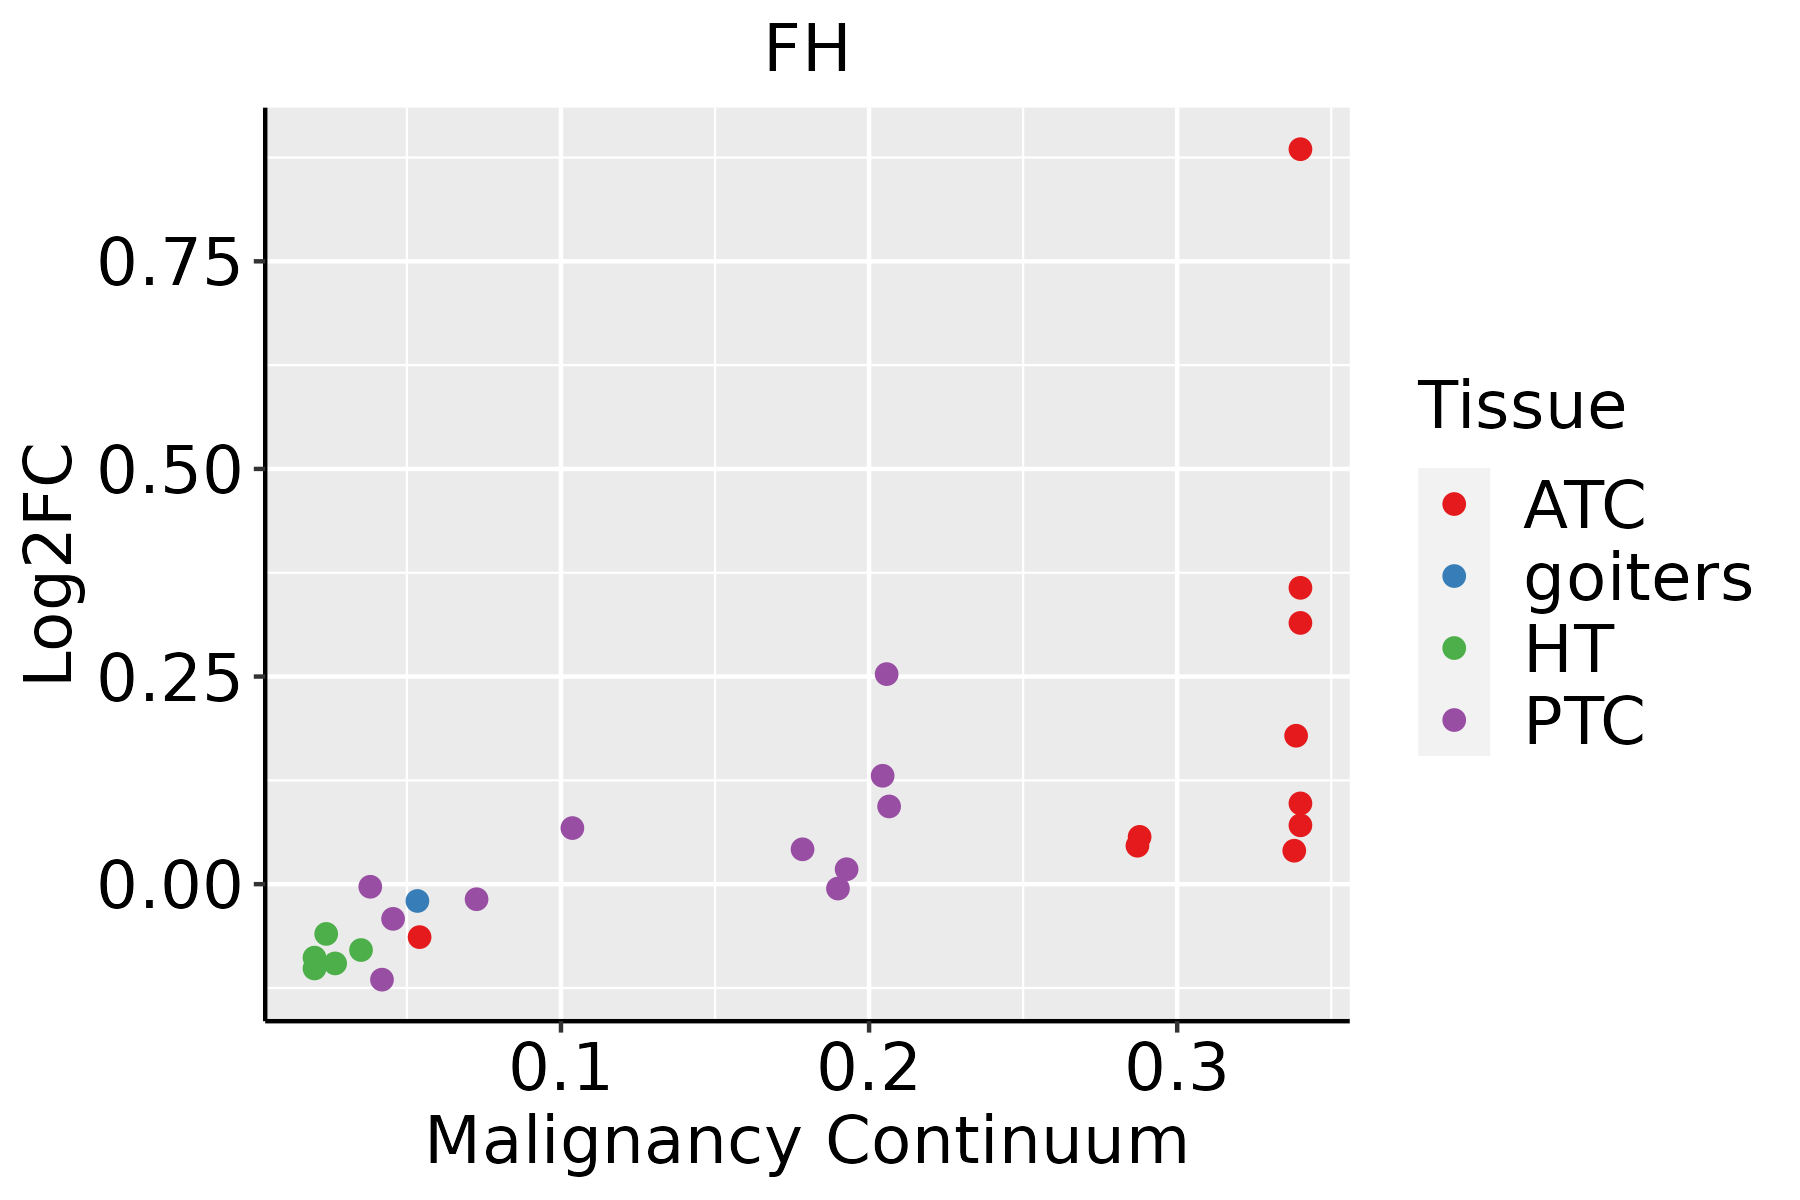 | ATC: Anaplastic thyroid cancer |
| HT: Hashimoto's thyroiditis | ||
| PTC: Papillary thyroid cancer |
| ∗log2FC in expression of this searched gene in stem-like cells from each diseased tissue sample relative to stem-like cells in normal samples in each tissue plotted against the malignancy continuum. Samples are colored based on if they are from different disease stage. |
Top |
Malignant transformation related pathway analysis |
| Find out the enriched GO biological processes and KEGG pathways involved in transition from healthy to precancer to cancer |
| Tissue | Disease Stage | Enriched GO biological Processes |
| Colorectum | AD |  |
| Colorectum | SER |  |
| Colorectum | MSS |  |
| Colorectum | MSI-H |  |
| Colorectum | FAP |  |
| ∗Top 15 enriched GO BP terms are showed in the bar plot of each disease state in each tissue. Each row represents a significant GO biological process which is colored according to the -log10(p.adjust). |
| Page: 1 2 3 4 5 6 7 8 9 |
| GO ID | Tissue | Disease Stage | Description | Gene Ratio | Bg Ratio | pvalue | p.adjust | Count |
| GO:00621979 | Breast | Precancer | cellular response to chemical stress | 51/1080 | 337/18723 | 2.40e-10 | 2.34e-08 | 51 |
| GO:00712147 | Breast | Precancer | cellular response to abiotic stimulus | 37/1080 | 331/18723 | 9.12e-05 | 1.73e-03 | 37 |
| GO:01040047 | Breast | Precancer | cellular response to environmental stimulus | 37/1080 | 331/18723 | 9.12e-05 | 1.73e-03 | 37 |
| GO:00714703 | Breast | Precancer | cellular response to osmotic stress | 8/1080 | 41/18723 | 2.08e-03 | 1.97e-02 | 8 |
| GO:006219714 | Breast | IDC | cellular response to chemical stress | 55/1434 | 337/18723 | 7.07e-08 | 4.36e-06 | 55 |
| GO:007121413 | Breast | IDC | cellular response to abiotic stimulus | 48/1434 | 331/18723 | 1.37e-05 | 3.53e-04 | 48 |
| GO:010400413 | Breast | IDC | cellular response to environmental stimulus | 48/1434 | 331/18723 | 1.37e-05 | 3.53e-04 | 48 |
| GO:007147011 | Breast | IDC | cellular response to osmotic stress | 10/1434 | 41/18723 | 8.38e-04 | 9.79e-03 | 10 |
| GO:00714742 | Breast | IDC | cellular hyperosmotic response | 5/1434 | 15/18723 | 4.10e-03 | 3.25e-02 | 5 |
| GO:006219724 | Breast | DCIS | cellular response to chemical stress | 56/1390 | 337/18723 | 9.64e-09 | 7.38e-07 | 56 |
| GO:007121423 | Breast | DCIS | cellular response to abiotic stimulus | 47/1390 | 331/18723 | 1.32e-05 | 3.31e-04 | 47 |
| GO:010400423 | Breast | DCIS | cellular response to environmental stimulus | 47/1390 | 331/18723 | 1.32e-05 | 3.31e-04 | 47 |
| GO:00714702 | Breast | DCIS | cellular response to osmotic stress | 10/1390 | 41/18723 | 6.57e-04 | 8.09e-03 | 10 |
| GO:007147411 | Breast | DCIS | cellular hyperosmotic response | 5/1390 | 15/18723 | 3.58e-03 | 2.92e-02 | 5 |
| GO:009719310 | Cervix | CC | intrinsic apoptotic signaling pathway | 85/2311 | 288/18723 | 4.56e-15 | 6.46e-12 | 85 |
| GO:004217610 | Cervix | CC | regulation of protein catabolic process | 104/2311 | 391/18723 | 9.39e-15 | 9.36e-12 | 104 |
| GO:190336210 | Cervix | CC | regulation of cellular protein catabolic process | 72/2311 | 255/18723 | 5.98e-12 | 2.10e-09 | 72 |
| GO:001049810 | Cervix | CC | proteasomal protein catabolic process | 111/2311 | 490/18723 | 8.98e-11 | 1.58e-08 | 111 |
| GO:190305010 | Cervix | CC | regulation of proteolysis involved in cellular protein catabolic process | 60/2311 | 221/18723 | 1.82e-09 | 1.98e-07 | 60 |
| GO:200005810 | Cervix | CC | regulation of ubiquitin-dependent protein catabolic process | 47/2311 | 164/18723 | 1.63e-08 | 1.25e-06 | 47 |
| Page: 1 2 3 4 5 6 7 8 9 10 11 12 13 14 15 16 17 18 19 20 21 22 23 24 25 26 27 28 29 30 31 32 33 34 35 36 37 38 39 40 41 42 43 44 45 46 47 48 49 50 51 52 53 54 55 56 57 58 59 60 61 62 63 64 65 66 67 68 69 70 71 72 73 74 75 76 77 78 79 80 81 82 83 84 85 86 87 88 89 90 91 |
| Pathway ID | Tissue | Disease Stage | Description | Gene Ratio | Bg Ratio | pvalue | p.adjust | qvalue | Count |
| hsa01200 | Colorectum | AD | Carbon metabolism | 55/2092 | 115/8465 | 5.53e-08 | 8.42e-07 | 5.37e-07 | 55 |
| hsa00620 | Colorectum | AD | Pyruvate metabolism | 28/2092 | 47/8465 | 3.71e-07 | 5.41e-06 | 3.45e-06 | 28 |
| hsa00020 | Colorectum | AD | Citrate cycle (TCA cycle) | 20/2092 | 30/8465 | 1.43e-06 | 1.77e-05 | 1.13e-05 | 20 |
| hsa05211 | Colorectum | AD | Renal cell carcinoma | 28/2092 | 69/8465 | 2.58e-03 | 1.37e-02 | 8.75e-03 | 28 |
| hsa012001 | Colorectum | AD | Carbon metabolism | 55/2092 | 115/8465 | 5.53e-08 | 8.42e-07 | 5.37e-07 | 55 |
| hsa006201 | Colorectum | AD | Pyruvate metabolism | 28/2092 | 47/8465 | 3.71e-07 | 5.41e-06 | 3.45e-06 | 28 |
| hsa000201 | Colorectum | AD | Citrate cycle (TCA cycle) | 20/2092 | 30/8465 | 1.43e-06 | 1.77e-05 | 1.13e-05 | 20 |
| hsa052111 | Colorectum | AD | Renal cell carcinoma | 28/2092 | 69/8465 | 2.58e-03 | 1.37e-02 | 8.75e-03 | 28 |
| hsa006202 | Colorectum | SER | Pyruvate metabolism | 22/1580 | 47/8465 | 9.62e-06 | 1.33e-04 | 9.67e-05 | 22 |
| hsa000202 | Colorectum | SER | Citrate cycle (TCA cycle) | 16/1580 | 30/8465 | 2.06e-05 | 2.74e-04 | 1.99e-04 | 16 |
| hsa012002 | Colorectum | SER | Carbon metabolism | 40/1580 | 115/8465 | 2.77e-05 | 3.41e-04 | 2.47e-04 | 40 |
| hsa006203 | Colorectum | SER | Pyruvate metabolism | 22/1580 | 47/8465 | 9.62e-06 | 1.33e-04 | 9.67e-05 | 22 |
| hsa000203 | Colorectum | SER | Citrate cycle (TCA cycle) | 16/1580 | 30/8465 | 2.06e-05 | 2.74e-04 | 1.99e-04 | 16 |
| hsa012003 | Colorectum | SER | Carbon metabolism | 40/1580 | 115/8465 | 2.77e-05 | 3.41e-04 | 2.47e-04 | 40 |
| hsa012006 | Colorectum | FAP | Carbon metabolism | 38/1404 | 115/8465 | 1.04e-05 | 1.44e-04 | 8.76e-05 | 38 |
| hsa012007 | Colorectum | FAP | Carbon metabolism | 38/1404 | 115/8465 | 1.04e-05 | 1.44e-04 | 8.76e-05 | 38 |
| hsa0002014 | Esophagus | ESCC | Citrate cycle (TCA cycle) | 27/4205 | 30/8465 | 3.48e-06 | 1.94e-05 | 9.95e-06 | 27 |
| hsa0120023 | Esophagus | ESCC | Carbon metabolism | 79/4205 | 115/8465 | 2.50e-05 | 1.21e-04 | 6.22e-05 | 79 |
| hsa0521118 | Esophagus | ESCC | Renal cell carcinoma | 51/4205 | 69/8465 | 3.29e-05 | 1.53e-04 | 7.83e-05 | 51 |
| hsa0062023 | Esophagus | ESCC | Pyruvate metabolism | 32/4205 | 47/8465 | 8.11e-03 | 1.94e-02 | 9.94e-03 | 32 |
| Page: 1 2 3 |
Top |
Cell-cell communication analysis |
| Identification of potential cell-cell interactions between two cell types and their ligand-receptor pairs for different disease states |
| Ligand | Receptor | LRpair | Pathway | Tissue | Disease Stage |
| Page: 1 |
Top |
Single-cell gene regulatory network inference analysis |
| Find out the significant the regulons (TFs) and the target genes of each regulon across cell types for different disease states |
| TF | Cell Type | Tissue | Disease Stage | Target Gene | RSS | Regulon Activity |
| ∗The dot plots of a searched regulon are shown for all cell subpopulations in each disease state of each tissue based on the regulon specific score inferred using pySCENIC and by calculating the average expression. |
| Page: 1 |
Top |
Somatic mutation of malignant transformation related genes |
| Annotation of somatic variants for genes involved in malignant transformation |
| Hugo Symbol | Variant Class | Variant Classification | dbSNP RS | HGVSc | HGVSp | HGVSp Short | SWISSPROT | BIOTYPE | SIFT | PolyPhen | Tumor Sample Barcode | Tissue | Histology | Sex | Age | Stage | Therapy Types | Drugs | Outcome |
| FH | SNV | Missense_Mutation | novel | c.345G>T | p.Lys115Asn | p.K115N | P07954 | protein_coding | tolerated(0.1) | benign(0.044) | TCGA-AN-A046-01 | Breast | breast invasive carcinoma | Female | >=65 | I/II | Unknown | Unknown | SD |
| FH | SNV | Missense_Mutation | c.848N>C | p.Leu283Ser | p.L283S | P07954 | protein_coding | deleterious(0) | probably_damaging(0.995) | TCGA-AN-A0AK-01 | Breast | breast invasive carcinoma | Female | >=65 | I/II | Unknown | Unknown | SD | |
| FH | SNV | Missense_Mutation | novel | c.442C>G | p.Gln148Glu | p.Q148E | P07954 | protein_coding | deleterious(0) | probably_damaging(0.956) | TCGA-C8-A3M7-01 | Breast | breast invasive carcinoma | Female | <65 | III/IV | Unknown | Unknown | PD |
| FH | SNV | Missense_Mutation | c.778N>G | p.Thr260Ala | p.T260A | P07954 | protein_coding | tolerated(0.77) | benign(0) | TCGA-E9-A1RC-01 | Breast | breast invasive carcinoma | Female | <65 | III/IV | Hormone Therapy | tamoxiphen | SD | |
| FH | insertion | Nonsense_Mutation | novel | c.467_468insAGGTCACTAAACCCTGCCTGCATTCCAGGCACTGTATTTC | p.Ile157GlyfsTer3 | p.I157Gfs*3 | P07954 | protein_coding | TCGA-AN-A04A-01 | Breast | breast invasive carcinoma | Female | <65 | III/IV | Unknown | Unknown | SD | ||
| FH | SNV | Missense_Mutation | novel | c.625C>T | p.Pro209Ser | p.P209S | P07954 | protein_coding | deleterious(0) | probably_damaging(1) | TCGA-2W-A8YY-01 | Cervix | cervical & endocervical cancer | Female | <65 | I/II | Chemotherapy | cisplatin | CR |
| FH | SNV | Missense_Mutation | rs778578307 | c.227N>T | p.Thr76Met | p.T76M | P07954 | protein_coding | tolerated(0.05) | benign(0.026) | TCGA-JW-A69B-01 | Cervix | cervical & endocervical cancer | Female | <65 | I/II | Unknown | Unknown | SD |
| FH | SNV | Missense_Mutation | c.359N>A | p.Ile120Lys | p.I120K | P07954 | protein_coding | deleterious(0) | probably_damaging(0.999) | TCGA-A6-3809-01 | Colorectum | colon adenocarcinoma | Female | >=65 | I/II | Unknown | Unknown | SD | |
| FH | SNV | Missense_Mutation | rs755449276 | c.953N>G | p.His318Arg | p.H318R | P07954 | protein_coding | tolerated(0.08) | benign(0.145) | TCGA-AA-A01R-01 | Colorectum | colon adenocarcinoma | Male | <65 | III/IV | Chemotherapy | 5-fluorouracil | PD |
| FH | SNV | Missense_Mutation | c.307N>A | p.Ala103Thr | p.A103T | P07954 | protein_coding | deleterious(0.02) | probably_damaging(0.972) | TCGA-AD-6895-01 | Colorectum | colon adenocarcinoma | Male | >=65 | III/IV | Unknown | Unknown | SD |
| Page: 1 2 3 4 5 6 |
Top |
Related drugs of malignant transformation related genes |
| Identification of chemicals and drugs interact with genes involved in malignant transfromation |
| (DGIdb 4.0) |
| Entrez ID | Symbol | Category | Interaction Types | Drug Claim Name | Drug Name | PMIDs |
| 2271 | FH | CLINICALLY ACTIONABLE, ENZYME, DNA REPAIR | DIETHYLDITHIOCARBAMATE | DITIOCARB | 1850448 |
| Page: 1 |

Copyright 2023-Present -The University of Texas Health Science Center at Houston |