
|
|||||
|
 | |
| |
| |
| |
| |
| |
|
Gene: FGL2 |
Gene summary for FGL2 |
| Gene information | Species | Human | Gene symbol | FGL2 | Gene ID | 10875 |
| Gene name | fibrinogen like 2 | |
| Gene Alias | T49 | |
| Cytomap | 7q11.23 | |
| Gene Type | protein-coding | GO ID | GO:0001775 | UniProtAcc | A4D1B8 |
Top |
Malignant transformation analysis |
| Identification of the aberrant gene expression in precancerous and cancerous lesions by comparing the gene expression of stem-like cells in diseased tissues with normal stem cells |
| Entrez ID | Symbol | Replicates | Species | Organ | Tissue | Adj P-value | Log2FC | Malignancy |
| 10875 | FGL2 | HCC2 | Human | Liver | HCC | 4.20e-12 | 1.25e+00 | 0.5341 |
| 10875 | FGL2 | HCC5 | Human | Liver | HCC | 6.39e-06 | 7.34e-01 | 0.4932 |
| 10875 | FGL2 | Pt13.a | Human | Liver | HCC | 2.75e-04 | 2.24e-01 | 0.021 |
| 10875 | FGL2 | Pt14.d | Human | Liver | HCC | 1.72e-12 | 4.39e-01 | 0.0143 |
| 10875 | FGL2 | S016 | Human | Liver | HCC | 2.88e-07 | 6.78e-01 | 0.2243 |
| 10875 | FGL2 | 047563_1562-all-cells | Human | Prostate | BPH | 6.04e-05 | 3.39e-01 | 0.0791 |
| 10875 | FGL2 | 052095_1628-all-cells | Human | Prostate | BPH | 3.13e-02 | 1.82e-01 | 0.1032 |
| 10875 | FGL2 | GSM5353218_PA_PB1B_Pool_1_2_S74_L003 | Human | Prostate | Tumor | 1.56e-06 | 6.03e-01 | 0.1479 |
| 10875 | FGL2 | GSM5353226_PA_PR5196-2_Pool_1_2_3_S54_L002 | Human | Prostate | Tumor | 2.91e-04 | 5.02e-01 | 0.159 |
| 10875 | FGL2 | P1_S1_AK | Human | Skin | AK | 9.56e-07 | -4.45e-01 | -0.3399 |
| 10875 | FGL2 | P2_S3_AK | Human | Skin | AK | 3.65e-10 | -4.77e-01 | -0.3287 |
| 10875 | FGL2 | P2_S4_SCCIS | Human | Skin | SCCIS | 5.40e-13 | -4.82e-01 | -0.3043 |
| 10875 | FGL2 | P3_S6_AK | Human | Skin | AK | 6.57e-08 | -4.64e-01 | -0.3256 |
| 10875 | FGL2 | P4_S8_cSCC | Human | Skin | cSCC | 1.59e-10 | -5.05e-01 | -0.3095 |
| 10875 | FGL2 | P5_S10_cSCC | Human | Skin | cSCC | 3.09e-15 | -4.92e-01 | -0.299 |
| 10875 | FGL2 | P1_cSCC | Human | Skin | cSCC | 1.56e-06 | -4.76e-01 | 0.0292 |
| 10875 | FGL2 | cSCC_p1 | Human | Skin | cSCC | 9.91e-14 | -4.98e-01 | -0.1916 |
| 10875 | FGL2 | cSCC_p10 | Human | Skin | cSCC | 6.74e-14 | -5.01e-01 | -0.2095 |
| 10875 | FGL2 | cSCC_p11 | Human | Skin | cSCC | 6.56e-14 | -5.03e-01 | -0.2102 |
| 10875 | FGL2 | cSCC_p3 | Human | Skin | cSCC | 5.90e-13 | -4.68e-01 | -0.2085 |
| Page: 1 2 |
| Tissue | Expression Dynamics | Abbreviation |
| Liver |  | HCC: Hepatocellular carcinoma |
| NAFLD: Non-alcoholic fatty liver disease | ||
| Oral Cavity | 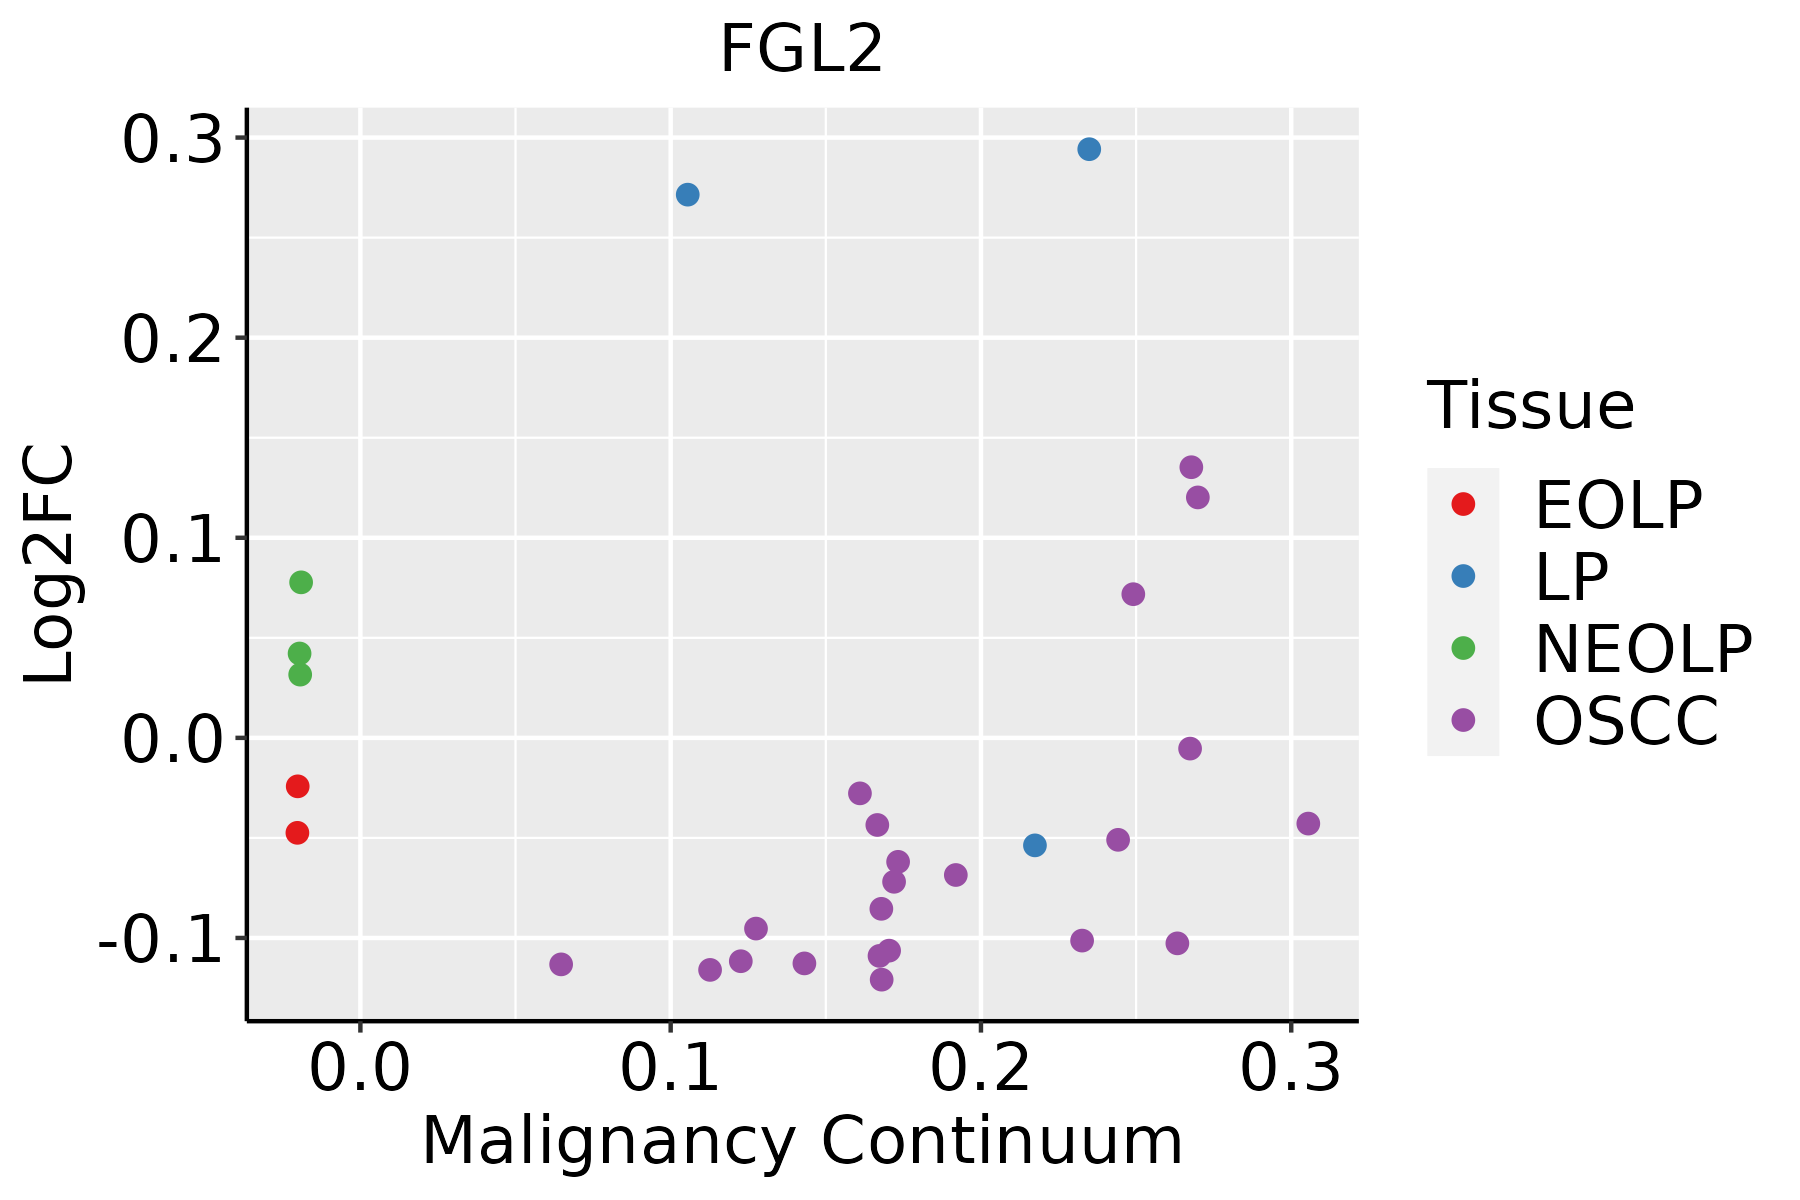 | EOLP: Erosive Oral lichen planus |
| LP: leukoplakia | ||
| NEOLP: Non-erosive oral lichen planus | ||
| OSCC: Oral squamous cell carcinoma | ||
| Prostate |  | BPH: Benign Prostatic Hyperplasia |
| Skin |  | AK: Actinic keratosis |
| cSCC: Cutaneous squamous cell carcinoma | ||
| SCCIS:squamous cell carcinoma in situ |
| ∗log2FC in expression of this searched gene in stem-like cells from each diseased tissue sample relative to stem-like cells in normal samples in each tissue plotted against the malignancy continuum. Samples are colored based on if they are from different disease stage. |
Top |
Malignant transformation related pathway analysis |
| Find out the enriched GO biological processes and KEGG pathways involved in transition from healthy to precancer to cancer |
| Tissue | Disease Stage | Enriched GO biological Processes |
| Colorectum | AD |  |
| Colorectum | SER |  |
| Colorectum | MSS |  |
| Colorectum | MSI-H |  |
| Colorectum | FAP |  |
| ∗Top 15 enriched GO BP terms are showed in the bar plot of each disease state in each tissue. Each row represents a significant GO biological process which is colored according to the -log10(p.adjust). |
| Page: 1 2 3 4 5 6 7 8 9 |
| GO ID | Tissue | Disease Stage | Description | Gene Ratio | Bg Ratio | pvalue | p.adjust | Count |
| GO:000961511 | Liver | HCC | response to virus | 210/7958 | 367/18723 | 7.32e-09 | 1.86e-07 | 210 |
| GO:00516071 | Liver | HCC | defense response to virus | 151/7958 | 265/18723 | 1.27e-06 | 1.85e-05 | 151 |
| GO:01405461 | Liver | HCC | defense response to symbiont | 151/7958 | 265/18723 | 1.27e-06 | 1.85e-05 | 151 |
| GO:001988212 | Liver | HCC | antigen processing and presentation | 65/7958 | 106/18723 | 7.06e-05 | 6.37e-04 | 65 |
| GO:00028321 | Liver | HCC | negative regulation of response to biotic stimulus | 66/7958 | 108/18723 | 7.24e-05 | 6.50e-04 | 66 |
| GO:00028312 | Liver | HCC | regulation of response to biotic stimulus | 173/7958 | 327/18723 | 8.55e-05 | 7.48e-04 | 173 |
| GO:0050687 | Liver | HCC | negative regulation of defense response to virus | 18/7958 | 24/18723 | 1.27e-03 | 6.92e-03 | 18 |
| GO:0050688 | Liver | HCC | regulation of defense response to virus | 41/7958 | 69/18723 | 3.38e-03 | 1.54e-02 | 41 |
| GO:0050777 | Liver | HCC | negative regulation of immune response | 101/7958 | 194/18723 | 4.40e-03 | 1.90e-02 | 101 |
| GO:000961510 | Prostate | BPH | response to virus | 99/3107 | 367/18723 | 2.82e-07 | 6.07e-06 | 99 |
| GO:190370616 | Prostate | BPH | regulation of hemopoiesis | 97/3107 | 367/18723 | 1.01e-06 | 1.83e-05 | 97 |
| GO:00071628 | Prostate | BPH | negative regulation of cell adhesion | 82/3107 | 303/18723 | 2.51e-06 | 4.04e-05 | 82 |
| GO:002240716 | Prostate | BPH | regulation of cell-cell adhesion | 109/3107 | 448/18723 | 1.43e-05 | 1.85e-04 | 109 |
| GO:19021058 | Prostate | BPH | regulation of leukocyte differentiation | 71/3107 | 279/18723 | 9.94e-05 | 9.21e-04 | 71 |
| GO:001988218 | Prostate | BPH | antigen processing and presentation | 33/3107 | 106/18723 | 1.55e-04 | 1.36e-03 | 33 |
| GO:004211010 | Prostate | BPH | T cell activation | 111/3107 | 487/18723 | 2.11e-04 | 1.72e-03 | 111 |
| GO:00026839 | Prostate | BPH | negative regulation of immune system process | 100/3107 | 434/18723 | 2.83e-04 | 2.20e-03 | 100 |
| GO:19031315 | Prostate | BPH | mononuclear cell differentiation | 98/3107 | 426/18723 | 3.43e-04 | 2.55e-03 | 98 |
| GO:000715910 | Prostate | BPH | leukocyte cell-cell adhesion | 86/3107 | 371/18723 | 5.95e-04 | 4.11e-03 | 86 |
| GO:190303710 | Prostate | BPH | regulation of leukocyte cell-cell adhesion | 78/3107 | 336/18723 | 9.95e-04 | 6.25e-03 | 78 |
| Page: 1 2 3 4 5 6 |
| Pathway ID | Tissue | Disease Stage | Description | Gene Ratio | Bg Ratio | pvalue | p.adjust | qvalue | Count |
| Page: 1 |
Top |
Cell-cell communication analysis |
| Identification of potential cell-cell interactions between two cell types and their ligand-receptor pairs for different disease states |
| Ligand | Receptor | LRpair | Pathway | Tissue | Disease Stage |
| Page: 1 |
Top |
Single-cell gene regulatory network inference analysis |
| Find out the significant the regulons (TFs) and the target genes of each regulon across cell types for different disease states |
| TF | Cell Type | Tissue | Disease Stage | Target Gene | RSS | Regulon Activity |
| ∗The dot plots of a searched regulon are shown for all cell subpopulations in each disease state of each tissue based on the regulon specific score inferred using pySCENIC and by calculating the average expression. |
| Page: 1 |
Top |
Somatic mutation of malignant transformation related genes |
| Annotation of somatic variants for genes involved in malignant transformation |
| Hugo Symbol | Variant Class | Variant Classification | dbSNP RS | HGVSc | HGVSp | HGVSp Short | SWISSPROT | BIOTYPE | SIFT | PolyPhen | Tumor Sample Barcode | Tissue | Histology | Sex | Age | Stage | Therapy Types | Drugs | Outcome |
| FGL2 | SNV | Missense_Mutation | novel | c.711C>A | p.Ser237Arg | p.S237R | Q14314 | protein_coding | deleterious(0) | possibly_damaging(0.888) | TCGA-A2-A0CO-01 | Breast | breast invasive carcinoma | Female | >=65 | I/II | Hormone Therapy | tamoxiphen | CR |
| FGL2 | SNV | Missense_Mutation | rs569344238 | c.1031N>A | p.Arg344His | p.R344H | Q14314 | protein_coding | tolerated(0.65) | benign(0.01) | TCGA-AO-A128-01 | Breast | breast invasive carcinoma | Female | <65 | I/II | Chemotherapy | doxorubicin | SD |
| FGL2 | SNV | Missense_Mutation | c.1050N>A | p.Asn350Lys | p.N350K | Q14314 | protein_coding | deleterious(0.04) | probably_damaging(0.99) | TCGA-B6-A0I6-01 | Breast | breast invasive carcinoma | Female | <65 | I/II | Unknown | Unknown | PD | |
| FGL2 | SNV | Missense_Mutation | rs767324365 | c.986N>A | p.Arg329His | p.R329H | Q14314 | protein_coding | deleterious(0) | probably_damaging(0.995) | TCGA-BH-A0AY-01 | Breast | breast invasive carcinoma | Female | <65 | I/II | Chemotherapy | SD | |
| FGL2 | SNV | Missense_Mutation | c.673N>C | p.Glu225Gln | p.E225Q | Q14314 | protein_coding | deleterious(0.04) | benign(0.381) | TCGA-BH-A0H7-01 | Breast | breast invasive carcinoma | Female | >=65 | III/IV | Chemotherapy | doxorubicin | SD | |
| FGL2 | insertion | Frame_Shift_Ins | novel | c.680_681insTGTGTTTAATTTCATCATCGTAAAAAGGGAT | p.Arg228ValfsTer15 | p.R228Vfs*15 | Q14314 | protein_coding | TCGA-AO-A0JB-01 | Breast | breast invasive carcinoma | Female | <65 | III/IV | Chemotherapy | cyclophosphamide | SD | ||
| FGL2 | insertion | Frame_Shift_Ins | novel | c.746_747insG | p.Gly250ArgfsTer39 | p.G250Rfs*39 | Q14314 | protein_coding | TCGA-B6-A0IJ-01 | Breast | breast invasive carcinoma | Female | <65 | I/II | Unknown | Unknown | SD | ||
| FGL2 | deletion | Frame_Shift_Del | c.746delG | p.Gly249GlufsTer44 | p.G249Efs*44 | Q14314 | protein_coding | TCGA-EW-A1IZ-01 | Breast | breast invasive carcinoma | Female | <65 | III/IV | Chemotherapy | taxotere | SD | |||
| FGL2 | SNV | Missense_Mutation | novel | c.164N>T | p.Cys55Phe | p.C55F | Q14314 | protein_coding | deleterious(0) | probably_damaging(0.999) | TCGA-DS-A1OC-01 | Cervix | cervical & endocervical cancer | Female | <65 | I/II | Chemotherapy | gemcitabine | SD |
| FGL2 | SNV | Missense_Mutation | rs767168412 | c.399N>C | p.Leu133Phe | p.L133F | Q14314 | protein_coding | deleterious(0.05) | possibly_damaging(0.823) | TCGA-CM-4748-01 | Colorectum | colon adenocarcinoma | Male | <65 | III/IV | Chemotherapy | fluorouracil | SD |
| Page: 1 2 3 4 5 6 |
Top |
Related drugs of malignant transformation related genes |
| Identification of chemicals and drugs interact with genes involved in malignant transfromation |
| (DGIdb 4.0) |
| Entrez ID | Symbol | Category | Interaction Types | Drug Claim Name | Drug Name | PMIDs |
| Page: 1 |

Copyright 2023-Present -The University of Texas Health Science Center at Houston |