
|
|||||
|
 | |
| |
| |
| |
| |
| |
|
Gene: FGL1 |
Gene summary for FGL1 |
| Gene information | Species | Human | Gene symbol | FGL1 | Gene ID | 2267 |
| Gene name | fibrinogen like 1 | |
| Gene Alias | HFREP1 | |
| Cytomap | 8p22 | |
| Gene Type | protein-coding | GO ID | GO:0001775 | UniProtAcc | Q08830 |
Top |
Malignant transformation analysis |
| Identification of the aberrant gene expression in precancerous and cancerous lesions by comparing the gene expression of stem-like cells in diseased tissues with normal stem cells |
| Entrez ID | Symbol | Replicates | Species | Organ | Tissue | Adj P-value | Log2FC | Malignancy |
| 2267 | FGL1 | NAFLD1 | Human | Liver | NAFLD | 2.52e-09 | 1.22e+00 | -0.04 |
| 2267 | FGL1 | HCC1_Meng | Human | Liver | HCC | 3.32e-83 | 6.15e-01 | 0.0246 |
| 2267 | FGL1 | HCC2_Meng | Human | Liver | HCC | 1.43e-19 | -6.71e-01 | 0.0107 |
| 2267 | FGL1 | cirrhotic1 | Human | Liver | Cirrhotic | 4.76e-18 | 1.41e-01 | 0.0202 |
| 2267 | FGL1 | cirrhotic2 | Human | Liver | Cirrhotic | 1.74e-09 | 1.81e-01 | 0.0201 |
| 2267 | FGL1 | cirrhotic3 | Human | Liver | Cirrhotic | 3.34e-04 | -3.49e-02 | 0.0215 |
| 2267 | FGL1 | HCC1 | Human | Liver | HCC | 8.83e-05 | 3.75e+00 | 0.5336 |
| 2267 | FGL1 | HCC2 | Human | Liver | HCC | 2.12e-05 | 4.41e+00 | 0.5341 |
| 2267 | FGL1 | HCC5 | Human | Liver | HCC | 7.24e-03 | 2.32e+00 | 0.4932 |
| 2267 | FGL1 | Pt13.a | Human | Liver | HCC | 4.52e-47 | 7.88e-01 | 0.021 |
| 2267 | FGL1 | Pt13.b | Human | Liver | HCC | 4.06e-73 | 6.95e-01 | 0.0251 |
| 2267 | FGL1 | Pt14.a | Human | Liver | HCC | 2.99e-16 | 6.56e-01 | 0.0169 |
| 2267 | FGL1 | Pt14.b | Human | Liver | HCC | 2.22e-09 | 7.72e-02 | 0.018 |
| 2267 | FGL1 | Pt14.d | Human | Liver | HCC | 6.27e-05 | -2.77e-01 | 0.0143 |
| 2267 | FGL1 | S014 | Human | Liver | HCC | 7.91e-04 | 2.25e+00 | 0.2254 |
| 2267 | FGL1 | S028 | Human | Liver | HCC | 1.58e-05 | 8.60e-01 | 0.2503 |
| 2267 | FGL1 | S029 | Human | Liver | HCC | 2.55e-21 | 2.09e+00 | 0.2581 |
| 2267 | FGL1 | HTA12-26-1 | Human | Pancreas | PDAC | 9.84e-03 | -5.97e-01 | 0.3728 |
| 2267 | FGL1 | HTA12-29-1 | Human | Pancreas | PDAC | 9.55e-12 | -5.90e-01 | 0.3722 |
| 2267 | FGL1 | HTA12-9-1 | Human | Pancreas | PDAC | 2.00e-05 | -5.97e-01 | 0.1532 |
| Page: 1 2 |
| Tissue | Expression Dynamics | Abbreviation |
| Liver | 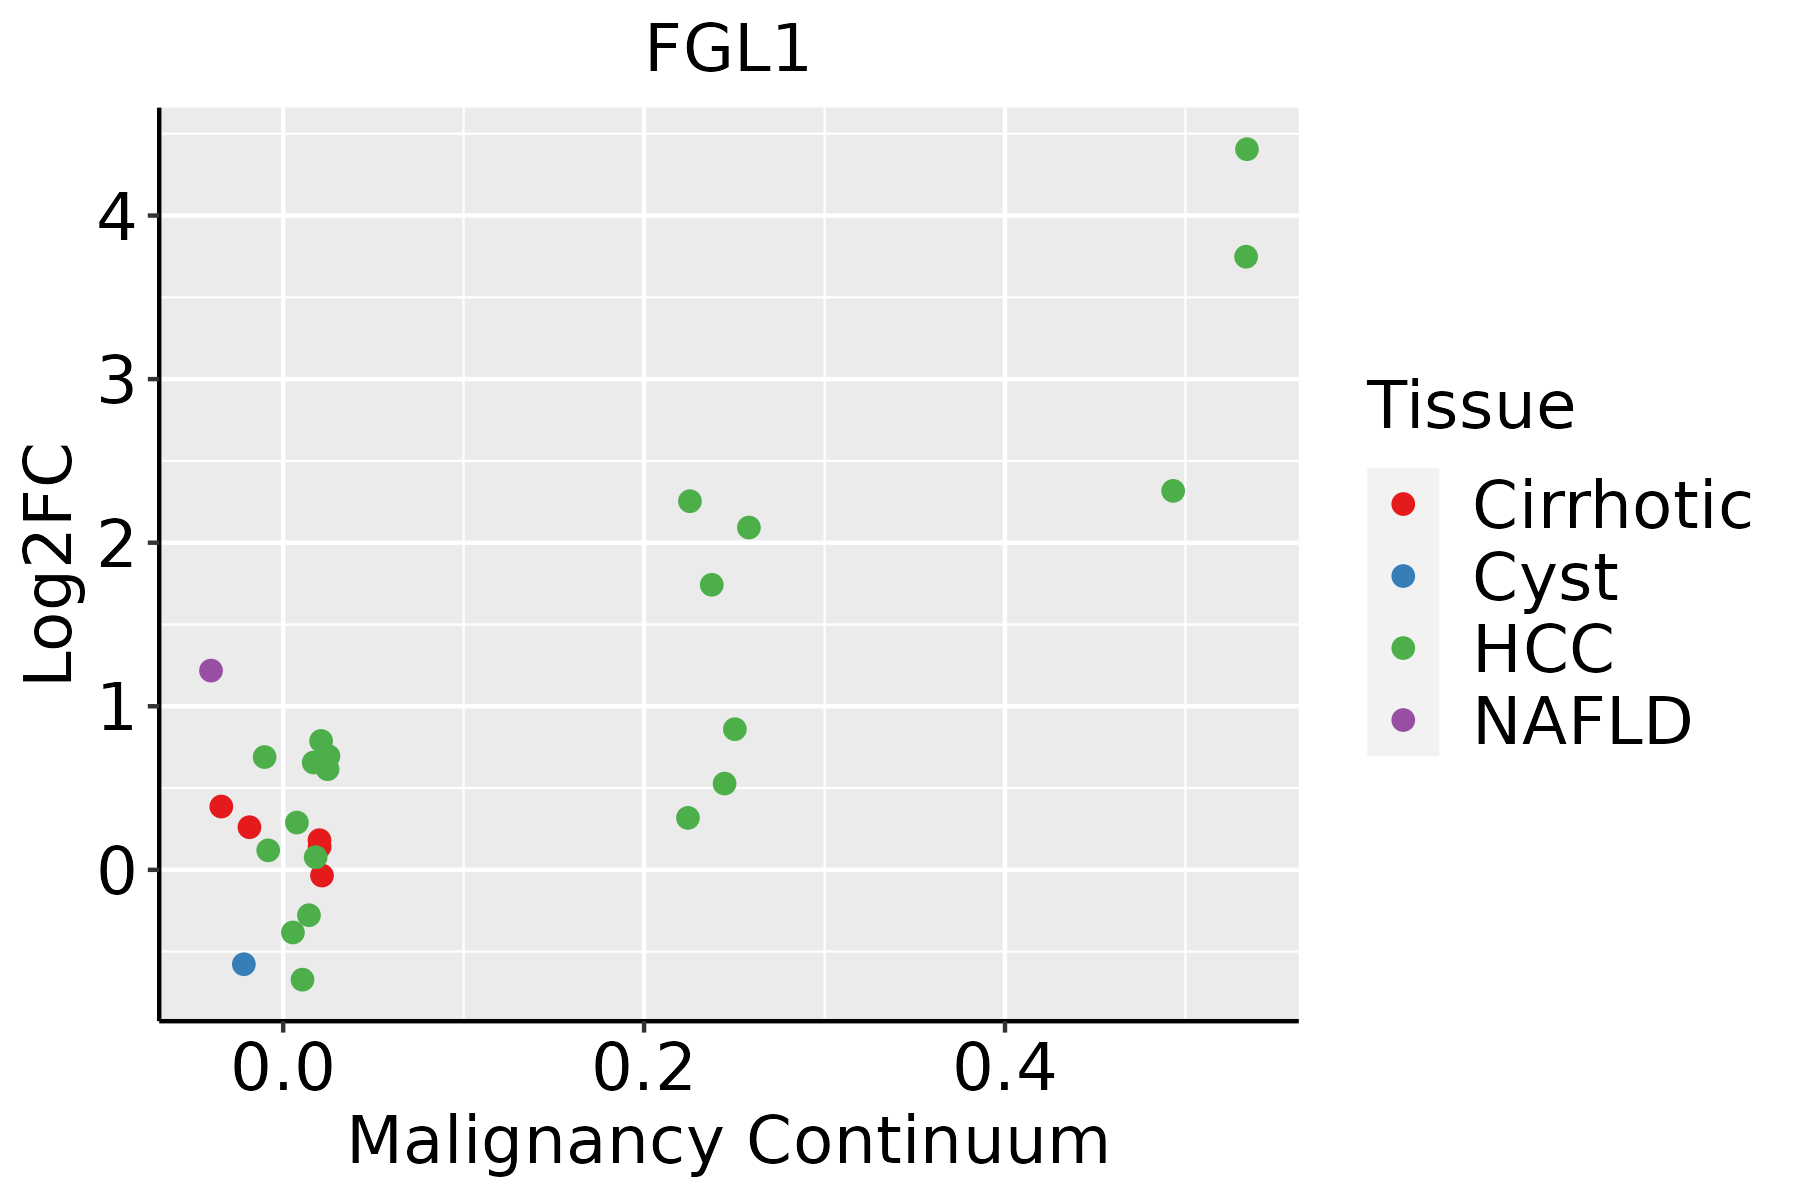 | HCC: Hepatocellular carcinoma |
| NAFLD: Non-alcoholic fatty liver disease |
| ∗log2FC in expression of this searched gene in stem-like cells from each diseased tissue sample relative to stem-like cells in normal samples in each tissue plotted against the malignancy continuum. Samples are colored based on if they are from different disease stage. |
Top |
Malignant transformation related pathway analysis |
| Find out the enriched GO biological processes and KEGG pathways involved in transition from healthy to precancer to cancer |
| Tissue | Disease Stage | Enriched GO biological Processes |
| Colorectum | AD |  |
| Colorectum | SER |  |
| Colorectum | MSS |  |
| Colorectum | MSI-H |  |
| Colorectum | FAP |  |
| ∗Top 15 enriched GO BP terms are showed in the bar plot of each disease state in each tissue. Each row represents a significant GO biological process which is colored according to the -log10(p.adjust). |
| Page: 1 2 3 4 5 6 7 8 9 |
| GO ID | Tissue | Disease Stage | Description | Gene Ratio | Bg Ratio | pvalue | p.adjust | Count |
| GO:00610087 | Liver | NAFLD | hepaticobiliary system development | 38/1882 | 150/18723 | 5.94e-08 | 5.42e-06 | 38 |
| GO:00018897 | Liver | NAFLD | liver development | 37/1882 | 147/18723 | 1.06e-07 | 8.12e-06 | 37 |
| GO:00725763 | Liver | NAFLD | liver morphogenesis | 9/1882 | 23/18723 | 2.26e-04 | 3.83e-03 | 9 |
| GO:00487327 | Liver | NAFLD | gland development | 67/1882 | 436/18723 | 2.83e-04 | 4.53e-03 | 67 |
| GO:0072574 | Liver | NAFLD | hepatocyte proliferation | 8/1882 | 22/18723 | 9.02e-04 | 1.08e-02 | 8 |
| GO:0072575 | Liver | NAFLD | epithelial cell proliferation involved in liver morphogenesis | 8/1882 | 22/18723 | 9.02e-04 | 1.08e-02 | 8 |
| GO:000188912 | Liver | Cirrhotic | liver development | 81/4634 | 147/18723 | 2.99e-15 | 3.35e-13 | 81 |
| GO:006100812 | Liver | Cirrhotic | hepaticobiliary system development | 82/4634 | 150/18723 | 3.72e-15 | 4.09e-13 | 82 |
| GO:004873212 | Liver | Cirrhotic | gland development | 154/4634 | 436/18723 | 4.03e-07 | 9.42e-06 | 154 |
| GO:00725761 | Liver | Cirrhotic | liver morphogenesis | 14/4634 | 23/18723 | 2.50e-04 | 2.26e-03 | 14 |
| GO:00725741 | Liver | Cirrhotic | hepatocyte proliferation | 13/4634 | 22/18723 | 6.27e-04 | 4.80e-03 | 13 |
| GO:00725751 | Liver | Cirrhotic | epithelial cell proliferation involved in liver morphogenesis | 13/4634 | 22/18723 | 6.27e-04 | 4.80e-03 | 13 |
| GO:00226125 | Liver | Cirrhotic | gland morphogenesis | 43/4634 | 118/18723 | 3.03e-03 | 1.72e-02 | 43 |
| GO:00071624 | Liver | Cirrhotic | negative regulation of cell adhesion | 93/4634 | 303/18723 | 1.06e-02 | 4.66e-02 | 93 |
| GO:000188922 | Liver | HCC | liver development | 108/7958 | 147/18723 | 2.16e-14 | 1.41e-12 | 108 |
| GO:006100822 | Liver | HCC | hepaticobiliary system development | 109/7958 | 150/18723 | 5.72e-14 | 3.42e-12 | 109 |
| GO:004873222 | Liver | HCC | gland development | 242/7958 | 436/18723 | 2.26e-08 | 5.28e-07 | 242 |
| GO:00725762 | Liver | HCC | liver morphogenesis | 17/7958 | 23/18723 | 2.28e-03 | 1.13e-02 | 17 |
| GO:00725742 | Liver | HCC | hepatocyte proliferation | 16/7958 | 22/18723 | 4.03e-03 | 1.76e-02 | 16 |
| GO:00725752 | Liver | HCC | epithelial cell proliferation involved in liver morphogenesis | 16/7958 | 22/18723 | 4.03e-03 | 1.76e-02 | 16 |
| Page: 1 |
| Pathway ID | Tissue | Disease Stage | Description | Gene Ratio | Bg Ratio | pvalue | p.adjust | qvalue | Count |
| Page: 1 |
Top |
Cell-cell communication analysis |
| Identification of potential cell-cell interactions between two cell types and their ligand-receptor pairs for different disease states |
| Ligand | Receptor | LRpair | Pathway | Tissue | Disease Stage |
| Page: 1 |
Top |
Single-cell gene regulatory network inference analysis |
| Find out the significant the regulons (TFs) and the target genes of each regulon across cell types for different disease states |
| TF | Cell Type | Tissue | Disease Stage | Target Gene | RSS | Regulon Activity |
| ∗The dot plots of a searched regulon are shown for all cell subpopulations in each disease state of each tissue based on the regulon specific score inferred using pySCENIC and by calculating the average expression. |
| Page: 1 |
Top |
Somatic mutation of malignant transformation related genes |
| Annotation of somatic variants for genes involved in malignant transformation |
| Hugo Symbol | Variant Class | Variant Classification | dbSNP RS | HGVSc | HGVSp | HGVSp Short | SWISSPROT | BIOTYPE | SIFT | PolyPhen | Tumor Sample Barcode | Tissue | Histology | Sex | Age | Stage | Therapy Types | Drugs | Outcome |
| FGL1 | SNV | Missense_Mutation | novel | c.199N>C | p.Asp67His | p.D67H | Q08830 | protein_coding | tolerated(0.15) | benign(0.201) | TCGA-AQ-A7U7-01 | Breast | breast invasive carcinoma | Female | <65 | III/IV | Targeted Molecular therapy | rituximab | CR |
| FGL1 | SNV | Missense_Mutation | novel | c.382N>T | p.Asp128Tyr | p.D128Y | Q08830 | protein_coding | deleterious(0) | probably_damaging(1) | TCGA-C5-A3HD-01 | Cervix | cervical & endocervical cancer | Female | <65 | I/II | Chemotherapy | cisplatin | SD |
| FGL1 | SNV | Missense_Mutation | c.601N>C | p.Glu201Gln | p.E201Q | Q08830 | protein_coding | tolerated(0.93) | benign(0.025) | TCGA-JW-A5VL-01 | Cervix | cervical & endocervical cancer | Female | <65 | I/II | Unknown | Unknown | SD | |
| FGL1 | SNV | Missense_Mutation | novel | c.641N>T | p.Ser214Phe | p.S214F | Q08830 | protein_coding | deleterious(0) | possibly_damaging(0.88) | TCGA-AA-3984-01 | Colorectum | colon adenocarcinoma | Female | <65 | I/II | Unknown | Unknown | SD |
| FGL1 | SNV | Missense_Mutation | rs758161799 | c.112C>T | p.Arg38Cys | p.R38C | Q08830 | protein_coding | deleterious(0) | possibly_damaging(0.53) | TCGA-AA-A010-01 | Colorectum | colon adenocarcinoma | Female | <65 | I/II | Chemotherapy | folinic | CR |
| FGL1 | SNV | Missense_Mutation | novel | c.570N>G | p.Asn190Lys | p.N190K | Q08830 | protein_coding | tolerated(0.2) | benign(0.003) | TCGA-CA-6717-01 | Colorectum | colon adenocarcinoma | Male | <65 | I/II | Chemotherapy | oxaliplatin | CR |
| FGL1 | SNV | Missense_Mutation | c.436N>C | p.Asn146His | p.N146H | Q08830 | protein_coding | deleterious(0.01) | probably_damaging(0.987) | TCGA-CA-6718-01 | Colorectum | colon adenocarcinoma | Male | <65 | I/II | Unknown | Unknown | PD | |
| FGL1 | SNV | Missense_Mutation | c.390N>A | p.Ser130Arg | p.S130R | Q08830 | protein_coding | tolerated(0.19) | probably_damaging(0.981) | TCGA-AF-5654-01 | Colorectum | rectum adenocarcinoma | Female | >=65 | I/II | Unknown | Unknown | SD | |
| FGL1 | SNV | Missense_Mutation | novel | c.830N>A | p.Ala277Asp | p.A277D | Q08830 | protein_coding | deleterious(0) | possibly_damaging(0.475) | TCGA-A5-A0G1-01 | Endometrium | uterine corpus endometrioid carcinoma | Female | >=65 | I/II | Unknown | Unknown | SD |
| FGL1 | SNV | Missense_Mutation | novel | c.380N>A | p.Ser127Tyr | p.S127Y | Q08830 | protein_coding | tolerated(0.37) | benign(0.361) | TCGA-AX-A06F-01 | Endometrium | uterine corpus endometrioid carcinoma | Female | <65 | III/IV | Chemotherapy | carboplatin | SD |
| Page: 1 2 3 |
Top |
Related drugs of malignant transformation related genes |
| Identification of chemicals and drugs interact with genes involved in malignant transfromation |
| (DGIdb 4.0) |
| Entrez ID | Symbol | Category | Interaction Types | Drug Claim Name | Drug Name | PMIDs |
| Page: 1 |

Copyright 2023-Present -The University of Texas Health Science Center at Houston |