
|
|||||
|
 | |
| |
| |
| |
| |
| |
|
Gene: FGG |
Gene summary for FGG |
| Gene information | Species | Human | Gene symbol | FGG | Gene ID | 2266 |
| Gene name | fibrinogen gamma chain | |
| Gene Alias | FGG | |
| Cytomap | 4q32.1 | |
| Gene Type | protein-coding | GO ID | GO:0000165 | UniProtAcc | A0A140VJJ6 |
Top |
Malignant transformation analysis |
| Identification of the aberrant gene expression in precancerous and cancerous lesions by comparing the gene expression of stem-like cells in diseased tissues with normal stem cells |
| Entrez ID | Symbol | Replicates | Species | Organ | Tissue | Adj P-value | Log2FC | Malignancy |
| 2266 | FGG | NAFLD1 | Human | Liver | NAFLD | 3.85e-03 | 6.28e-01 | -0.04 |
| 2266 | FGG | S43 | Human | Liver | Cirrhotic | 1.02e-02 | 3.77e-01 | -0.0187 |
| 2266 | FGG | HCC1_Meng | Human | Liver | HCC | 1.08e-52 | 1.28e-01 | 0.0246 |
| 2266 | FGG | HCC2_Meng | Human | Liver | HCC | 3.48e-42 | -1.10e+00 | 0.0107 |
| 2266 | FGG | cirrhotic1 | Human | Liver | Cirrhotic | 7.24e-15 | 3.00e-02 | 0.0202 |
| 2266 | FGG | cirrhotic2 | Human | Liver | Cirrhotic | 1.72e-14 | 3.53e-02 | 0.0201 |
| 2266 | FGG | cirrhotic3 | Human | Liver | Cirrhotic | 3.09e-10 | -6.63e-01 | 0.0215 |
| 2266 | FGG | p6 | Human | Liver | Cyst | 2.40e-07 | -1.11e+00 | -0.0218 |
| 2266 | FGG | HCC1 | Human | Liver | HCC | 2.27e-27 | 6.69e+00 | 0.5336 |
| 2266 | FGG | HCC2 | Human | Liver | HCC | 6.64e-27 | 8.05e+00 | 0.5341 |
| 2266 | FGG | HCC5 | Human | Liver | HCC | 9.82e-04 | 2.59e+00 | 0.4932 |
| 2266 | FGG | Pt13.a | Human | Liver | HCC | 7.44e-40 | 5.19e-01 | 0.021 |
| 2266 | FGG | Pt13.b | Human | Liver | HCC | 3.97e-58 | 4.45e-01 | 0.0251 |
| 2266 | FGG | Pt13.c | Human | Liver | HCC | 3.13e-15 | 6.01e-01 | 0.0076 |
| 2266 | FGG | Pt14.a | Human | Liver | HCC | 5.38e-07 | 2.88e-01 | 0.0169 |
| 2266 | FGG | Pt14.b | Human | Liver | HCC | 1.50e-09 | 4.27e-01 | 0.018 |
| 2266 | FGG | Pt14.d | Human | Liver | HCC | 3.85e-25 | 4.69e-01 | 0.0143 |
| 2266 | FGG | S014 | Human | Liver | HCC | 3.93e-02 | 1.69e+00 | 0.2254 |
| 2266 | FGG | S015 | Human | Liver | HCC | 2.38e-06 | 1.48e+00 | 0.2375 |
| 2266 | FGG | S016 | Human | Liver | HCC | 1.15e-12 | -2.25e-01 | 0.2243 |
| Page: 1 2 |
| Tissue | Expression Dynamics | Abbreviation |
| Liver | 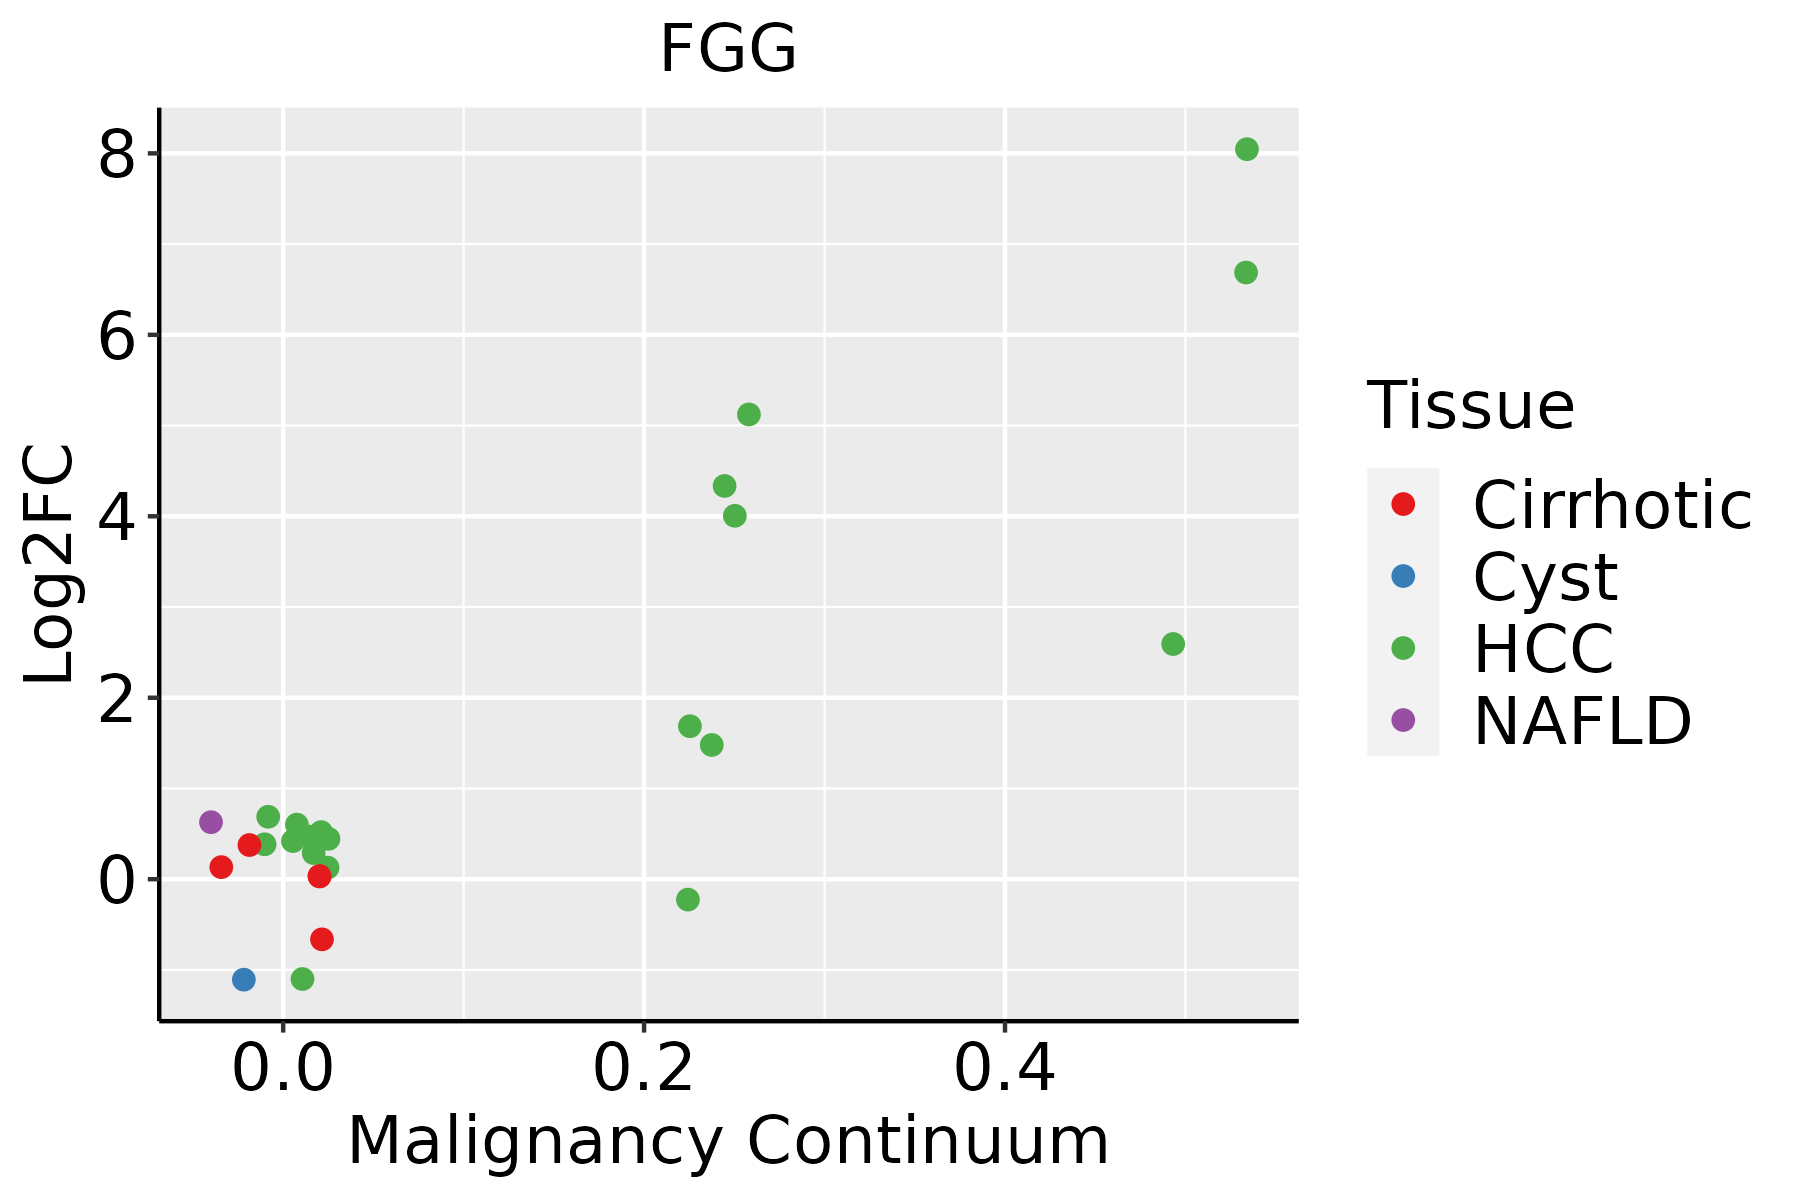 | HCC: Hepatocellular carcinoma |
| NAFLD: Non-alcoholic fatty liver disease |
| ∗log2FC in expression of this searched gene in stem-like cells from each diseased tissue sample relative to stem-like cells in normal samples in each tissue plotted against the malignancy continuum. Samples are colored based on if they are from different disease stage. |
Top |
Malignant transformation related pathway analysis |
| Find out the enriched GO biological processes and KEGG pathways involved in transition from healthy to precancer to cancer |
| Tissue | Disease Stage | Enriched GO biological Processes |
| Colorectum | AD |  |
| Colorectum | SER |  |
| Colorectum | MSS |  |
| Colorectum | MSI-H |  |
| Colorectum | FAP |  |
| ∗Top 15 enriched GO BP terms are showed in the bar plot of each disease state in each tissue. Each row represents a significant GO biological process which is colored according to the -log10(p.adjust). |
| Page: 1 2 3 4 5 6 7 8 9 |
| GO ID | Tissue | Disease Stage | Description | Gene Ratio | Bg Ratio | pvalue | p.adjust | Count |
| GO:00602498 | Cervix | CC | anatomical structure homeostasis | 63/2311 | 314/18723 | 6.03e-05 | 8.68e-04 | 63 |
| GO:0044262 | Colorectum | AD | cellular carbohydrate metabolic process | 87/3918 | 283/18723 | 6.00e-05 | 1.01e-03 | 87 |
| GO:0005996 | Colorectum | AD | monosaccharide metabolic process | 80/3918 | 257/18723 | 7.31e-05 | 1.17e-03 | 80 |
| GO:0060249 | Colorectum | AD | anatomical structure homeostasis | 94/3918 | 314/18723 | 9.37e-05 | 1.42e-03 | 94 |
| GO:00602491 | Colorectum | SER | anatomical structure homeostasis | 74/2897 | 314/18723 | 1.01e-04 | 2.13e-03 | 74 |
| GO:00059961 | Colorectum | SER | monosaccharide metabolic process | 59/2897 | 257/18723 | 9.65e-04 | 1.15e-02 | 59 |
| GO:00602492 | Colorectum | MSS | anatomical structure homeostasis | 84/3467 | 314/18723 | 1.87e-04 | 2.64e-03 | 84 |
| GO:00059962 | Colorectum | MSS | monosaccharide metabolic process | 66/3467 | 257/18723 | 2.61e-03 | 2.06e-02 | 66 |
| GO:00602493 | Colorectum | MSI-H | anatomical structure homeostasis | 38/1319 | 314/18723 | 7.73e-04 | 1.44e-02 | 38 |
| GO:00442621 | Colorectum | FAP | cellular carbohydrate metabolic process | 66/2622 | 283/18723 | 1.53e-05 | 4.01e-04 | 66 |
| GO:00059963 | Colorectum | FAP | monosaccharide metabolic process | 59/2622 | 257/18723 | 6.79e-05 | 1.28e-03 | 59 |
| GO:00602494 | Colorectum | FAP | anatomical structure homeostasis | 69/2622 | 314/18723 | 7.51e-05 | 1.37e-03 | 69 |
| GO:00602495 | Colorectum | CRC | anatomical structure homeostasis | 57/2078 | 314/18723 | 1.24e-04 | 2.41e-03 | 57 |
| GO:00442622 | Colorectum | CRC | cellular carbohydrate metabolic process | 49/2078 | 283/18723 | 1.06e-03 | 1.24e-02 | 49 |
| GO:00610417 | Liver | NAFLD | regulation of wound healing | 39/1882 | 134/18723 | 5.52e-10 | 1.28e-07 | 39 |
| GO:00420607 | Liver | NAFLD | wound healing | 84/1882 | 422/18723 | 6.56e-10 | 1.37e-07 | 84 |
| GO:0042730 | Liver | NAFLD | fibrinolysis | 15/1882 | 25/18723 | 1.26e-09 | 2.30e-07 | 15 |
| GO:0030195 | Liver | NAFLD | negative regulation of blood coagulation | 21/1882 | 49/18723 | 2.42e-09 | 4.05e-07 | 21 |
| GO:1900047 | Liver | NAFLD | negative regulation of hemostasis | 21/1882 | 50/18723 | 3.78e-09 | 5.40e-07 | 21 |
| GO:0030193 | Liver | NAFLD | regulation of blood coagulation | 24/1882 | 66/18723 | 9.30e-09 | 1.26e-06 | 24 |
| Page: 1 2 3 4 5 6 7 8 9 10 11 |
| Pathway ID | Tissue | Disease Stage | Description | Gene Ratio | Bg Ratio | pvalue | p.adjust | qvalue | Count |
| hsa0517114 | Liver | NAFLD | Coronavirus disease - COVID-19 | 111/1043 | 232/8465 | 1.01e-41 | 3.32e-39 | 2.67e-39 | 111 |
| hsa04610 | Liver | NAFLD | Complement and coagulation cascades | 35/1043 | 86/8465 | 2.48e-11 | 2.04e-09 | 1.64e-09 | 35 |
| hsa0517115 | Liver | NAFLD | Coronavirus disease - COVID-19 | 111/1043 | 232/8465 | 1.01e-41 | 3.32e-39 | 2.67e-39 | 111 |
| hsa046101 | Liver | NAFLD | Complement and coagulation cascades | 35/1043 | 86/8465 | 2.48e-11 | 2.04e-09 | 1.64e-09 | 35 |
| hsa0517122 | Liver | Cirrhotic | Coronavirus disease - COVID-19 | 136/2530 | 232/8465 | 3.28e-20 | 1.82e-18 | 1.12e-18 | 136 |
| hsa046102 | Liver | Cirrhotic | Complement and coagulation cascades | 48/2530 | 86/8465 | 4.41e-07 | 5.44e-06 | 3.35e-06 | 48 |
| hsa0517132 | Liver | Cirrhotic | Coronavirus disease - COVID-19 | 136/2530 | 232/8465 | 3.28e-20 | 1.82e-18 | 1.12e-18 | 136 |
| hsa046103 | Liver | Cirrhotic | Complement and coagulation cascades | 48/2530 | 86/8465 | 4.41e-07 | 5.44e-06 | 3.35e-06 | 48 |
| hsa0517142 | Liver | HCC | Coronavirus disease - COVID-19 | 167/4020 | 232/8465 | 1.50e-14 | 4.19e-13 | 2.33e-13 | 167 |
| hsa046104 | Liver | HCC | Complement and coagulation cascades | 57/4020 | 86/8465 | 3.19e-04 | 1.45e-03 | 8.04e-04 | 57 |
| hsa046112 | Liver | HCC | Platelet activation | 71/4020 | 124/8465 | 1.77e-02 | 4.15e-02 | 2.31e-02 | 71 |
| hsa0517152 | Liver | HCC | Coronavirus disease - COVID-19 | 167/4020 | 232/8465 | 1.50e-14 | 4.19e-13 | 2.33e-13 | 167 |
| hsa046105 | Liver | HCC | Complement and coagulation cascades | 57/4020 | 86/8465 | 3.19e-04 | 1.45e-03 | 8.04e-04 | 57 |
| hsa0461111 | Liver | HCC | Platelet activation | 71/4020 | 124/8465 | 1.77e-02 | 4.15e-02 | 2.31e-02 | 71 |
| hsa0517162 | Liver | Cyst | Coronavirus disease - COVID-19 | 75/339 | 232/8465 | 2.97e-49 | 4.27e-47 | 3.53e-47 | 75 |
| hsa0517172 | Liver | Cyst | Coronavirus disease - COVID-19 | 75/339 | 232/8465 | 2.97e-49 | 4.27e-47 | 3.53e-47 | 75 |
| Page: 1 |
Top |
Cell-cell communication analysis |
| Identification of potential cell-cell interactions between two cell types and their ligand-receptor pairs for different disease states |
| Ligand | Receptor | LRpair | Pathway | Tissue | Disease Stage |
| Page: 1 |
Top |
Single-cell gene regulatory network inference analysis |
| Find out the significant the regulons (TFs) and the target genes of each regulon across cell types for different disease states |
| TF | Cell Type | Tissue | Disease Stage | Target Gene | RSS | Regulon Activity |
| ∗The dot plots of a searched regulon are shown for all cell subpopulations in each disease state of each tissue based on the regulon specific score inferred using pySCENIC and by calculating the average expression. |
| Page: 1 |
Top |
Somatic mutation of malignant transformation related genes |
| Annotation of somatic variants for genes involved in malignant transformation |
| Hugo Symbol | Variant Class | Variant Classification | dbSNP RS | HGVSc | HGVSp | HGVSp Short | SWISSPROT | BIOTYPE | SIFT | PolyPhen | Tumor Sample Barcode | Tissue | Histology | Sex | Age | Stage | Therapy Types | Drugs | Outcome |
| FGG | SNV | Missense_Mutation | novel | c.1236A>G | p.Ile412Met | p.I412M | P02679 | protein_coding | deleterious(0.02) | benign(0.403) | TCGA-AN-A046-01 | Breast | breast invasive carcinoma | Female | >=65 | I/II | Unknown | Unknown | SD |
| FGG | SNV | Missense_Mutation | c.349N>C | p.Glu117Gln | p.E117Q | P02679 | protein_coding | tolerated(0.1) | possibly_damaging(0.54) | TCGA-AR-A251-01 | Breast | breast invasive carcinoma | Female | <65 | III/IV | Chemotherapy | doxorubicin | SD | |
| FGG | SNV | Missense_Mutation | c.149N>A | p.Gly50Asp | p.G50D | P02679 | protein_coding | tolerated(0.1) | probably_damaging(1) | TCGA-B6-A0IB-01 | Breast | breast invasive carcinoma | Female | <65 | III/IV | Unknown | Unknown | PD | |
| FGG | deletion | Frame_Shift_Del | c.989delN | p.Phe330SerfsTer33 | p.F330Sfs*33 | P02679 | protein_coding | TCGA-AN-A0AK-01 | Breast | breast invasive carcinoma | Female | >=65 | I/II | Unknown | Unknown | SD | |||
| FGG | SNV | Missense_Mutation | novel | c.892N>A | p.Asp298Asn | p.D298N | P02679 | protein_coding | tolerated(0.34) | possibly_damaging(0.798) | TCGA-IR-A3LK-01 | Cervix | cervical & endocervical cancer | Female | >=65 | I/II | Chemotherapy | cisplatin | PD |
| FGG | SNV | Missense_Mutation | c.527G>A | p.Gly176Glu | p.G176E | P02679 | protein_coding | deleterious(0) | probably_damaging(1) | TCGA-Q1-A73O-01 | Cervix | cervical & endocervical cancer | Female | <65 | I/II | Chemotherapy | cisplatin | CR | |
| FGG | SNV | Missense_Mutation | rs121913088 | c.902N>A | p.Arg301His | p.R301H | P02679 | protein_coding | deleterious(0) | probably_damaging(0.999) | TCGA-VS-A9UI-01 | Cervix | cervical & endocervical cancer | Female | >=65 | I/II | Unknown | Unknown | SD |
| FGG | SNV | Missense_Mutation | c.1278N>G | p.His426Gln | p.H426Q | P02679 | protein_coding | tolerated_low_confidence(0.21) | benign(0.003) | TCGA-A6-2686-01 | Colorectum | colon adenocarcinoma | Female | >=65 | I/II | Unknown | Unknown | SD | |
| FGG | SNV | Missense_Mutation | c.487N>A | p.Glu163Lys | p.E163K | P02679 | protein_coding | tolerated(0.28) | possibly_damaging(0.692) | TCGA-AA-3977-01 | Colorectum | colon adenocarcinoma | Male | >=65 | I/II | Unknown | Unknown | SD | |
| FGG | SNV | Missense_Mutation | c.602N>G | p.Asn201Ser | p.N201S | P02679 | protein_coding | tolerated(0.49) | benign(0) | TCGA-AA-A00N-01 | Colorectum | colon adenocarcinoma | Male | >=65 | I/II | Unknown | Unknown | PD |
| Page: 1 2 3 4 5 6 |
Top |
Related drugs of malignant transformation related genes |
| Identification of chemicals and drugs interact with genes involved in malignant transfromation |
| (DGIdb 4.0) |
| Entrez ID | Symbol | Category | Interaction Types | Drug Claim Name | Drug Name | PMIDs |
| 2266 | FGG | DRUGGABLE GENOME, FIBRINOGEN, EXTERNAL SIDE OF PLASMA MEMBRANE, CELL SURFACE | ALFIMEPRASE | ALFIMEPRASE | ||
| 2266 | FGG | DRUGGABLE GENOME, FIBRINOGEN, EXTERNAL SIDE OF PLASMA MEMBRANE, CELL SURFACE | eptifibatide | EPTIFIBATIDE | 20938371 | |
| 2266 | FGG | DRUGGABLE GENOME, FIBRINOGEN, EXTERNAL SIDE OF PLASMA MEMBRANE, CELL SURFACE | inhibitor | CHEMBL1201505 | FIBRINOLYSIN, HUMAN | |
| 2266 | FGG | DRUGGABLE GENOME, FIBRINOGEN, EXTERNAL SIDE OF PLASMA MEMBRANE, CELL SURFACE | RECOMBINANT FACTOR IX FC FUSION PROTEIN | |||
| 2266 | FGG | DRUGGABLE GENOME, FIBRINOGEN, EXTERNAL SIDE OF PLASMA MEMBRANE, CELL SURFACE | tirofiban | TIROFIBAN | 20938371 | |
| 2266 | FGG | DRUGGABLE GENOME, FIBRINOGEN, EXTERNAL SIDE OF PLASMA MEMBRANE, CELL SURFACE | abciximab | ABCIXIMAB | 20938371 |
| Page: 1 |

Copyright 2023-Present -The University of Texas Health Science Center at Houston |