
|
|||||
|
 | |
| |
| |
| |
| |
| |
|
Gene: FGFRL1 |
Gene summary for FGFRL1 |
| Gene information | Species | Human | Gene symbol | FGFRL1 | Gene ID | 53834 |
| Gene name | fibroblast growth factor receptor like 1 | |
| Gene Alias | FGFR-5 | |
| Cytomap | 4p16.3 | |
| Gene Type | protein-coding | GO ID | GO:0001501 | UniProtAcc | A0PJ49 |
Top |
Malignant transformation analysis |
| Identification of the aberrant gene expression in precancerous and cancerous lesions by comparing the gene expression of stem-like cells in diseased tissues with normal stem cells |
| Entrez ID | Symbol | Replicates | Species | Organ | Tissue | Adj P-value | Log2FC | Malignancy |
| 53834 | FGFRL1 | HCC1_Meng | Human | Liver | HCC | 4.54e-36 | 8.86e-02 | 0.0246 |
| 53834 | FGFRL1 | HCC2_Meng | Human | Liver | HCC | 7.29e-21 | 1.55e-01 | 0.0107 |
| 53834 | FGFRL1 | HCC1 | Human | Liver | HCC | 1.09e-13 | 3.56e+00 | 0.5336 |
| 53834 | FGFRL1 | HCC2 | Human | Liver | HCC | 3.99e-13 | 1.93e+00 | 0.5341 |
| 53834 | FGFRL1 | S014 | Human | Liver | HCC | 7.59e-17 | 6.77e-01 | 0.2254 |
| 53834 | FGFRL1 | S015 | Human | Liver | HCC | 1.23e-16 | 9.21e-01 | 0.2375 |
| 53834 | FGFRL1 | S016 | Human | Liver | HCC | 3.89e-26 | 9.29e-01 | 0.2243 |
| 53834 | FGFRL1 | S027 | Human | Liver | HCC | 3.70e-08 | 5.38e-01 | 0.2446 |
| 53834 | FGFRL1 | S028 | Human | Liver | HCC | 1.25e-21 | 7.26e-01 | 0.2503 |
| 53834 | FGFRL1 | S029 | Human | Liver | HCC | 1.22e-19 | 7.51e-01 | 0.2581 |
| 53834 | FGFRL1 | male-WTA | Human | Thyroid | PTC | 1.03e-50 | 5.20e-01 | 0.1037 |
| 53834 | FGFRL1 | PTC01 | Human | Thyroid | PTC | 1.01e-10 | 1.69e-01 | 0.1899 |
| 53834 | FGFRL1 | PTC04 | Human | Thyroid | PTC | 2.46e-22 | 4.52e-01 | 0.1927 |
| 53834 | FGFRL1 | PTC05 | Human | Thyroid | PTC | 1.44e-27 | 9.86e-01 | 0.2065 |
| 53834 | FGFRL1 | PTC06 | Human | Thyroid | PTC | 2.90e-39 | 9.26e-01 | 0.2057 |
| 53834 | FGFRL1 | PTC07 | Human | Thyroid | PTC | 8.25e-48 | 7.55e-01 | 0.2044 |
| 53834 | FGFRL1 | ATC09 | Human | Thyroid | ATC | 7.37e-08 | 2.17e-01 | 0.2871 |
| 53834 | FGFRL1 | ATC12 | Human | Thyroid | ATC | 8.01e-07 | 6.38e-02 | 0.34 |
| 53834 | FGFRL1 | ATC13 | Human | Thyroid | ATC | 5.85e-09 | 3.22e-02 | 0.34 |
| 53834 | FGFRL1 | ATC1 | Human | Thyroid | ATC | 2.66e-09 | 2.96e-01 | 0.2878 |
| Page: 1 2 |
| Tissue | Expression Dynamics | Abbreviation |
| Liver | 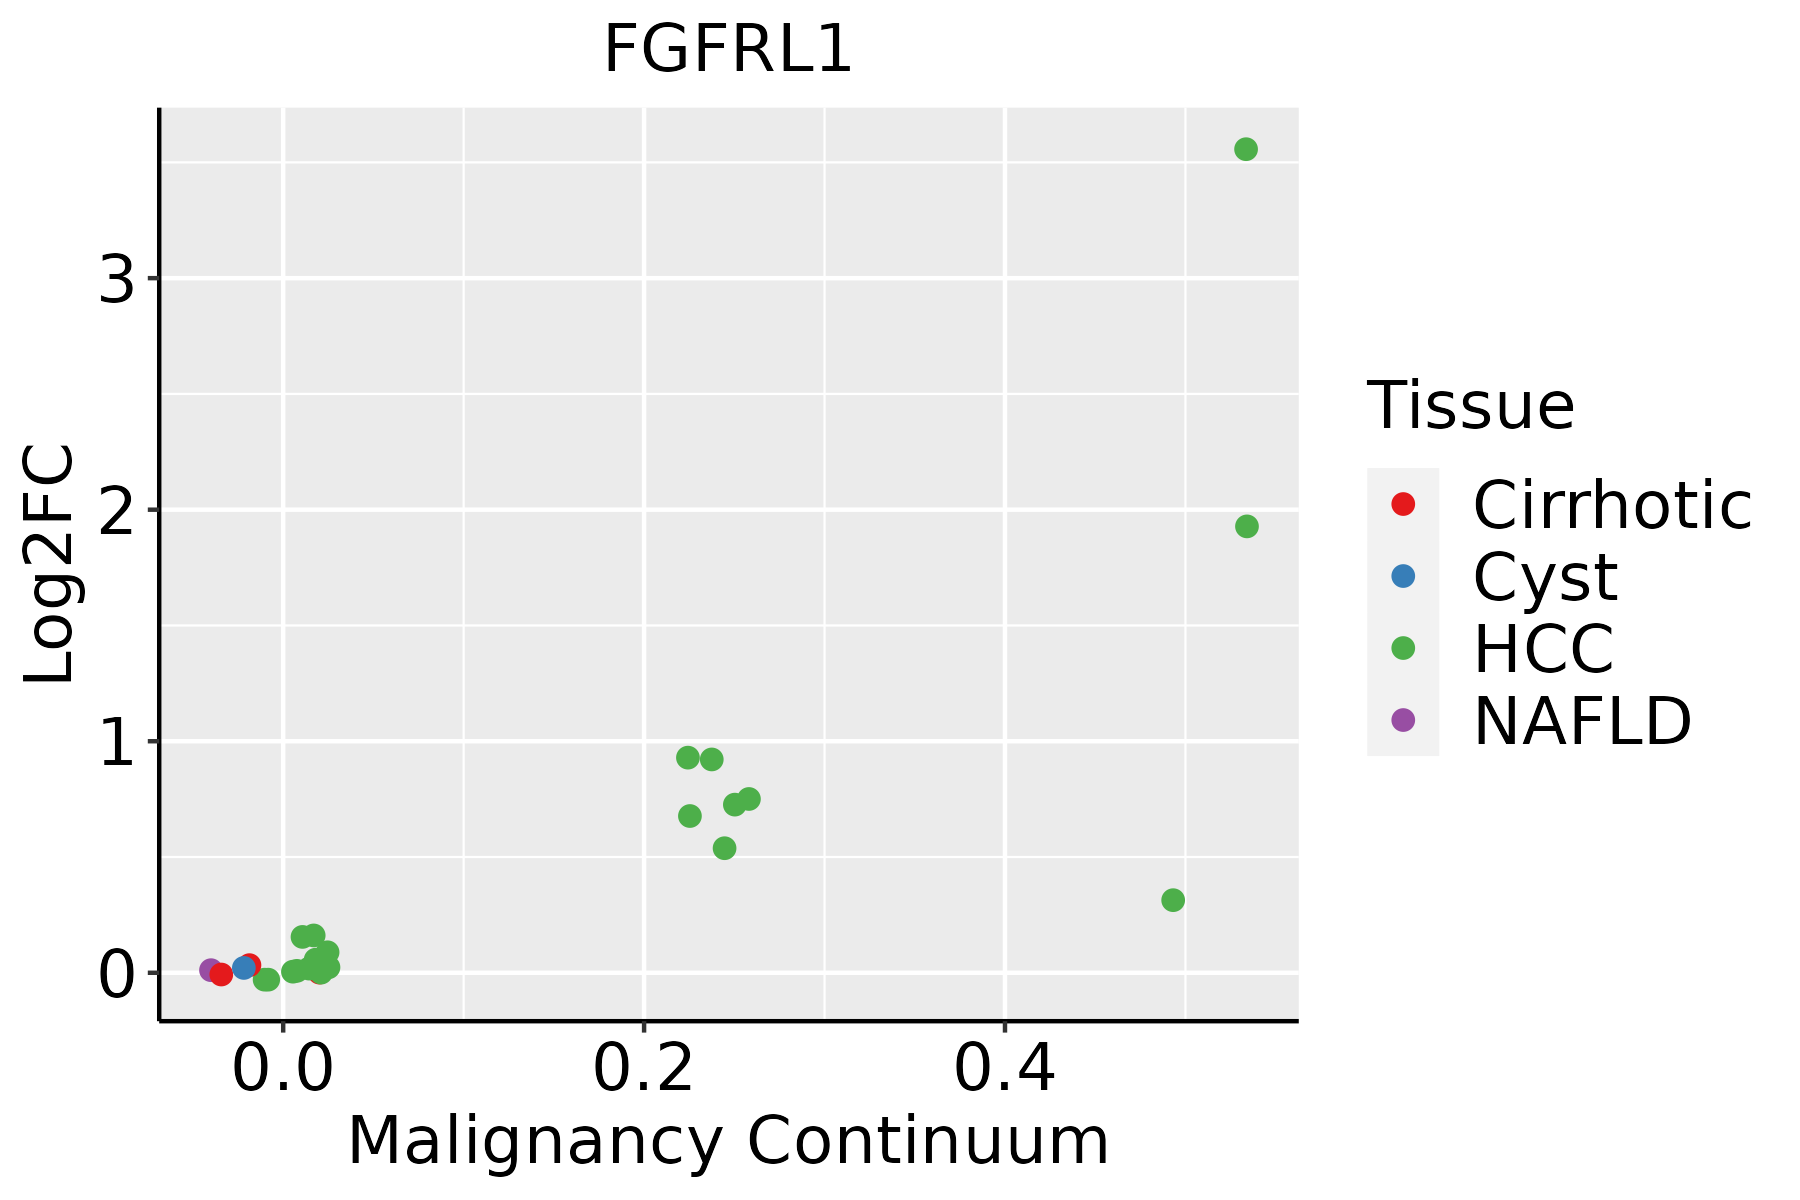 | HCC: Hepatocellular carcinoma |
| NAFLD: Non-alcoholic fatty liver disease | ||
| Thyroid | 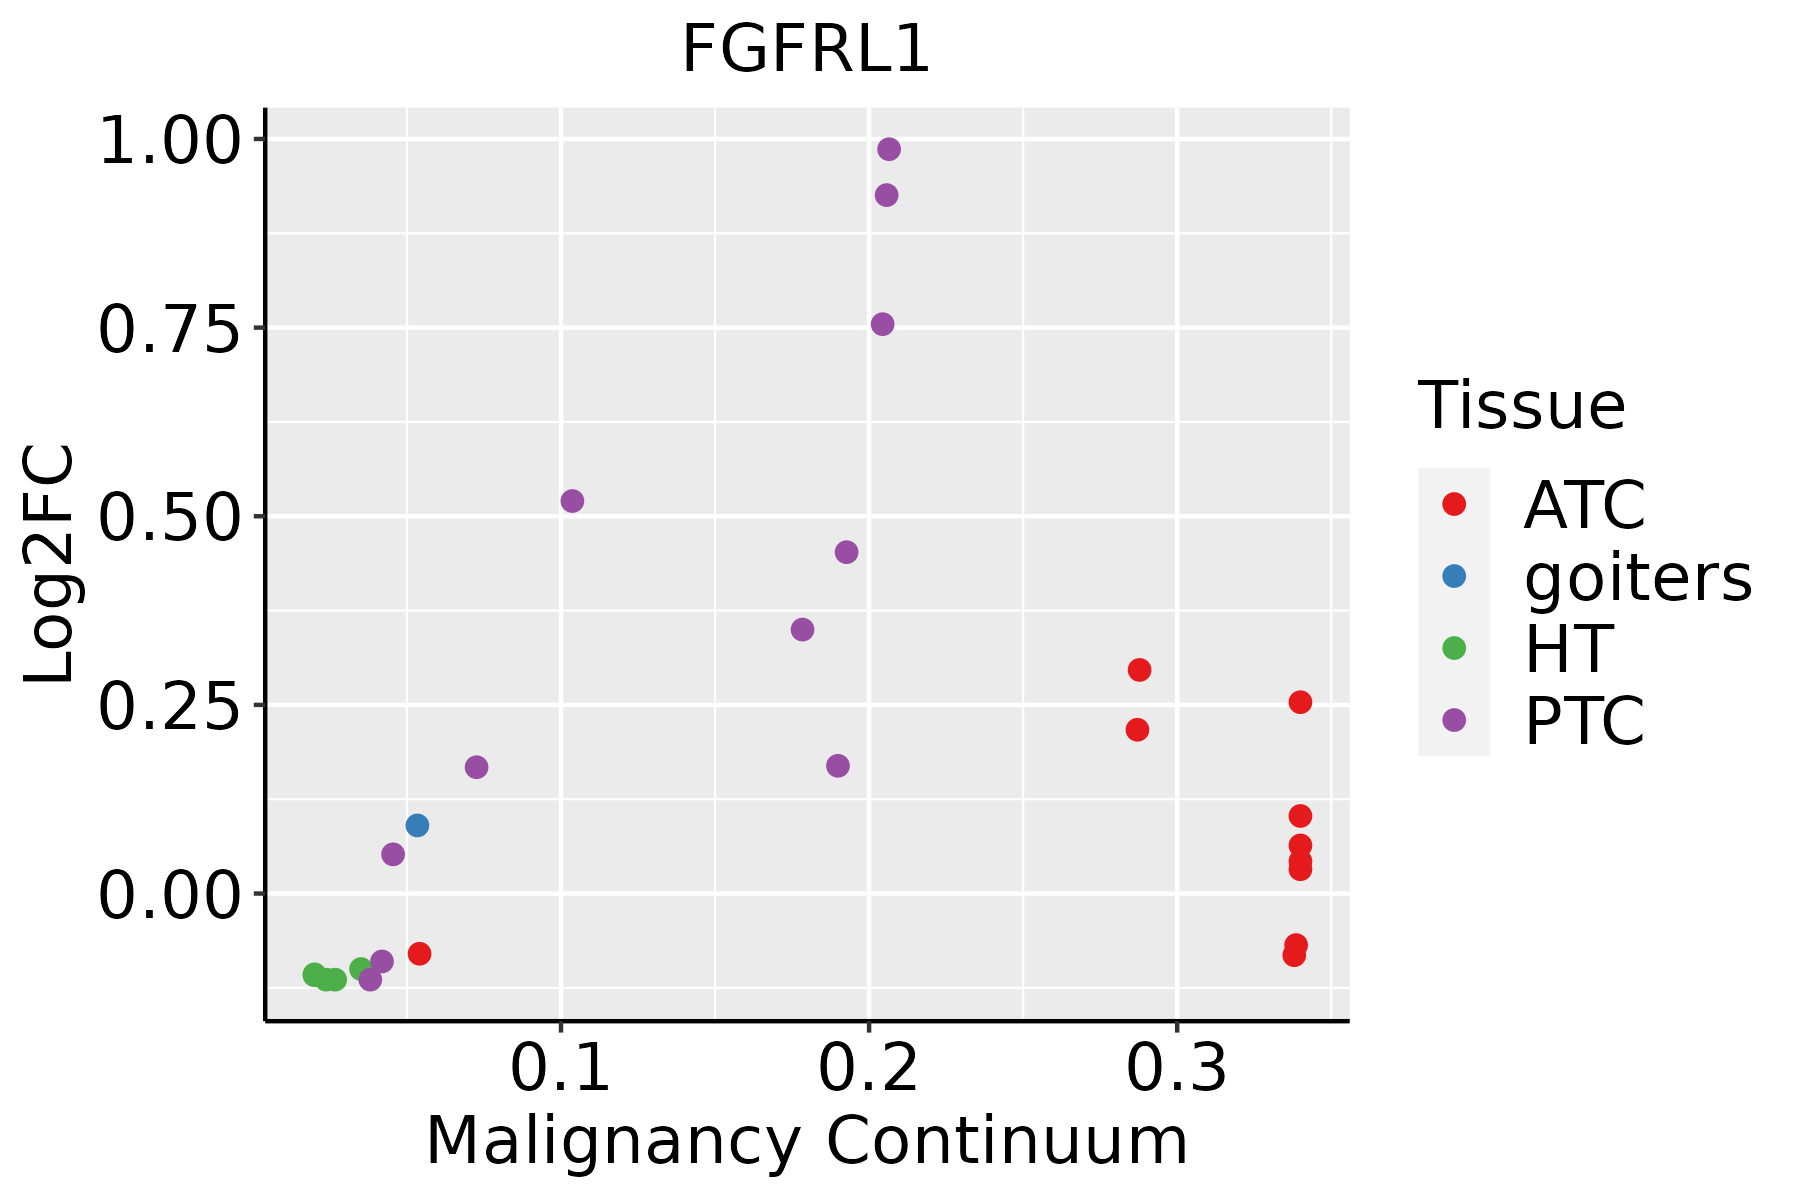 | ATC: Anaplastic thyroid cancer |
| HT: Hashimoto's thyroiditis | ||
| PTC: Papillary thyroid cancer |
| ∗log2FC in expression of this searched gene in stem-like cells from each diseased tissue sample relative to stem-like cells in normal samples in each tissue plotted against the malignancy continuum. Samples are colored based on if they are from different disease stage. |
Top |
Malignant transformation related pathway analysis |
| Find out the enriched GO biological processes and KEGG pathways involved in transition from healthy to precancer to cancer |
| Tissue | Disease Stage | Enriched GO biological Processes |
| Colorectum | AD |  |
| Colorectum | SER |  |
| Colorectum | MSS |  |
| Colorectum | MSI-H |  |
| Colorectum | FAP |  |
| ∗Top 15 enriched GO BP terms are showed in the bar plot of each disease state in each tissue. Each row represents a significant GO biological process which is colored according to the -log10(p.adjust). |
| Page: 1 2 3 4 5 6 7 8 9 |
| GO ID | Tissue | Disease Stage | Description | Gene Ratio | Bg Ratio | pvalue | p.adjust | Count |
| GO:00032794 | Thyroid | PTC | cardiac septum development | 54/5968 | 103/18723 | 1.17e-05 | 1.29e-04 | 54 |
| GO:000328112 | Thyroid | PTC | ventricular septum development | 38/5968 | 71/18723 | 1.26e-04 | 9.98e-04 | 38 |
| GO:00032055 | Thyroid | PTC | cardiac chamber development | 72/5968 | 161/18723 | 4.13e-04 | 2.77e-03 | 72 |
| GO:006054115 | Thyroid | PTC | respiratory system development | 86/5968 | 203/18723 | 1.02e-03 | 6.08e-03 | 86 |
| GO:00604112 | Thyroid | PTC | cardiac septum morphogenesis | 34/5968 | 68/18723 | 1.40e-03 | 7.84e-03 | 34 |
| GO:00032314 | Thyroid | PTC | cardiac ventricle development | 55/5968 | 123/18723 | 1.87e-03 | 1.01e-02 | 55 |
| GO:00031705 | Thyroid | PTC | heart valve development | 31/5968 | 65/18723 | 5.54e-03 | 2.52e-02 | 31 |
| GO:00032066 | Thyroid | PTC | cardiac chamber morphogenesis | 51/5968 | 121/18723 | 1.09e-02 | 4.37e-02 | 51 |
| GO:00031795 | Thyroid | PTC | heart valve morphogenesis | 26/5968 | 55/18723 | 1.21e-02 | 4.75e-02 | 26 |
| GO:0060412 | Thyroid | PTC | ventricular septum morphogenesis | 20/5968 | 40/18723 | 1.28e-02 | 4.95e-02 | 20 |
| GO:006054121 | Thyroid | ATC | respiratory system development | 100/6293 | 203/18723 | 2.66e-06 | 3.08e-05 | 100 |
| GO:000327912 | Thyroid | ATC | cardiac septum development | 56/6293 | 103/18723 | 1.14e-05 | 1.11e-04 | 56 |
| GO:000320512 | Thyroid | ATC | cardiac chamber development | 79/6293 | 161/18723 | 3.39e-05 | 2.80e-04 | 79 |
| GO:000317012 | Thyroid | ATC | heart valve development | 37/6293 | 65/18723 | 9.43e-05 | 6.91e-04 | 37 |
| GO:00030075 | Thyroid | ATC | heart morphogenesis | 110/6293 | 246/18723 | 1.76e-04 | 1.20e-03 | 110 |
| GO:000317912 | Thyroid | ATC | heart valve morphogenesis | 31/6293 | 55/18723 | 4.33e-04 | 2.59e-03 | 31 |
| GO:000751716 | Thyroid | ATC | muscle organ development | 139/6293 | 327/18723 | 4.45e-04 | 2.64e-03 | 139 |
| GO:000328121 | Thyroid | ATC | ventricular septum development | 37/6293 | 71/18723 | 9.80e-04 | 5.21e-03 | 37 |
| GO:000323111 | Thyroid | ATC | cardiac ventricle development | 58/6293 | 123/18723 | 1.23e-03 | 6.46e-03 | 58 |
| GO:000320612 | Thyroid | ATC | cardiac chamber morphogenesis | 57/6293 | 121/18723 | 1.39e-03 | 7.20e-03 | 57 |
| Page: 1 2 |
| Pathway ID | Tissue | Disease Stage | Description | Gene Ratio | Bg Ratio | pvalue | p.adjust | qvalue | Count |
| Page: 1 |
Top |
Cell-cell communication analysis |
| Identification of potential cell-cell interactions between two cell types and their ligand-receptor pairs for different disease states |
| Ligand | Receptor | LRpair | Pathway | Tissue | Disease Stage |
| Page: 1 |
Top |
Single-cell gene regulatory network inference analysis |
| Find out the significant the regulons (TFs) and the target genes of each regulon across cell types for different disease states |
| TF | Cell Type | Tissue | Disease Stage | Target Gene | RSS | Regulon Activity |
| ∗The dot plots of a searched regulon are shown for all cell subpopulations in each disease state of each tissue based on the regulon specific score inferred using pySCENIC and by calculating the average expression. |
| Page: 1 |
Top |
Somatic mutation of malignant transformation related genes |
| Annotation of somatic variants for genes involved in malignant transformation |
| Hugo Symbol | Variant Class | Variant Classification | dbSNP RS | HGVSc | HGVSp | HGVSp Short | SWISSPROT | BIOTYPE | SIFT | PolyPhen | Tumor Sample Barcode | Tissue | Histology | Sex | Age | Stage | Therapy Types | Drugs | Outcome |
| FGFRL1 | SNV | Missense_Mutation | rs767226381 | c.226N>T | p.Arg76Cys | p.R76C | Q8N441 | protein_coding | deleterious(0) | probably_damaging(1) | TCGA-AC-A8OR-01 | Breast | breast invasive carcinoma | Female | >=65 | I/II | Unknown | Unknown | SD |
| FGFRL1 | SNV | Missense_Mutation | c.443N>A | p.Arg148His | p.R148H | Q8N441 | protein_coding | deleterious(0.01) | probably_damaging(0.995) | TCGA-BH-A0HA-01 | Breast | breast invasive carcinoma | Female | <65 | I/II | Unknown | Unknown | SD | |
| FGFRL1 | SNV | Missense_Mutation | novel | c.1468T>A | p.Ser490Thr | p.S490T | Q8N441 | protein_coding | tolerated(0.12) | benign(0.026) | TCGA-BH-A18G-01 | Breast | breast invasive carcinoma | Female | >=65 | I/II | Unknown | Unknown | SD |
| FGFRL1 | SNV | Missense_Mutation | novel | c.871C>T | p.Arg291Cys | p.R291C | Q8N441 | protein_coding | deleterious(0) | benign(0.025) | TCGA-2W-A8YY-01 | Cervix | cervical & endocervical cancer | Female | <65 | I/II | Chemotherapy | cisplatin | CR |
| FGFRL1 | SNV | Missense_Mutation | rs557619683 | c.113N>A | p.Arg38Gln | p.R38Q | Q8N441 | protein_coding | deleterious(0.03) | benign(0.085) | TCGA-EA-A3HS-01 | Cervix | cervical & endocervical cancer | Female | <65 | I/II | Unknown | Unknown | SD |
| FGFRL1 | SNV | Missense_Mutation | rs755567722 | c.1358N>T | p.Pro453Leu | p.P453L | Q8N441 | protein_coding | tolerated(0.67) | benign(0) | TCGA-EA-A3HS-01 | Cervix | cervical & endocervical cancer | Female | <65 | I/II | Unknown | Unknown | SD |
| FGFRL1 | SNV | Missense_Mutation | c.1156N>A | p.Gly386Ser | p.G386S | Q8N441 | protein_coding | tolerated(0.06) | possibly_damaging(0.67) | TCGA-MU-A51Y-01 | Cervix | cervical & endocervical cancer | Female | <65 | I/II | Unknown | Unknown | SD | |
| FGFRL1 | SNV | Missense_Mutation | rs759910460 | c.1226N>T | p.Ala409Val | p.A409V | Q8N441 | protein_coding | tolerated(0.21) | benign(0.058) | TCGA-AA-3492-01 | Colorectum | colon adenocarcinoma | Female | >=65 | I/II | Unknown | Unknown | SD |
| FGFRL1 | SNV | Missense_Mutation | novel | c.1000N>T | p.Gly334Cys | p.G334C | Q8N441 | protein_coding | deleterious(0) | probably_damaging(1) | TCGA-AA-3947-01 | Colorectum | colon adenocarcinoma | Female | <65 | I/II | Unknown | Unknown | SD |
| FGFRL1 | SNV | Missense_Mutation | novel | c.769N>G | p.Thr257Ala | p.T257A | Q8N441 | protein_coding | deleterious(0) | probably_damaging(0.999) | TCGA-AD-6964-01 | Colorectum | colon adenocarcinoma | Male | <65 | III/IV | Chemotherapy | folfox | PD |
| Page: 1 2 3 4 5 |
Top |
Related drugs of malignant transformation related genes |
| Identification of chemicals and drugs interact with genes involved in malignant transfromation |
| (DGIdb 4.0) |
| Entrez ID | Symbol | Category | Interaction Types | Drug Claim Name | Drug Name | PMIDs |
| 53834 | FGFRL1 | KINASE, DRUGGABLE GENOME | brivanib | BRIVANIB | 20124951 |
| Page: 1 |

Copyright 2023-Present -The University of Texas Health Science Center at Houston |