
|
|||||
|
 | |
| |
| |
| |
| |
| |
|
Gene: FGFR4 |
Gene summary for FGFR4 |
| Gene information | Species | Human | Gene symbol | FGFR4 | Gene ID | 2264 |
| Gene name | fibroblast growth factor receptor 4 | |
| Gene Alias | CD334 | |
| Cytomap | 5q35.2 | |
| Gene Type | protein-coding | GO ID | GO:0000165 | UniProtAcc | B4DVP5 |
Top |
Malignant transformation analysis |
| Identification of the aberrant gene expression in precancerous and cancerous lesions by comparing the gene expression of stem-like cells in diseased tissues with normal stem cells |
| Entrez ID | Symbol | Replicates | Species | Organ | Tissue | Adj P-value | Log2FC | Malignancy |
| 2264 | FGFR4 | S43 | Human | Liver | Cirrhotic | 7.77e-03 | -6.34e-03 | -0.0187 |
| 2264 | FGFR4 | HCC1_Meng | Human | Liver | HCC | 7.58e-78 | 1.15e-01 | 0.0246 |
| 2264 | FGFR4 | HCC2_Meng | Human | Liver | HCC | 1.91e-19 | 1.51e-02 | 0.0107 |
| 2264 | FGFR4 | cirrhotic1 | Human | Liver | Cirrhotic | 4.22e-02 | -8.84e-03 | 0.0202 |
| 2264 | FGFR4 | cirrhotic2 | Human | Liver | Cirrhotic | 2.20e-18 | 2.61e-01 | 0.0201 |
| 2264 | FGFR4 | HCC1 | Human | Liver | HCC | 5.96e-08 | 3.19e+00 | 0.5336 |
| 2264 | FGFR4 | HCC2 | Human | Liver | HCC | 2.05e-05 | 1.42e+00 | 0.5341 |
| 2264 | FGFR4 | Pt13.b | Human | Liver | HCC | 1.67e-07 | 3.93e-02 | 0.0251 |
| 2264 | FGFR4 | Pt13.c | Human | Liver | HCC | 3.88e-03 | -2.65e-01 | 0.0076 |
| 2264 | FGFR4 | Pt14.a | Human | Liver | HCC | 1.52e-05 | 3.22e-01 | 0.0169 |
| 2264 | FGFR4 | S014 | Human | Liver | HCC | 2.54e-25 | 1.38e+00 | 0.2254 |
| 2264 | FGFR4 | S015 | Human | Liver | HCC | 2.82e-26 | 1.75e+00 | 0.2375 |
| 2264 | FGFR4 | S016 | Human | Liver | HCC | 3.18e-30 | 1.45e+00 | 0.2243 |
| 2264 | FGFR4 | S027 | Human | Liver | HCC | 8.81e-07 | 1.15e+00 | 0.2446 |
| 2264 | FGFR4 | S028 | Human | Liver | HCC | 2.43e-25 | 1.31e+00 | 0.2503 |
| 2264 | FGFR4 | S029 | Human | Liver | HCC | 2.10e-25 | 1.35e+00 | 0.2581 |
| 2264 | FGFR4 | C21 | Human | Oral cavity | OSCC | 1.77e-03 | 1.44e-01 | 0.2678 |
| 2264 | FGFR4 | LP16 | Human | Oral cavity | LP | 4.37e-10 | 1.47e+00 | 0.1055 |
| 2264 | FGFR4 | SYSMH3 | Human | Oral cavity | OSCC | 1.22e-03 | 6.54e-02 | 0.2442 |
| Page: 1 |
| Tissue | Expression Dynamics | Abbreviation |
| Liver | 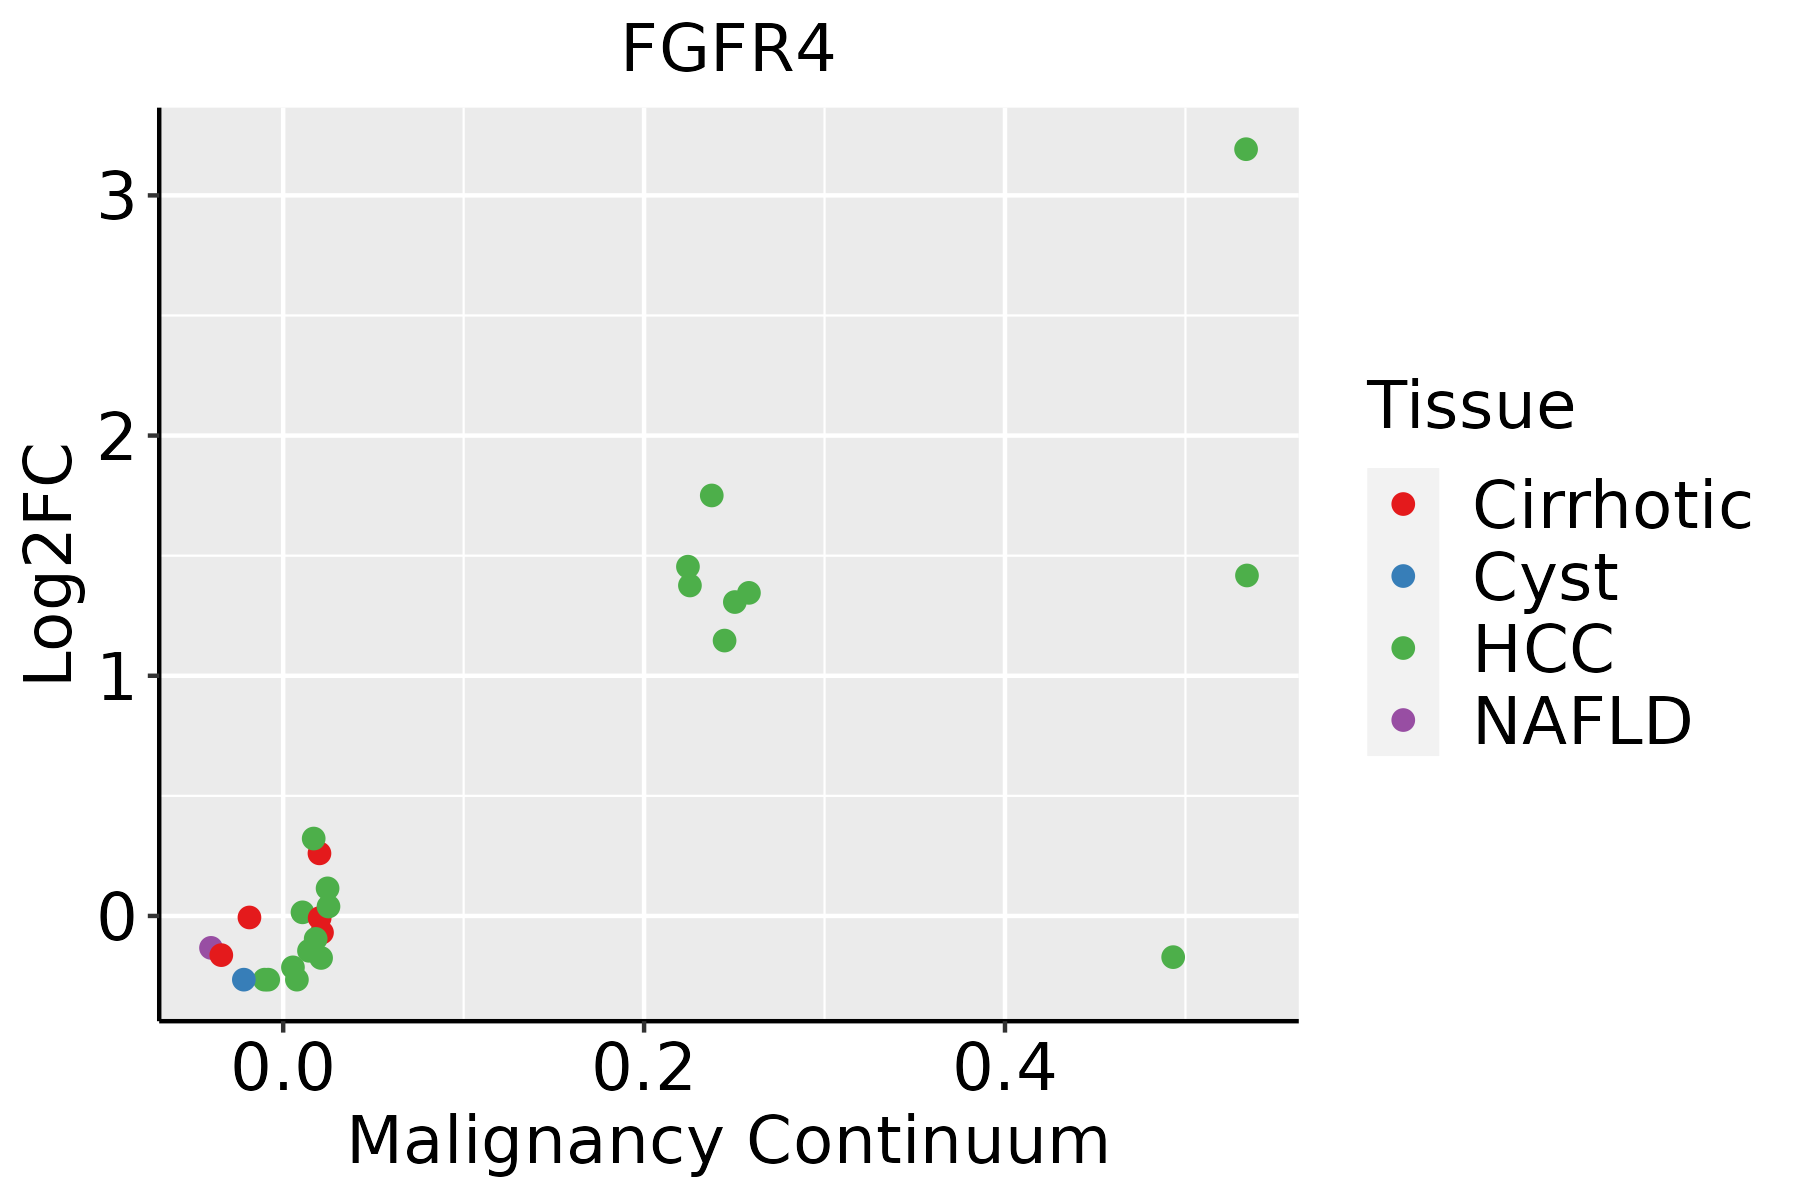 | HCC: Hepatocellular carcinoma |
| NAFLD: Non-alcoholic fatty liver disease | ||
| Oral Cavity | 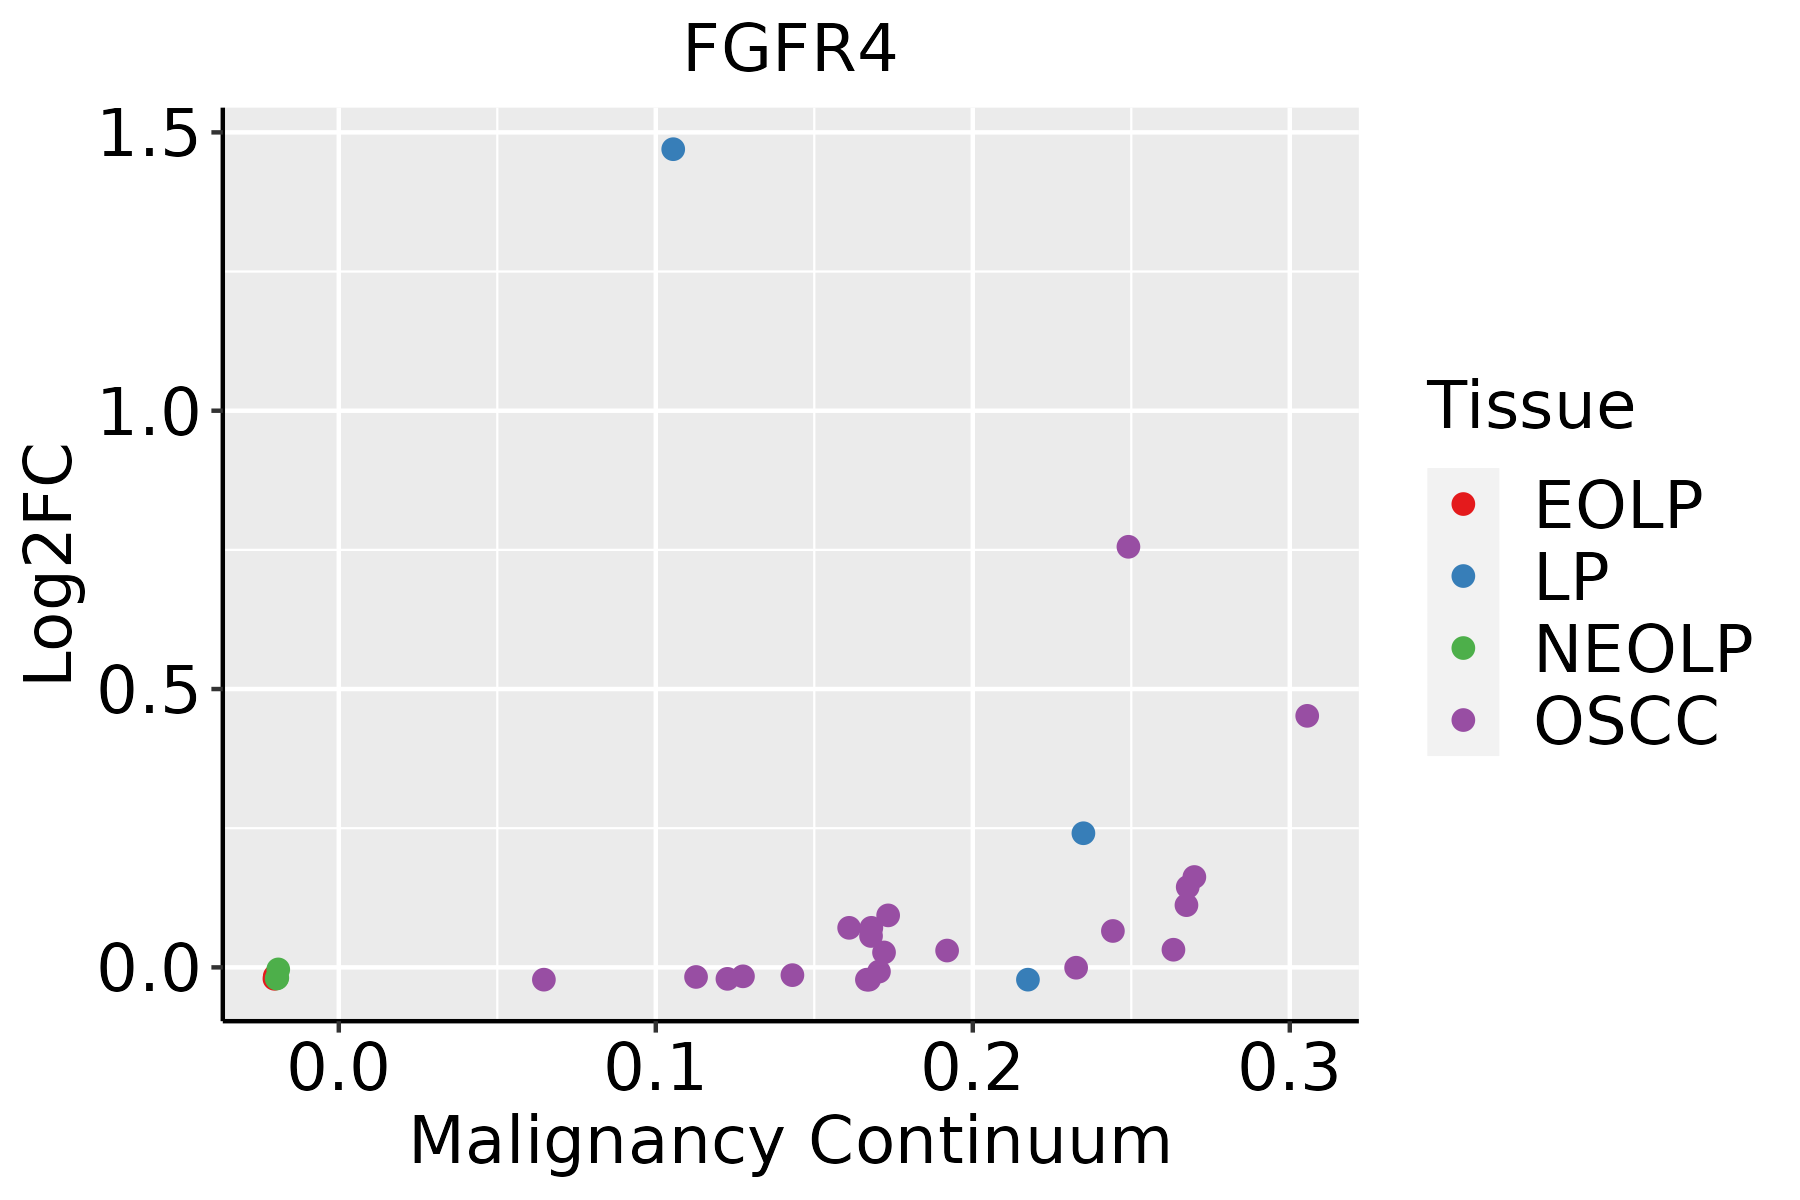 | EOLP: Erosive Oral lichen planus |
| LP: leukoplakia | ||
| NEOLP: Non-erosive oral lichen planus | ||
| OSCC: Oral squamous cell carcinoma |
| ∗log2FC in expression of this searched gene in stem-like cells from each diseased tissue sample relative to stem-like cells in normal samples in each tissue plotted against the malignancy continuum. Samples are colored based on if they are from different disease stage. |
Top |
Malignant transformation related pathway analysis |
| Find out the enriched GO biological processes and KEGG pathways involved in transition from healthy to precancer to cancer |
| Tissue | Disease Stage | Enriched GO biological Processes |
| Colorectum | AD |  |
| Colorectum | SER |  |
| Colorectum | MSS |  |
| Colorectum | MSI-H |  |
| Colorectum | FAP |  |
| ∗Top 15 enriched GO BP terms are showed in the bar plot of each disease state in each tissue. Each row represents a significant GO biological process which is colored according to the -log10(p.adjust). |
| Page: 1 2 3 4 5 6 7 8 9 |
| GO ID | Tissue | Disease Stage | Description | Gene Ratio | Bg Ratio | pvalue | p.adjust | Count |
| GO:004586212 | Liver | Cirrhotic | positive regulation of proteolysis | 163/4634 | 372/18723 | 4.18e-16 | 5.14e-14 | 163 |
| GO:000820211 | Liver | Cirrhotic | steroid metabolic process | 143/4634 | 319/18723 | 2.79e-15 | 3.18e-13 | 143 |
| GO:00224117 | Liver | Cirrhotic | cellular component disassembly | 182/4634 | 443/18723 | 1.59e-14 | 1.54e-12 | 182 |
| GO:001605312 | Liver | Cirrhotic | organic acid biosynthetic process | 139/4634 | 316/18723 | 4.28e-14 | 3.83e-12 | 139 |
| GO:004639412 | Liver | Cirrhotic | carboxylic acid biosynthetic process | 137/4634 | 314/18723 | 1.40e-13 | 1.14e-11 | 137 |
| GO:007233011 | Liver | Cirrhotic | monocarboxylic acid biosynthetic process | 93/4634 | 214/18723 | 1.43e-09 | 6.16e-08 | 93 |
| GO:00066941 | Liver | Cirrhotic | steroid biosynthetic process | 77/4634 | 173/18723 | 1.02e-08 | 3.91e-07 | 77 |
| GO:005508811 | Liver | Cirrhotic | lipid homeostasis | 74/4634 | 167/18723 | 2.46e-08 | 8.51e-07 | 74 |
| GO:006201212 | Liver | Cirrhotic | regulation of small molecule metabolic process | 124/4634 | 334/18723 | 2.74e-07 | 6.79e-06 | 124 |
| GO:004263211 | Liver | Cirrhotic | cholesterol homeostasis | 46/4634 | 96/18723 | 7.15e-07 | 1.52e-05 | 46 |
| GO:005509211 | Liver | Cirrhotic | sterol homeostasis | 46/4634 | 97/18723 | 1.04e-06 | 2.13e-05 | 46 |
| GO:001921611 | Liver | Cirrhotic | regulation of lipid metabolic process | 119/4634 | 331/18723 | 3.05e-06 | 5.39e-05 | 119 |
| GO:004218011 | Liver | Cirrhotic | cellular ketone metabolic process | 80/4634 | 211/18723 | 1.40e-05 | 1.95e-04 | 80 |
| GO:00192181 | Liver | Cirrhotic | regulation of steroid metabolic process | 44/4634 | 100/18723 | 1.97e-05 | 2.62e-04 | 44 |
| GO:004689011 | Liver | Cirrhotic | regulation of lipid biosynthetic process | 67/4634 | 171/18723 | 2.00e-05 | 2.65e-04 | 67 |
| GO:00510546 | Liver | Cirrhotic | positive regulation of DNA metabolic process | 73/4634 | 201/18723 | 1.60e-04 | 1.52e-03 | 73 |
| GO:19016171 | Liver | Cirrhotic | organic hydroxy compound biosynthetic process | 81/4634 | 237/18723 | 6.73e-04 | 5.06e-03 | 81 |
| GO:004259312 | Liver | Cirrhotic | glucose homeostasis | 86/4634 | 258/18723 | 1.12e-03 | 7.73e-03 | 86 |
| GO:001056511 | Liver | Cirrhotic | regulation of cellular ketone metabolic process | 49/4634 | 133/18723 | 1.25e-03 | 8.41e-03 | 49 |
| GO:003350012 | Liver | Cirrhotic | carbohydrate homeostasis | 86/4634 | 259/18723 | 1.28e-03 | 8.61e-03 | 86 |
| Page: 1 2 3 4 5 |
| Pathway ID | Tissue | Disease Stage | Description | Gene Ratio | Bg Ratio | pvalue | p.adjust | qvalue | Count |
| hsa0414412 | Liver | Cirrhotic | Endocytosis | 119/2530 | 251/8465 | 2.33e-09 | 4.56e-08 | 2.81e-08 | 119 |
| hsa0481021 | Liver | Cirrhotic | Regulation of actin cytoskeleton | 100/2530 | 229/8465 | 5.28e-06 | 5.50e-05 | 3.39e-05 | 100 |
| hsa0414413 | Liver | Cirrhotic | Endocytosis | 119/2530 | 251/8465 | 2.33e-09 | 4.56e-08 | 2.81e-08 | 119 |
| hsa0481031 | Liver | Cirrhotic | Regulation of actin cytoskeleton | 100/2530 | 229/8465 | 5.28e-06 | 5.50e-05 | 3.39e-05 | 100 |
| hsa0414422 | Liver | HCC | Endocytosis | 178/4020 | 251/8465 | 2.03e-14 | 5.22e-13 | 2.91e-13 | 178 |
| hsa0481041 | Liver | HCC | Regulation of actin cytoskeleton | 134/4020 | 229/8465 | 4.48e-04 | 1.94e-03 | 1.08e-03 | 134 |
| hsa0414432 | Liver | HCC | Endocytosis | 178/4020 | 251/8465 | 2.03e-14 | 5.22e-13 | 2.91e-13 | 178 |
| hsa0481051 | Liver | HCC | Regulation of actin cytoskeleton | 134/4020 | 229/8465 | 4.48e-04 | 1.94e-03 | 1.08e-03 | 134 |
| hsa0414427 | Oral cavity | OSCC | Endocytosis | 174/3704 | 251/8465 | 9.42e-17 | 4.51e-15 | 2.29e-15 | 174 |
| hsa0401014 | Oral cavity | OSCC | MAPK signaling pathway | 165/3704 | 302/8465 | 7.11e-05 | 2.74e-04 | 1.40e-04 | 165 |
| hsa0481026 | Oral cavity | OSCC | Regulation of actin cytoskeleton | 129/3704 | 229/8465 | 7.14e-05 | 2.74e-04 | 1.40e-04 | 129 |
| hsa041516 | Oral cavity | OSCC | PI3K-Akt signaling pathway | 185/3704 | 354/8465 | 6.26e-04 | 1.86e-03 | 9.49e-04 | 185 |
| hsa0401518 | Oral cavity | OSCC | Rap1 signaling pathway | 107/3704 | 210/8465 | 2.01e-02 | 4.34e-02 | 2.21e-02 | 107 |
| hsa04144112 | Oral cavity | OSCC | Endocytosis | 174/3704 | 251/8465 | 9.42e-17 | 4.51e-15 | 2.29e-15 | 174 |
| hsa0401015 | Oral cavity | OSCC | MAPK signaling pathway | 165/3704 | 302/8465 | 7.11e-05 | 2.74e-04 | 1.40e-04 | 165 |
| hsa04810111 | Oral cavity | OSCC | Regulation of actin cytoskeleton | 129/3704 | 229/8465 | 7.14e-05 | 2.74e-04 | 1.40e-04 | 129 |
| hsa0415113 | Oral cavity | OSCC | PI3K-Akt signaling pathway | 185/3704 | 354/8465 | 6.26e-04 | 1.86e-03 | 9.49e-04 | 185 |
| hsa0401519 | Oral cavity | OSCC | Rap1 signaling pathway | 107/3704 | 210/8465 | 2.01e-02 | 4.34e-02 | 2.21e-02 | 107 |
| hsa0414428 | Oral cavity | LP | Endocytosis | 121/2418 | 251/8465 | 1.89e-11 | 3.70e-10 | 2.38e-10 | 121 |
| hsa0414436 | Oral cavity | LP | Endocytosis | 121/2418 | 251/8465 | 1.89e-11 | 3.70e-10 | 2.38e-10 | 121 |
| Page: 1 |
Top |
Cell-cell communication analysis |
| Identification of potential cell-cell interactions between two cell types and their ligand-receptor pairs for different disease states |
| Ligand | Receptor | LRpair | Pathway | Tissue | Disease Stage |
| FGF1 | FGFR4 | FGF1_FGFR4 | FGF | Esophagus | ESCC |
| FGF18 | FGFR4 | FGF18_FGFR4 | FGF | Esophagus | ESCC |
| FGF19 | FGFR4 | FGF15_FGFR4 | FGF | Esophagus | ESCC |
| Page: 1 |
Top |
Single-cell gene regulatory network inference analysis |
| Find out the significant the regulons (TFs) and the target genes of each regulon across cell types for different disease states |
| TF | Cell Type | Tissue | Disease Stage | Target Gene | RSS | Regulon Activity |
| ∗The dot plots of a searched regulon are shown for all cell subpopulations in each disease state of each tissue based on the regulon specific score inferred using pySCENIC and by calculating the average expression. |
| Page: 1 |
Top |
Somatic mutation of malignant transformation related genes |
| Annotation of somatic variants for genes involved in malignant transformation |
| Hugo Symbol | Variant Class | Variant Classification | dbSNP RS | HGVSc | HGVSp | HGVSp Short | SWISSPROT | BIOTYPE | SIFT | PolyPhen | Tumor Sample Barcode | Tissue | Histology | Sex | Age | Stage | Therapy Types | Drugs | Outcome |
| FGFR4 | SNV | Missense_Mutation | c.1450N>A | p.Ala484Thr | p.A484T | P22455 | protein_coding | deleterious(0.01) | probably_damaging(0.999) | TCGA-A8-A085-01 | Breast | breast invasive carcinoma | Male | <65 | I/II | Hormone Therapy | tamoxiphen | SD | |
| FGFR4 | SNV | Missense_Mutation | rs143108014 | c.976G>A | p.Glu326Lys | p.E326K | P22455 | protein_coding | deleterious(0.03) | probably_damaging(0.997) | TCGA-AR-A0TX-01 | Breast | breast invasive carcinoma | Female | <65 | I/II | Unknown | Unknown | SD |
| FGFR4 | SNV | Missense_Mutation | rs143758924 | c.2248N>A | p.Val750Ile | p.V750I | P22455 | protein_coding | tolerated(0.13) | benign(0.001) | TCGA-OL-A5D7-01 | Breast | breast invasive carcinoma | Female | >=65 | I/II | Chemotherapy | cytoxan | CR |
| FGFR4 | SNV | Missense_Mutation | novel | c.1441G>A | p.Val481Ile | p.V481I | P22455 | protein_coding | deleterious(0) | probably_damaging(0.971) | TCGA-2W-A8YY-01 | Cervix | cervical & endocervical cancer | Female | <65 | I/II | Chemotherapy | cisplatin | CR |
| FGFR4 | SNV | Missense_Mutation | c.2254G>A | p.Glu752Lys | p.E752K | P22455 | protein_coding | deleterious(0.01) | benign(0.433) | TCGA-EK-A2PG-01 | Cervix | cervical & endocervical cancer | Female | >=65 | I/II | Unknown | Unknown | SD | |
| FGFR4 | SNV | Missense_Mutation | c.1987N>C | p.Asp663His | p.D663H | P22455 | protein_coding | deleterious(0.05) | probably_damaging(1) | TCGA-JW-A5VJ-01 | Cervix | cervical & endocervical cancer | Female | <65 | I/II | Unknown | Unknown | PD | |
| FGFR4 | SNV | Missense_Mutation | rs201490532 | c.2167N>T | p.Arg723Cys | p.R723C | P22455 | protein_coding | deleterious(0.02) | probably_damaging(0.999) | TCGA-A6-5665-01 | Colorectum | colon adenocarcinoma | Female | >=65 | I/II | Unknown | Unknown | PD |
| FGFR4 | SNV | Missense_Mutation | rs148292303 | c.784N>A | p.Val262Met | p.V262M | P22455 | protein_coding | deleterious(0.02) | benign(0.182) | TCGA-AA-3712-01 | Colorectum | colon adenocarcinoma | Male | >=65 | III/IV | Unknown | Unknown | SD |
| FGFR4 | SNV | Missense_Mutation | c.1748N>A | p.Pro583Gln | p.P583Q | P22455 | protein_coding | tolerated(1) | benign(0.014) | TCGA-AA-3811-01 | Colorectum | colon adenocarcinoma | Female | >=65 | III/IV | Unknown | Unknown | PD | |
| FGFR4 | SNV | Missense_Mutation | c.1840G>T | p.Ala614Ser | p.A614S | P22455 | protein_coding | deleterious(0) | probably_damaging(0.999) | TCGA-AA-3821-01 | Colorectum | colon adenocarcinoma | Female | >=65 | I/II | Unknown | Unknown | SD |
| Page: 1 2 3 4 5 6 7 8 9 |
Top |
Related drugs of malignant transformation related genes |
| Identification of chemicals and drugs interact with genes involved in malignant transfromation |
| (DGIdb 4.0) |
| Entrez ID | Symbol | Category | Interaction Types | Drug Claim Name | Drug Name | PMIDs |
| 2264 | FGFR4 | CLINICALLY ACTIONABLE, KINASE, DRUGGABLE GENOME, ENZYME, DRUG RESISTANCE, TYROSINE KINASE | inhibitor | 354702260 | DEBIO-1347 | |
| 2264 | FGFR4 | CLINICALLY ACTIONABLE, KINASE, DRUGGABLE GENOME, ENZYME, DRUG RESISTANCE, TYROSINE KINASE | inhibitor | BGJ398 | INFIGRATINIB | |
| 2264 | FGFR4 | CLINICALLY ACTIONABLE, KINASE, DRUGGABLE GENOME, ENZYME, DRUG RESISTANCE, TYROSINE KINASE | inhibitor | 223366040 | ||
| 2264 | FGFR4 | CLINICALLY ACTIONABLE, KINASE, DRUGGABLE GENOME, ENZYME, DRUG RESISTANCE, TYROSINE KINASE | inhibitor | 249565784 | LY-2874455 | |
| 2264 | FGFR4 | CLINICALLY ACTIONABLE, KINASE, DRUGGABLE GENOME, ENZYME, DRUG RESISTANCE, TYROSINE KINASE | DOVITINIB | DOVITINIB | ||
| 2264 | FGFR4 | CLINICALLY ACTIONABLE, KINASE, DRUGGABLE GENOME, ENZYME, DRUG RESISTANCE, TYROSINE KINASE | inhibitor | 381744902 | ||
| 2264 | FGFR4 | CLINICALLY ACTIONABLE, KINASE, DRUGGABLE GENOME, ENZYME, DRUG RESISTANCE, TYROSINE KINASE | ERLOTINIB | ERLOTINIB | 31027687 | |
| 2264 | FGFR4 | CLINICALLY ACTIONABLE, KINASE, DRUGGABLE GENOME, ENZYME, DRUG RESISTANCE, TYROSINE KINASE | everolimus | EVEROLIMUS | ||
| 2264 | FGFR4 | CLINICALLY ACTIONABLE, KINASE, DRUGGABLE GENOME, ENZYME, DRUG RESISTANCE, TYROSINE KINASE | inhibitor | 354702241 | ||
| 2264 | FGFR4 | CLINICALLY ACTIONABLE, KINASE, DRUGGABLE GENOME, ENZYME, DRUG RESISTANCE, TYROSINE KINASE | brivanib | BRIVANIB | 20124951 |
| Page: 1 2 3 4 5 |

Copyright 2023-Present -The University of Texas Health Science Center at Houston |