
|
|||||
|
 | |
| |
| |
| |
| |
| |
|
Gene: FGFR1OP2 |
Gene summary for FGFR1OP2 |
| Gene information | Species | Human | Gene symbol | FGFR1OP2 | Gene ID | 26127 |
| Gene name | FGFR1 oncogene partner 2 | |
| Gene Alias | HSPC123-like | |
| Cytomap | 12p11.23 | |
| Gene Type | protein-coding | GO ID | GO:0006950 | UniProtAcc | Q9NVK5 |
Top |
Malignant transformation analysis |
| Identification of the aberrant gene expression in precancerous and cancerous lesions by comparing the gene expression of stem-like cells in diseased tissues with normal stem cells |
| Entrez ID | Symbol | Replicates | Species | Organ | Tissue | Adj P-value | Log2FC | Malignancy |
| 26127 | FGFR1OP2 | LZE3D | Human | Esophagus | HGIN | 2.07e-02 | 5.06e-01 | 0.0668 |
| 26127 | FGFR1OP2 | LZE4T | Human | Esophagus | ESCC | 1.13e-15 | 3.51e-01 | 0.0811 |
| 26127 | FGFR1OP2 | LZE5T | Human | Esophagus | ESCC | 1.75e-02 | 1.08e-01 | 0.0514 |
| 26127 | FGFR1OP2 | LZE7T | Human | Esophagus | ESCC | 1.74e-05 | 4.61e-01 | 0.0667 |
| 26127 | FGFR1OP2 | LZE8T | Human | Esophagus | ESCC | 2.08e-20 | 5.95e-01 | 0.067 |
| 26127 | FGFR1OP2 | LZE20T | Human | Esophagus | ESCC | 9.51e-15 | 3.10e-01 | 0.0662 |
| 26127 | FGFR1OP2 | LZE22T | Human | Esophagus | ESCC | 2.04e-07 | 3.18e-01 | 0.068 |
| 26127 | FGFR1OP2 | LZE24T | Human | Esophagus | ESCC | 1.48e-23 | 5.60e-01 | 0.0596 |
| 26127 | FGFR1OP2 | LZE21T | Human | Esophagus | ESCC | 6.98e-04 | 3.94e-01 | 0.0655 |
| 26127 | FGFR1OP2 | LZE6T | Human | Esophagus | ESCC | 4.43e-08 | 3.57e-01 | 0.0845 |
| 26127 | FGFR1OP2 | P2T-E | Human | Esophagus | ESCC | 2.40e-44 | 8.97e-01 | 0.1177 |
| 26127 | FGFR1OP2 | P4T-E | Human | Esophagus | ESCC | 3.11e-35 | 8.39e-01 | 0.1323 |
| 26127 | FGFR1OP2 | P5T-E | Human | Esophagus | ESCC | 2.64e-28 | 4.38e-01 | 0.1327 |
| 26127 | FGFR1OP2 | P8T-E | Human | Esophagus | ESCC | 4.85e-36 | 6.60e-01 | 0.0889 |
| 26127 | FGFR1OP2 | P9T-E | Human | Esophagus | ESCC | 2.39e-17 | 3.39e-01 | 0.1131 |
| 26127 | FGFR1OP2 | P10T-E | Human | Esophagus | ESCC | 7.48e-41 | 7.16e-01 | 0.116 |
| 26127 | FGFR1OP2 | P11T-E | Human | Esophagus | ESCC | 1.00e-11 | 4.13e-01 | 0.1426 |
| 26127 | FGFR1OP2 | P12T-E | Human | Esophagus | ESCC | 2.44e-54 | 1.07e+00 | 0.1122 |
| 26127 | FGFR1OP2 | P15T-E | Human | Esophagus | ESCC | 6.48e-24 | 5.95e-01 | 0.1149 |
| 26127 | FGFR1OP2 | P16T-E | Human | Esophagus | ESCC | 1.04e-86 | 1.67e+00 | 0.1153 |
| Page: 1 2 3 4 5 6 |
| Tissue | Expression Dynamics | Abbreviation |
| Esophagus | 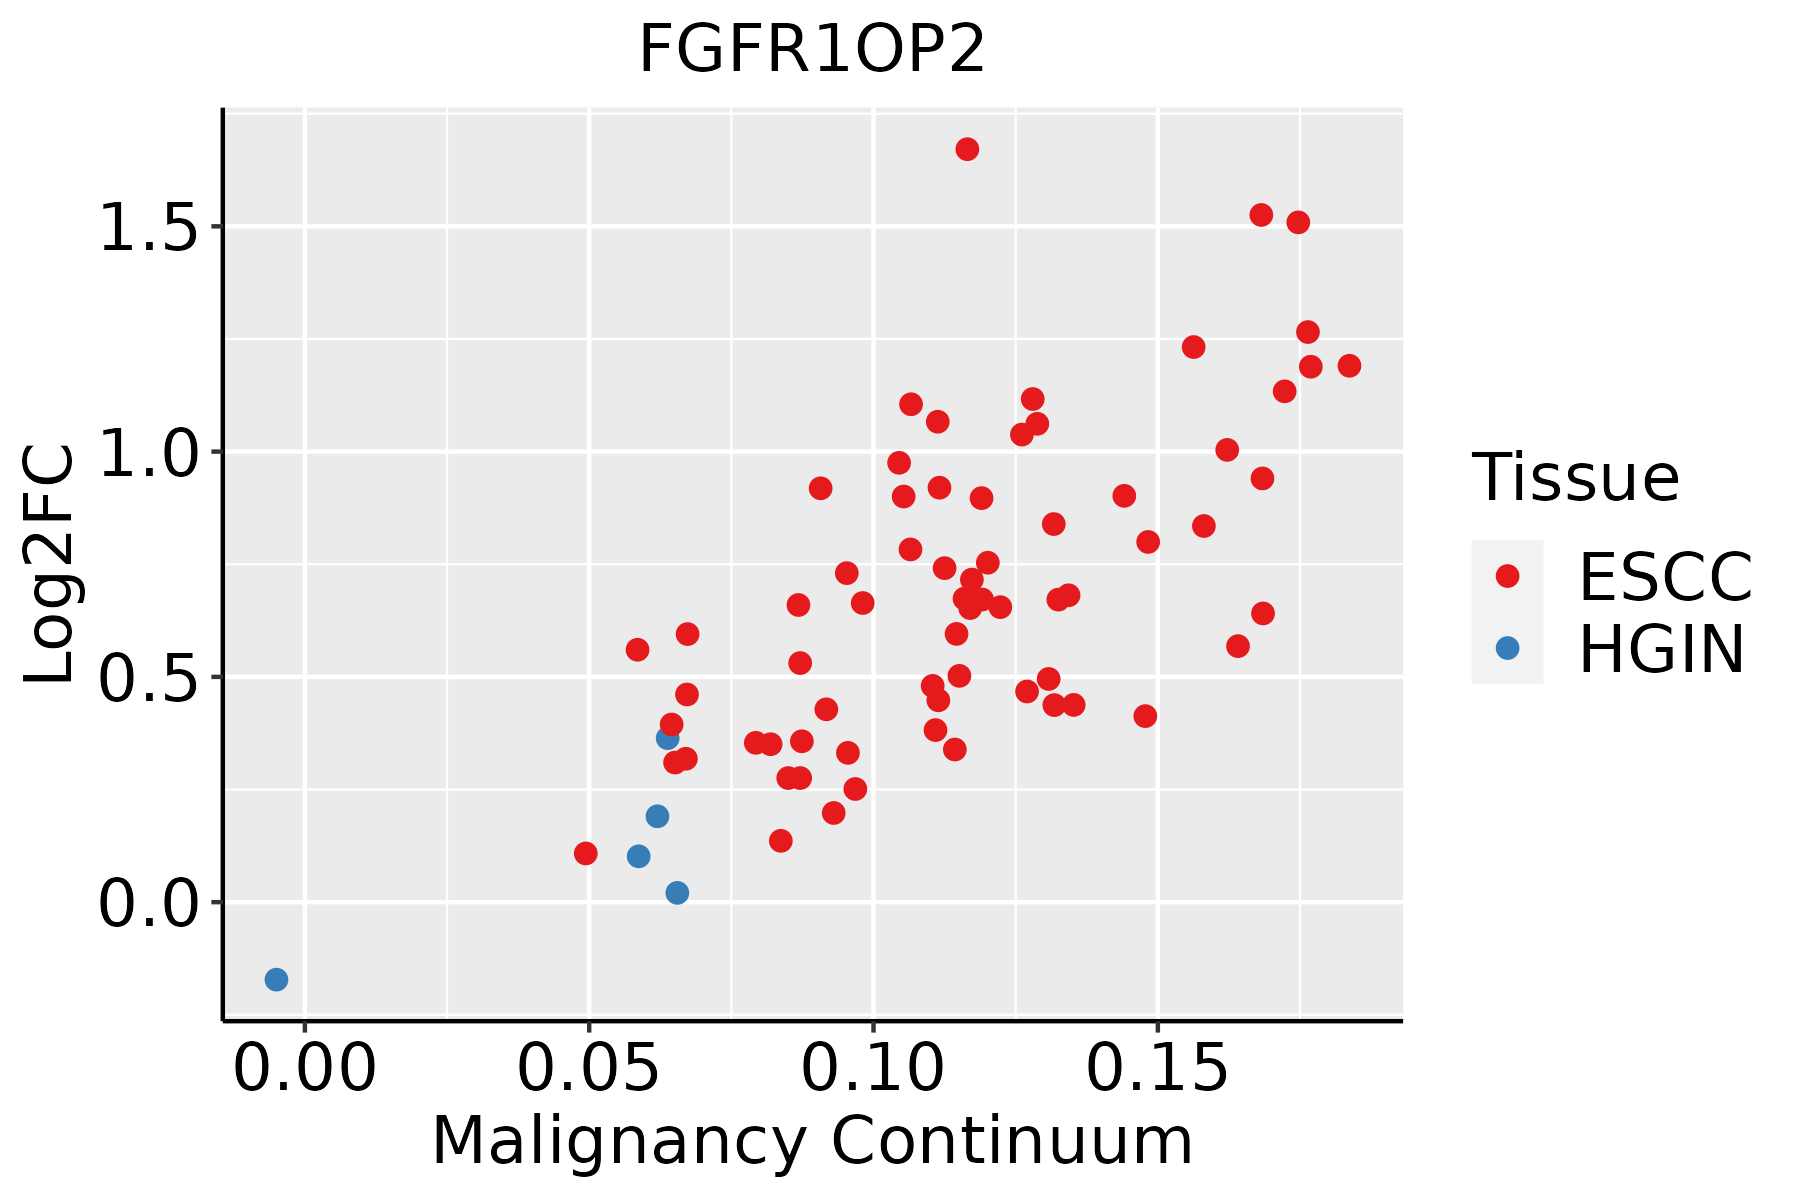 | ESCC: Esophageal squamous cell carcinoma |
| HGIN: High-grade intraepithelial neoplasias | ||
| LGIN: Low-grade intraepithelial neoplasias | ||
| Liver | 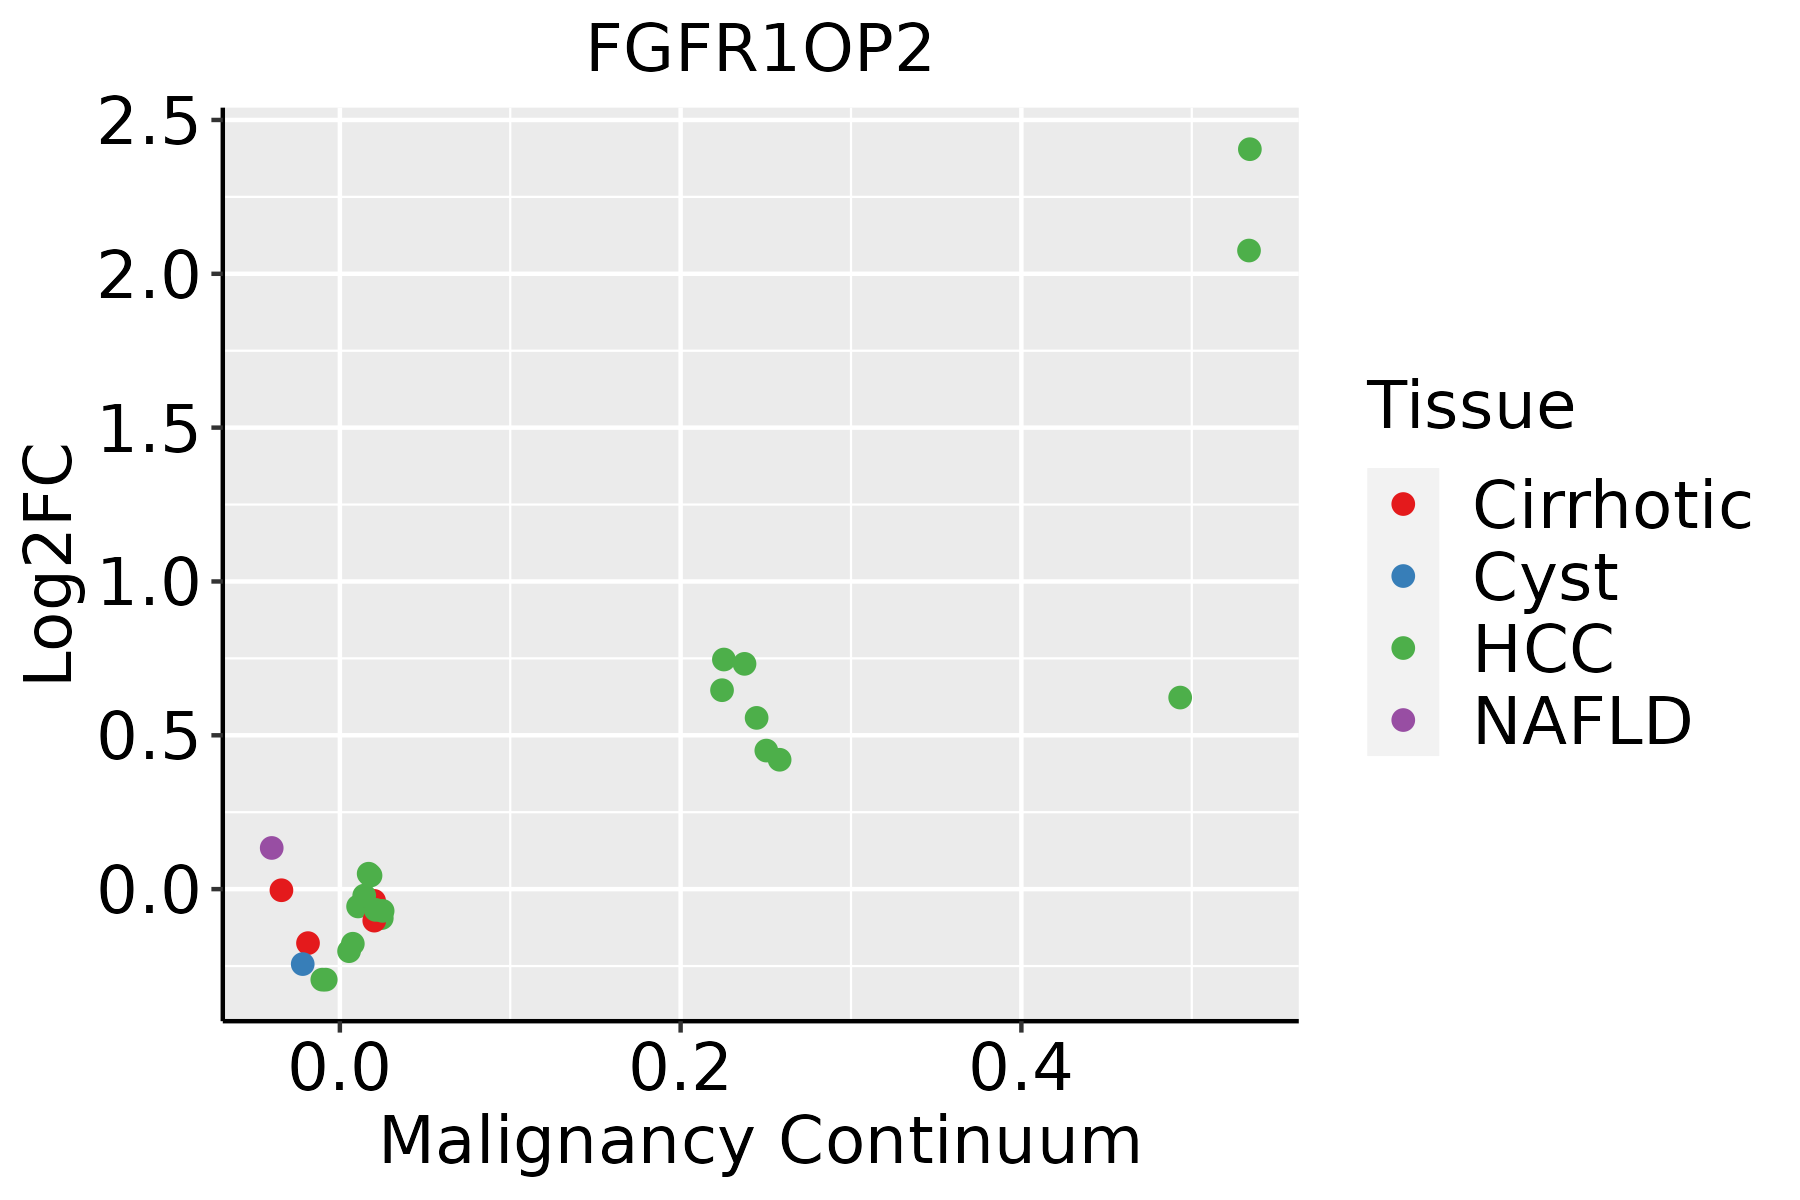 | HCC: Hepatocellular carcinoma |
| NAFLD: Non-alcoholic fatty liver disease | ||
| Oral Cavity | 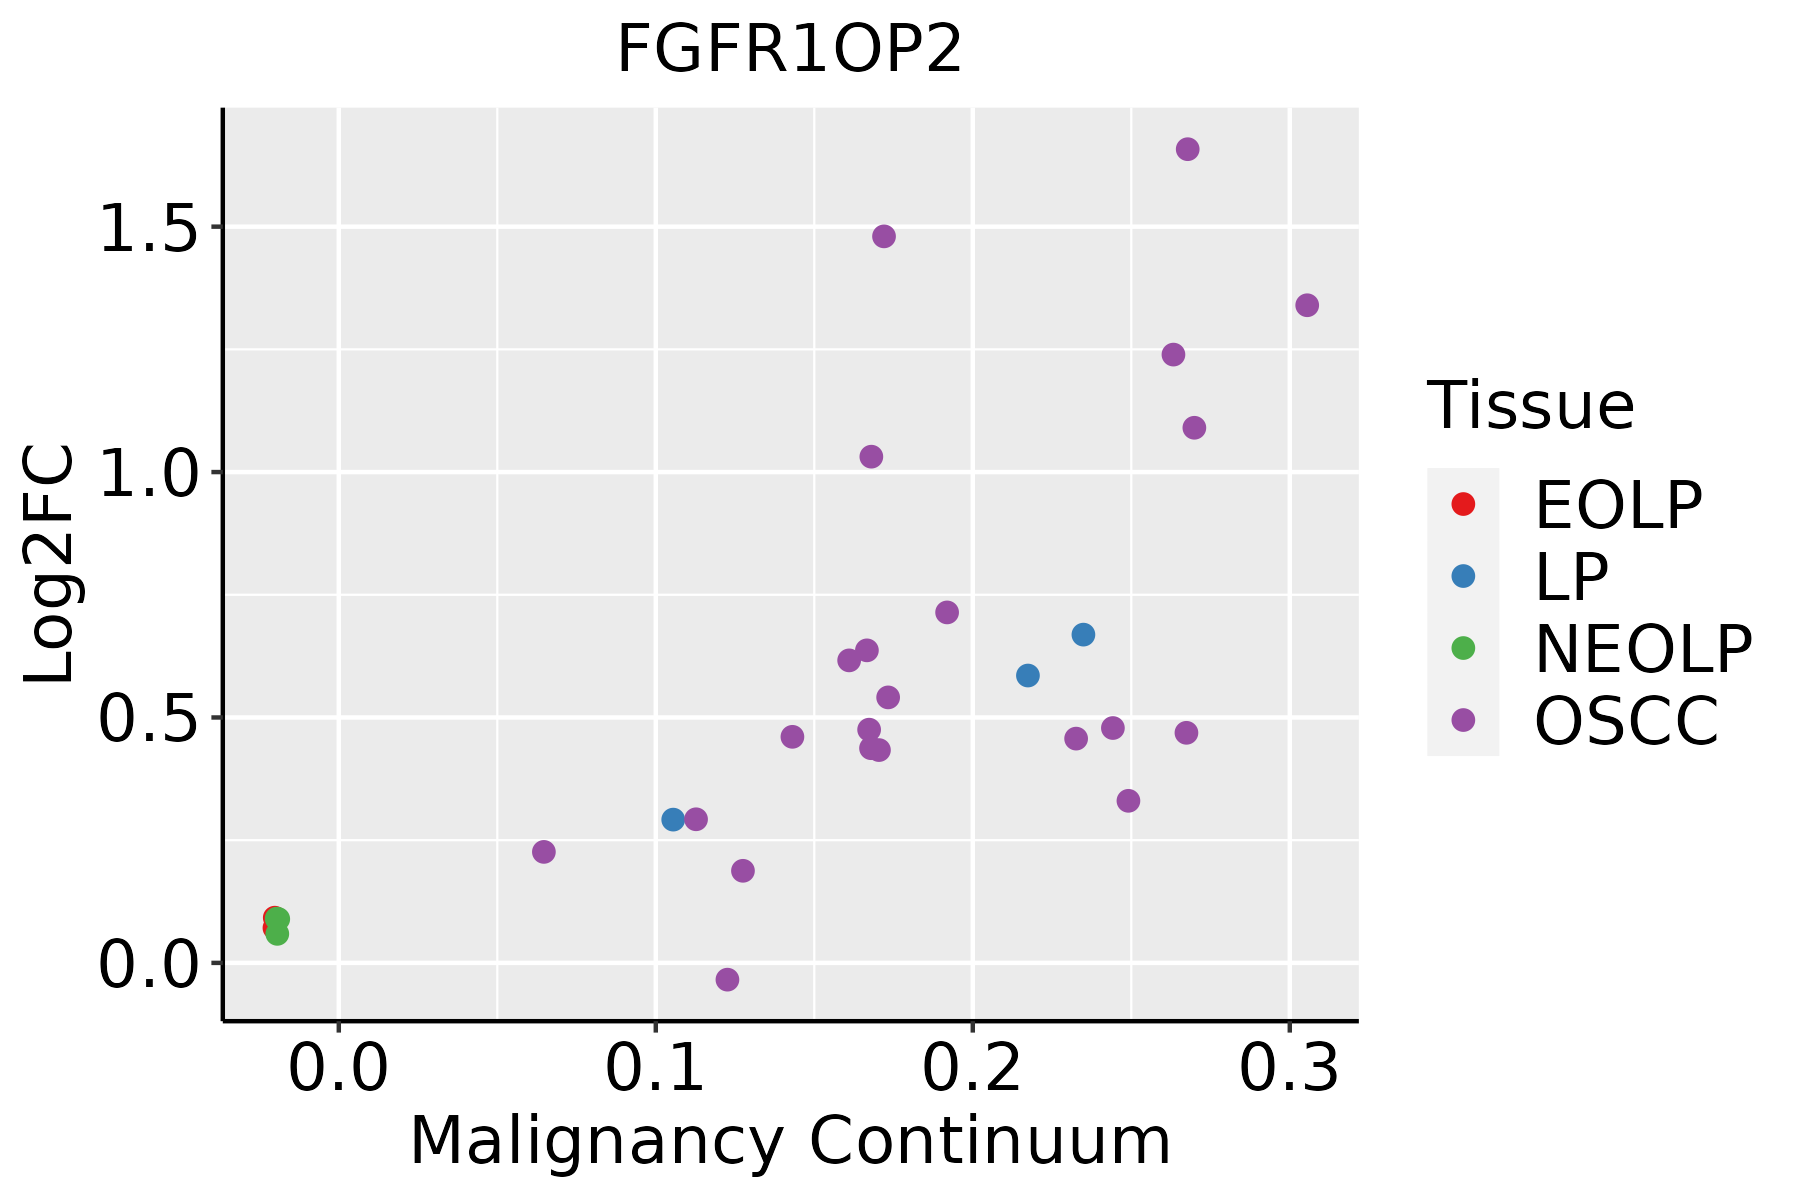 | EOLP: Erosive Oral lichen planus |
| LP: leukoplakia | ||
| NEOLP: Non-erosive oral lichen planus | ||
| OSCC: Oral squamous cell carcinoma | ||
| Thyroid | 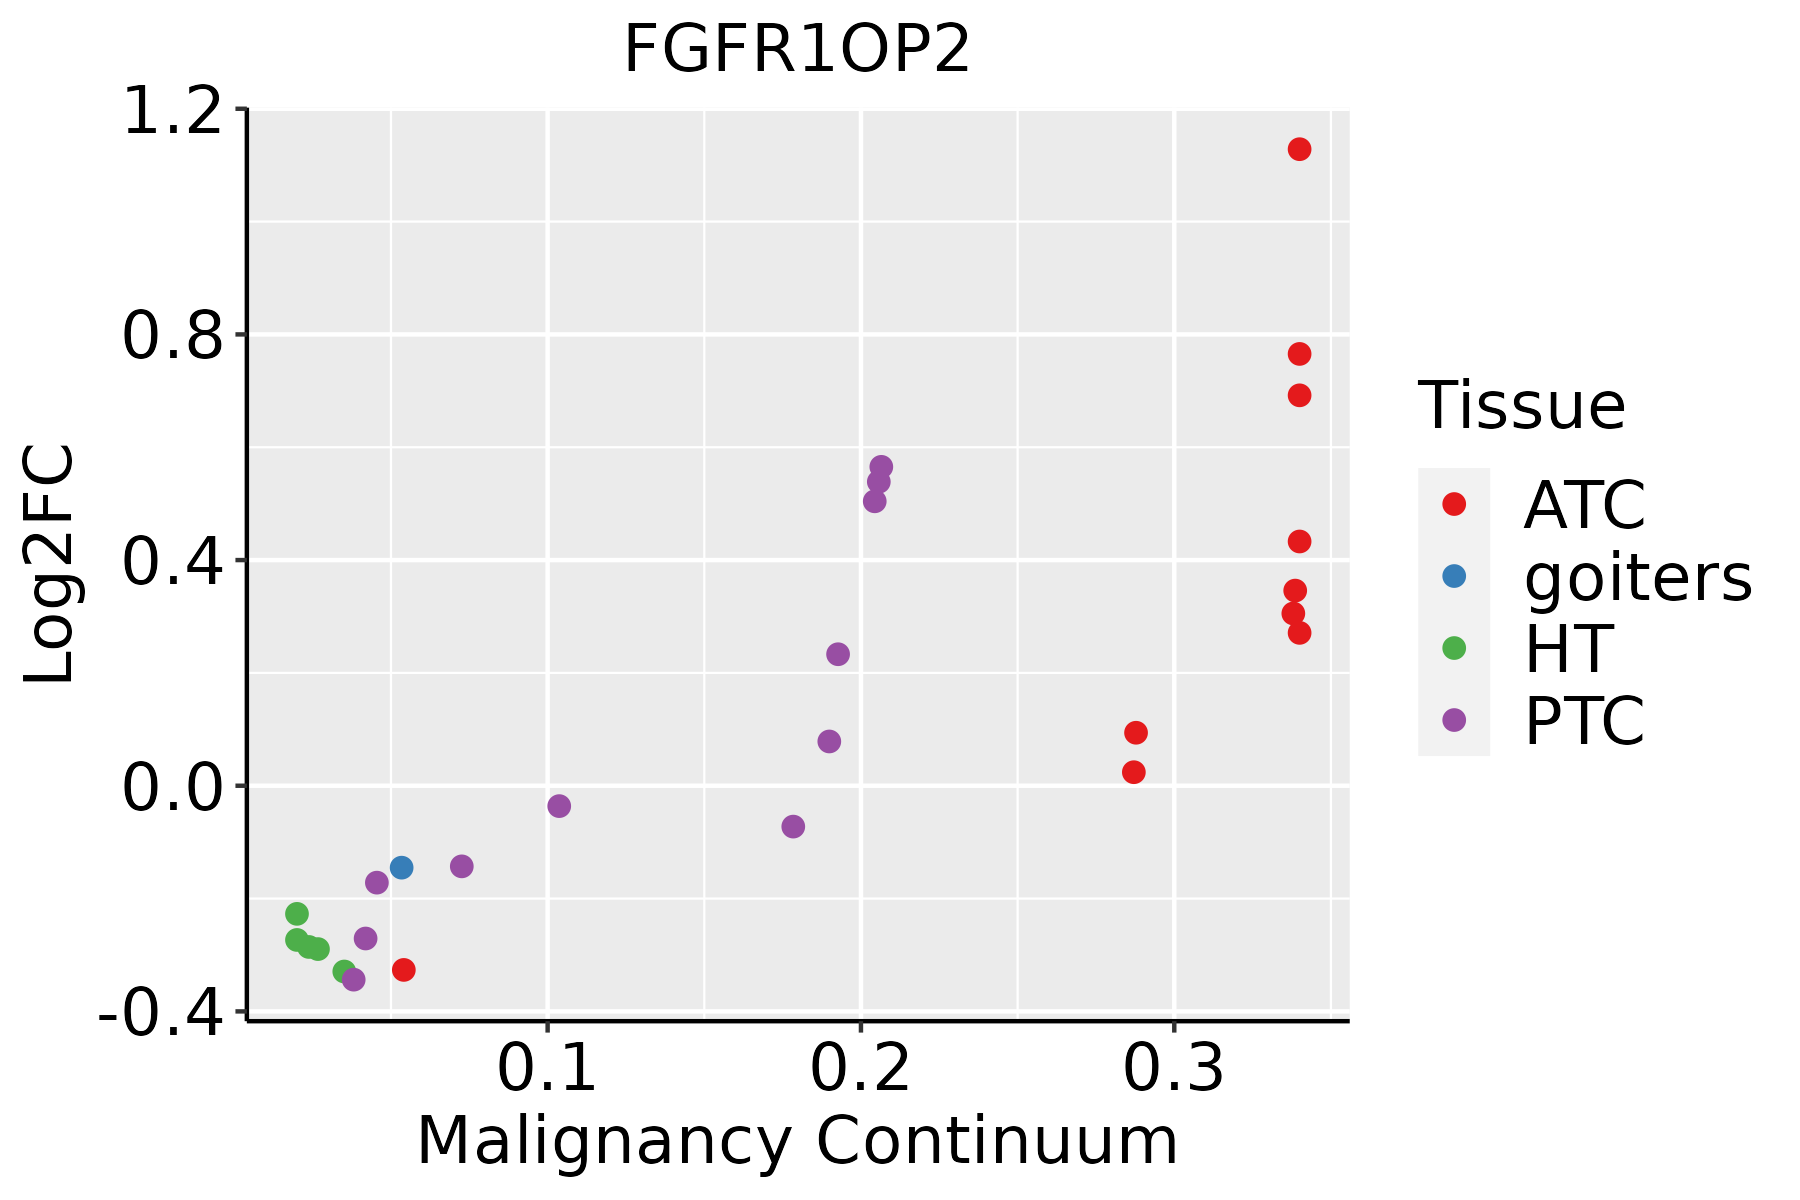 | ATC: Anaplastic thyroid cancer |
| HT: Hashimoto's thyroiditis | ||
| PTC: Papillary thyroid cancer |
| ∗log2FC in expression of this searched gene in stem-like cells from each diseased tissue sample relative to stem-like cells in normal samples in each tissue plotted against the malignancy continuum. Samples are colored based on if they are from different disease stage. |
Top |
Malignant transformation related pathway analysis |
| Find out the enriched GO biological processes and KEGG pathways involved in transition from healthy to precancer to cancer |
| Tissue | Disease Stage | Enriched GO biological Processes |
| Colorectum | AD |  |
| Colorectum | SER |  |
| Colorectum | MSS |  |
| Colorectum | MSI-H |  |
| Colorectum | FAP |  |
| ∗Top 15 enriched GO BP terms are showed in the bar plot of each disease state in each tissue. Each row represents a significant GO biological process which is colored according to the -log10(p.adjust). |
| Page: 1 2 3 4 5 6 7 8 9 |
| GO ID | Tissue | Disease Stage | Description | Gene Ratio | Bg Ratio | pvalue | p.adjust | Count |
| GO:004206027 | Esophagus | ESCC | wound healing | 243/8552 | 422/18723 | 4.62e-07 | 6.25e-06 | 243 |
| GO:004206012 | Liver | Cirrhotic | wound healing | 155/4634 | 422/18723 | 2.12e-08 | 7.56e-07 | 155 |
| GO:004206022 | Liver | HCC | wound healing | 219/7958 | 422/18723 | 5.34e-05 | 5.04e-04 | 219 |
| GO:004206020 | Oral cavity | OSCC | wound healing | 237/7305 | 422/18723 | 4.51e-13 | 2.18e-11 | 237 |
| GO:0042060110 | Oral cavity | LP | wound healing | 139/4623 | 422/18723 | 7.10e-05 | 9.48e-04 | 139 |
| GO:004206030 | Thyroid | HT | wound healing | 60/1272 | 422/18723 | 4.06e-08 | 2.69e-06 | 60 |
| GO:0042060112 | Thyroid | PTC | wound healing | 190/5968 | 422/18723 | 7.72e-09 | 1.92e-07 | 190 |
| GO:004206034 | Thyroid | ATC | wound healing | 210/6293 | 422/18723 | 3.33e-12 | 1.37e-10 | 210 |
| Page: 1 |
| Pathway ID | Tissue | Disease Stage | Description | Gene Ratio | Bg Ratio | pvalue | p.adjust | qvalue | Count |
| Page: 1 |
Top |
Cell-cell communication analysis |
| Identification of potential cell-cell interactions between two cell types and their ligand-receptor pairs for different disease states |
| Ligand | Receptor | LRpair | Pathway | Tissue | Disease Stage |
| Page: 1 |
Top |
Single-cell gene regulatory network inference analysis |
| Find out the significant the regulons (TFs) and the target genes of each regulon across cell types for different disease states |
| TF | Cell Type | Tissue | Disease Stage | Target Gene | RSS | Regulon Activity |
| ∗The dot plots of a searched regulon are shown for all cell subpopulations in each disease state of each tissue based on the regulon specific score inferred using pySCENIC and by calculating the average expression. |
| Page: 1 |
Top |
Somatic mutation of malignant transformation related genes |
| Annotation of somatic variants for genes involved in malignant transformation |
| Hugo Symbol | Variant Class | Variant Classification | dbSNP RS | HGVSc | HGVSp | HGVSp Short | SWISSPROT | BIOTYPE | SIFT | PolyPhen | Tumor Sample Barcode | Tissue | Histology | Sex | Age | Stage | Therapy Types | Drugs | Outcome |
| FGFR1OP2 | deletion | Frame_Shift_Del | novel | c.562delN | p.Ala189ProfsTer26 | p.A189Pfs*26 | Q9NVK5 | protein_coding | TCGA-EW-A2FV-01 | Breast | breast invasive carcinoma | Female | <65 | III/IV | Chemotherapy | docetaxel | SD | ||
| FGFR1OP2 | SNV | Missense_Mutation | c.571N>A | p.Glu191Lys | p.E191K | Q9NVK5 | protein_coding | deleterious(0.02) | benign(0.062) | TCGA-FU-A23K-01 | Cervix | cervical & endocervical cancer | Female | <65 | III/IV | Unknown | Unknown | SD | |
| FGFR1OP2 | SNV | Missense_Mutation | novel | c.535N>G | p.Ile179Val | p.I179V | Q9NVK5 | protein_coding | tolerated(0.08) | possibly_damaging(0.51) | TCGA-ZJ-AAXN-01 | Cervix | cervical & endocervical cancer | Female | <65 | I/II | Unknown | Unknown | SD |
| FGFR1OP2 | SNV | Missense_Mutation | rs761470386 | c.178N>T | p.Arg60Trp | p.R60W | Q9NVK5 | protein_coding | deleterious(0) | probably_damaging(0.999) | TCGA-A6-5661-01 | Colorectum | colon adenocarcinoma | Female | >=65 | I/II | Unknown | Unknown | SD |
| FGFR1OP2 | SNV | Missense_Mutation | c.469N>A | p.Gln157Lys | p.Q157K | Q9NVK5 | protein_coding | tolerated_low_confidence(1) | possibly_damaging(0.893) | TCGA-DM-A28A-01 | Colorectum | colon adenocarcinoma | Male | >=65 | III/IV | Unknown | Unknown | SD | |
| FGFR1OP2 | SNV | Missense_Mutation | rs144332739 | c.449N>A | p.Arg150Gln | p.R150Q | Q9NVK5 | protein_coding | tolerated_low_confidence(0.41) | benign(0.003) | TCGA-AG-A002-01 | Colorectum | rectum adenocarcinoma | Male | <65 | I/II | Unknown | Unknown | SD |
| FGFR1OP2 | SNV | Missense_Mutation | novel | c.507G>T | p.Gln169His | p.Q169H | Q9NVK5 | protein_coding | tolerated(0.34) | benign(0.001) | TCGA-A5-A0G2-01 | Endometrium | uterine corpus endometrioid carcinoma | Female | <65 | III/IV | Unknown | Unknown | SD |
| FGFR1OP2 | SNV | Missense_Mutation | novel | c.565G>T | p.Ala189Ser | p.A189S | Q9NVK5 | protein_coding | deleterious(0.01) | probably_damaging(0.985) | TCGA-A5-A0G2-01 | Endometrium | uterine corpus endometrioid carcinoma | Female | <65 | III/IV | Unknown | Unknown | SD |
| FGFR1OP2 | SNV | Missense_Mutation | novel | c.638G>A | p.Gly213Asp | p.G213D | Q9NVK5 | protein_coding | tolerated(0.37) | benign(0.049) | TCGA-AX-A06F-01 | Endometrium | uterine corpus endometrioid carcinoma | Female | <65 | III/IV | Chemotherapy | carboplatin | SD |
| FGFR1OP2 | SNV | Missense_Mutation | c.722C>T | p.Ala241Val | p.A241V | Q9NVK5 | protein_coding | tolerated_low_confidence(0.13) | benign(0.001) | TCGA-B5-A11N-01 | Endometrium | uterine corpus endometrioid carcinoma | Female | >=65 | I/II | Unknown | Unknown | SD |
| Page: 1 2 3 |
Top |
Related drugs of malignant transformation related genes |
| Identification of chemicals and drugs interact with genes involved in malignant transfromation |
| (DGIdb 4.0) |
| Entrez ID | Symbol | Category | Interaction Types | Drug Claim Name | Drug Name | PMIDs |
| 26127 | FGFR1OP2 | NA | brivanib | BRIVANIB | 20124951 |
| Page: 1 |

Copyright 2023-Present -The University of Texas Health Science Center at Houston |