
|
|||||
|
 | |
| |
| |
| |
| |
| |
|
Gene: FGFBP1 |
Gene summary for FGFBP1 |
| Gene information | Species | Human | Gene symbol | FGFBP1 | Gene ID | 9982 |
| Gene name | fibroblast growth factor binding protein 1 | |
| Gene Alias | FGF-BP | |
| Cytomap | 4p15.32 | |
| Gene Type | protein-coding | GO ID | GO:0001525 | UniProtAcc | Q14512 |
Top |
Malignant transformation analysis |
| Identification of the aberrant gene expression in precancerous and cancerous lesions by comparing the gene expression of stem-like cells in diseased tissues with normal stem cells |
| Entrez ID | Symbol | Replicates | Species | Organ | Tissue | Adj P-value | Log2FC | Malignancy |
| 9982 | FGFBP1 | CA_HPV_1 | Human | Cervix | CC | 3.98e-07 | -2.78e-01 | 0.0264 |
| 9982 | FGFBP1 | HSIL_HPV_1 | Human | Cervix | HSIL_HPV | 4.06e-07 | -3.11e-01 | 0.0116 |
| 9982 | FGFBP1 | Tumor | Human | Cervix | CC | 2.27e-15 | 5.83e-01 | 0.1241 |
| 9982 | FGFBP1 | sample3 | Human | Cervix | CC | 1.92e-21 | 6.07e-01 | 0.1387 |
| 9982 | FGFBP1 | H2 | Human | Cervix | HSIL_HPV | 3.54e-04 | -2.60e-01 | 0.0632 |
| 9982 | FGFBP1 | T3 | Human | Cervix | CC | 1.43e-21 | 6.23e-01 | 0.1389 |
| 9982 | FGFBP1 | LZE2D | Human | Esophagus | HGIN | 5.63e-08 | -1.68e-01 | 0.0642 |
| 9982 | FGFBP1 | LZE5T | Human | Esophagus | ESCC | 7.14e-08 | -9.62e-01 | 0.0514 |
| 9982 | FGFBP1 | LZE7T | Human | Esophagus | ESCC | 3.47e-04 | 1.19e+00 | 0.0667 |
| 9982 | FGFBP1 | LZE8T | Human | Esophagus | ESCC | 3.03e-03 | 1.60e+00 | 0.067 |
| 9982 | FGFBP1 | LZE21D1 | Human | Esophagus | HGIN | 5.19e-07 | 9.89e-02 | 0.0632 |
| 9982 | FGFBP1 | LZE22D1 | Human | Esophagus | HGIN | 8.21e-04 | -5.30e-01 | 0.0595 |
| 9982 | FGFBP1 | LZE24T | Human | Esophagus | ESCC | 4.54e-07 | -9.37e-02 | 0.0596 |
| 9982 | FGFBP1 | LZE6T | Human | Esophagus | ESCC | 9.45e-12 | -9.22e-01 | 0.0845 |
| 9982 | FGFBP1 | P1T-E | Human | Esophagus | ESCC | 2.58e-06 | -7.46e-01 | 0.0875 |
| 9982 | FGFBP1 | P2T-E | Human | Esophagus | ESCC | 1.78e-03 | -4.42e-01 | 0.1177 |
| 9982 | FGFBP1 | P8T-E | Human | Esophagus | ESCC | 1.22e-08 | -3.91e-01 | 0.0889 |
| 9982 | FGFBP1 | P11T-E | Human | Esophagus | ESCC | 1.86e-02 | 2.18e-02 | 0.1426 |
| 9982 | FGFBP1 | P16T-E | Human | Esophagus | ESCC | 3.49e-28 | -9.77e-01 | 0.1153 |
| 9982 | FGFBP1 | P20T-E | Human | Esophagus | ESCC | 2.32e-06 | -5.90e-01 | 0.1124 |
| Page: 1 2 3 4 |
| Tissue | Expression Dynamics | Abbreviation |
| Cervix | 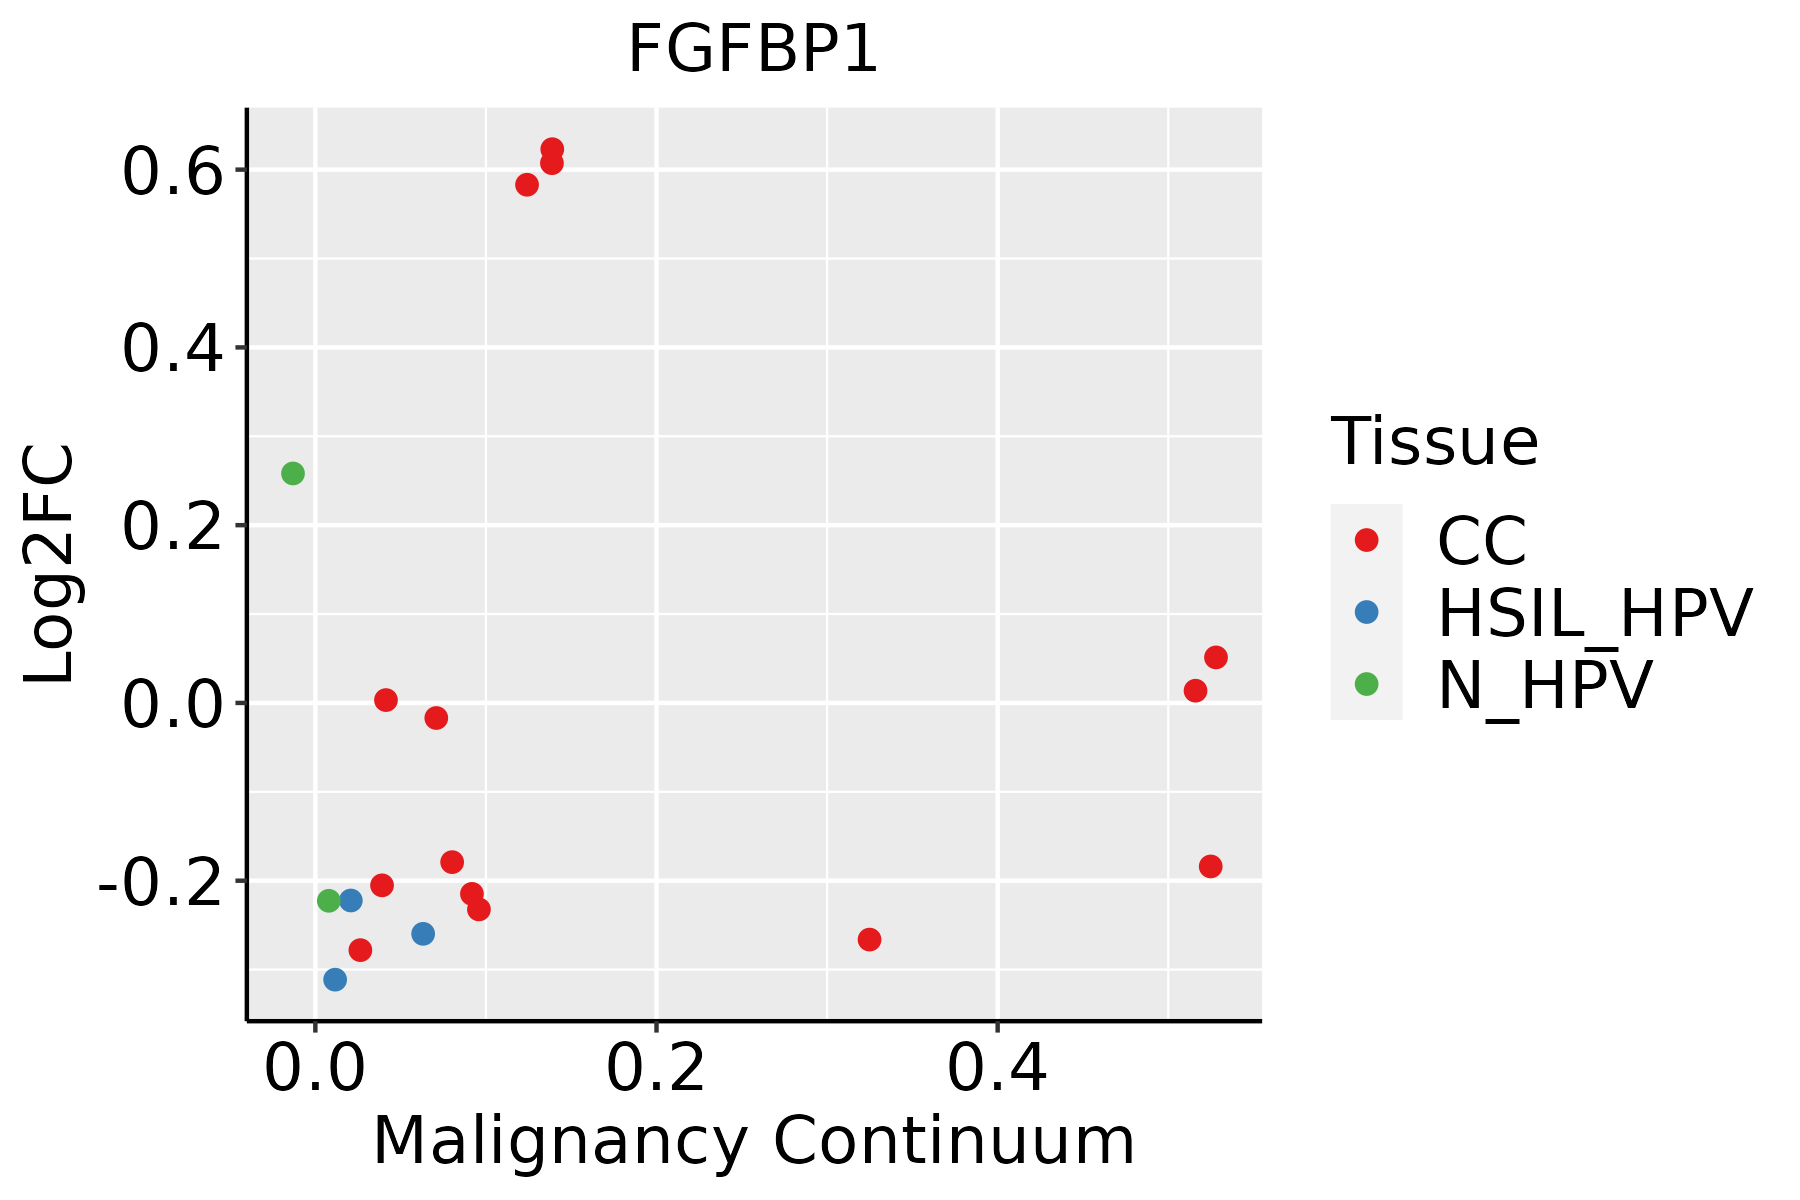 | CC: Cervix cancer |
| HSIL_HPV: HPV-infected high-grade squamous intraepithelial lesions | ||
| N_HPV: HPV-infected normal cervix | ||
| Esophagus | 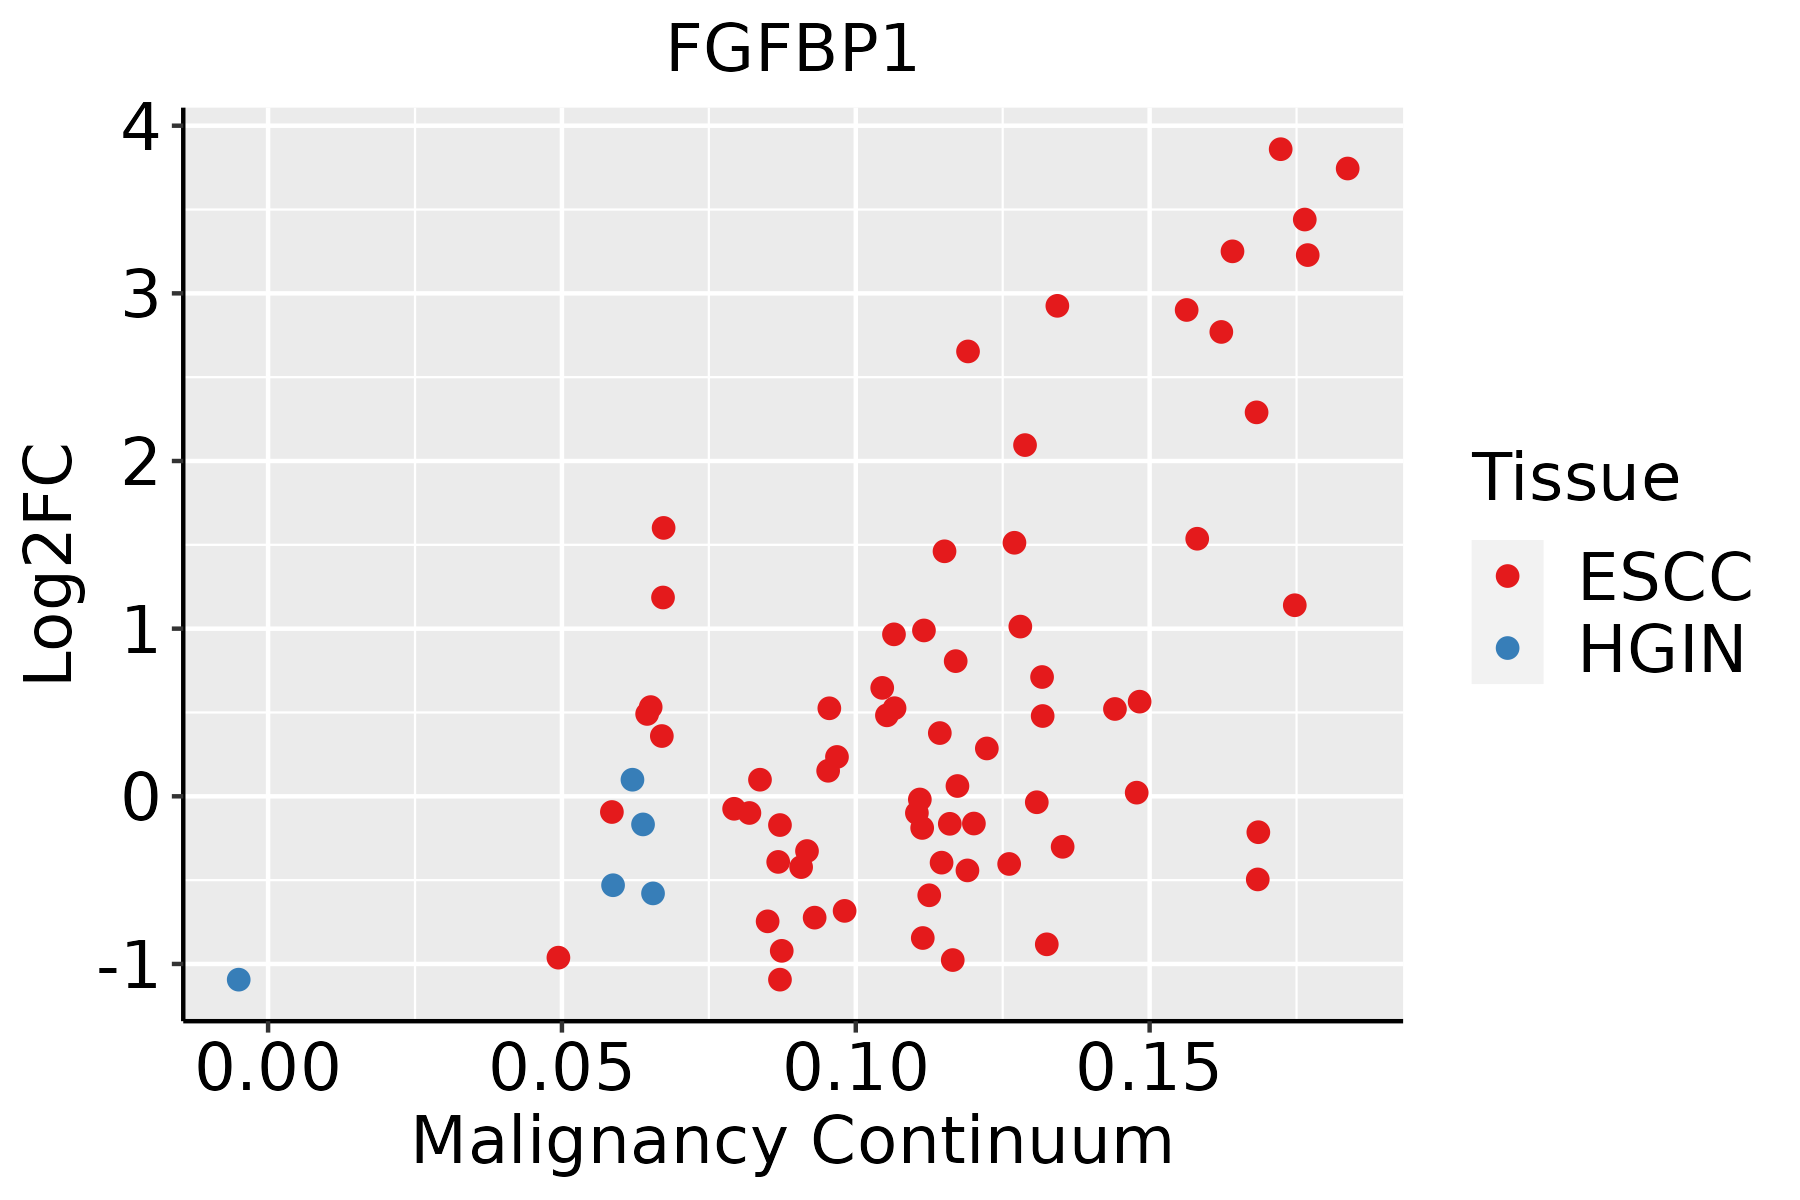 | ESCC: Esophageal squamous cell carcinoma |
| HGIN: High-grade intraepithelial neoplasias | ||
| LGIN: Low-grade intraepithelial neoplasias | ||
| Oral Cavity |  | EOLP: Erosive Oral lichen planus |
| LP: leukoplakia | ||
| NEOLP: Non-erosive oral lichen planus | ||
| OSCC: Oral squamous cell carcinoma | ||
| Skin | 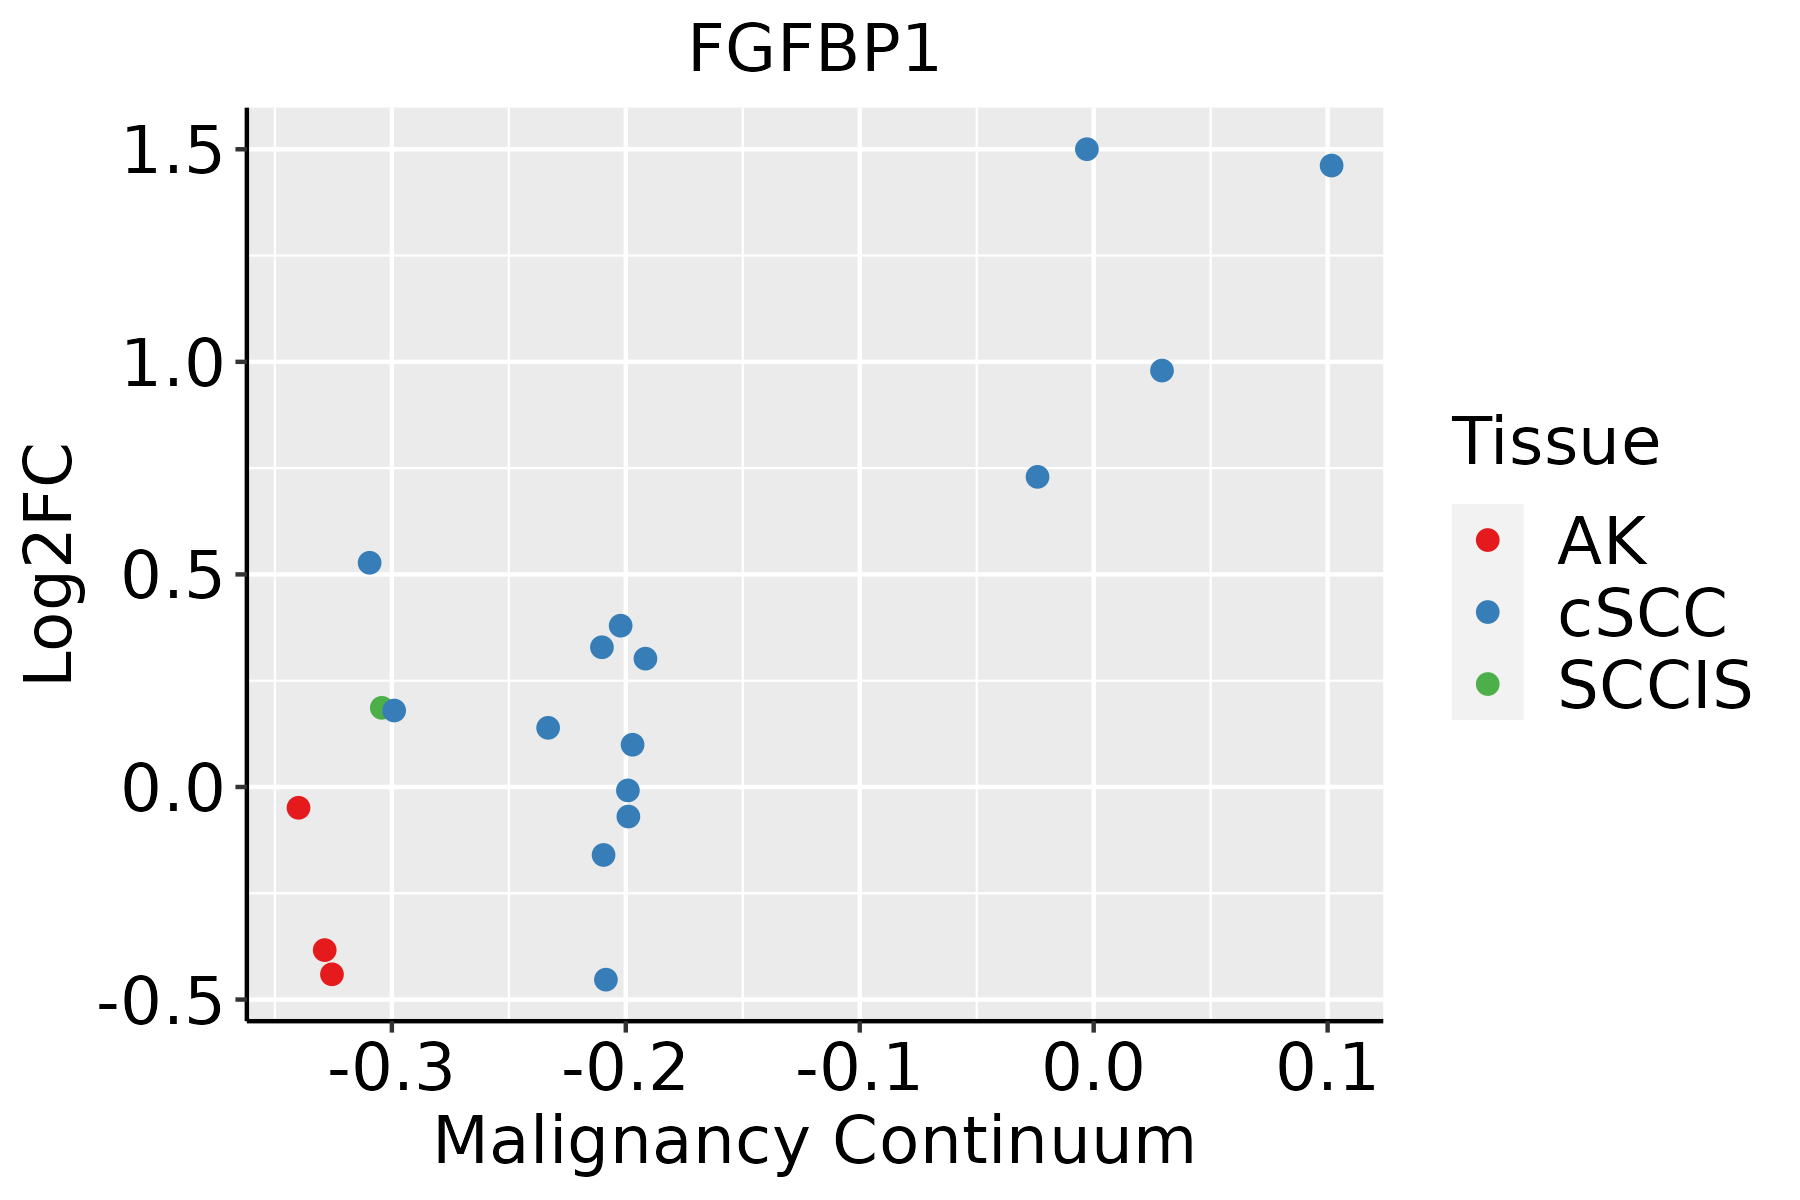 | AK: Actinic keratosis |
| cSCC: Cutaneous squamous cell carcinoma | ||
| SCCIS:squamous cell carcinoma in situ |
| ∗log2FC in expression of this searched gene in stem-like cells from each diseased tissue sample relative to stem-like cells in normal samples in each tissue plotted against the malignancy continuum. Samples are colored based on if they are from different disease stage. |
Top |
Malignant transformation related pathway analysis |
| Find out the enriched GO biological processes and KEGG pathways involved in transition from healthy to precancer to cancer |
| Tissue | Disease Stage | Enriched GO biological Processes |
| Colorectum | AD |  |
| Colorectum | SER |  |
| Colorectum | MSS |  |
| Colorectum | MSI-H |  |
| Colorectum | FAP |  |
| ∗Top 15 enriched GO BP terms are showed in the bar plot of each disease state in each tissue. Each row represents a significant GO biological process which is colored according to the -log10(p.adjust). |
| Page: 1 2 3 4 5 6 7 8 9 |
| GO ID | Tissue | Disease Stage | Description | Gene Ratio | Bg Ratio | pvalue | p.adjust | Count |
| GO:009013210 | Cervix | CC | epithelium migration | 90/2311 | 360/18723 | 2.45e-11 | 6.11e-09 | 90 |
| GO:00016679 | Cervix | CC | ameboidal-type cell migration | 110/2311 | 475/18723 | 2.66e-11 | 6.36e-09 | 110 |
| GO:001063110 | Cervix | CC | epithelial cell migration | 89/2311 | 357/18723 | 3.72e-11 | 8.54e-09 | 89 |
| GO:009013010 | Cervix | CC | tissue migration | 90/2311 | 365/18723 | 5.42e-11 | 1.05e-08 | 90 |
| GO:00506737 | Cervix | CC | epithelial cell proliferation | 98/2311 | 437/18723 | 2.01e-09 | 2.15e-07 | 98 |
| GO:001063210 | Cervix | CC | regulation of epithelial cell migration | 72/2311 | 292/18723 | 4.52e-09 | 4.43e-07 | 72 |
| GO:00506787 | Cervix | CC | regulation of epithelial cell proliferation | 83/2311 | 381/18723 | 1.31e-07 | 6.42e-06 | 83 |
| GO:00106349 | Cervix | CC | positive regulation of epithelial cell migration | 47/2311 | 176/18723 | 1.73e-07 | 8.01e-06 | 47 |
| GO:00435427 | Cervix | CC | endothelial cell migration | 60/2311 | 279/18723 | 1.05e-05 | 2.33e-04 | 60 |
| GO:00105944 | Cervix | CC | regulation of endothelial cell migration | 52/2311 | 232/18723 | 1.20e-05 | 2.54e-04 | 52 |
| GO:00506794 | Cervix | CC | positive regulation of epithelial cell proliferation | 47/2311 | 207/18723 | 2.18e-05 | 3.90e-04 | 47 |
| GO:00105954 | Cervix | CC | positive regulation of endothelial cell migration | 31/2311 | 133/18723 | 3.15e-04 | 3.35e-03 | 31 |
| GO:0043534 | Cervix | CC | blood vessel endothelial cell migration | 37/2311 | 176/18723 | 7.59e-04 | 6.77e-03 | 37 |
| GO:0043535 | Cervix | CC | regulation of blood vessel endothelial cell migration | 32/2311 | 151/18723 | 1.45e-03 | 1.13e-02 | 32 |
| GO:0043536 | Cervix | CC | positive regulation of blood vessel endothelial cell migration | 18/2311 | 76/18723 | 4.45e-03 | 2.71e-02 | 18 |
| GO:001063113 | Cervix | HSIL_HPV | epithelial cell migration | 33/737 | 357/18723 | 5.28e-06 | 2.04e-04 | 33 |
| GO:000166715 | Cervix | HSIL_HPV | ameboidal-type cell migration | 40/737 | 475/18723 | 5.48e-06 | 2.07e-04 | 40 |
| GO:009013213 | Cervix | HSIL_HPV | epithelium migration | 33/737 | 360/18723 | 6.31e-06 | 2.29e-04 | 33 |
| GO:009013013 | Cervix | HSIL_HPV | tissue migration | 33/737 | 365/18723 | 8.43e-06 | 2.97e-04 | 33 |
| GO:005067314 | Cervix | HSIL_HPV | epithelial cell proliferation | 34/737 | 437/18723 | 1.31e-04 | 2.61e-03 | 34 |
| Page: 1 2 3 4 |
| Pathway ID | Tissue | Disease Stage | Description | Gene Ratio | Bg Ratio | pvalue | p.adjust | qvalue | Count |
| Page: 1 |
Top |
Cell-cell communication analysis |
| Identification of potential cell-cell interactions between two cell types and their ligand-receptor pairs for different disease states |
| Ligand | Receptor | LRpair | Pathway | Tissue | Disease Stage |
| Page: 1 |
Top |
Single-cell gene regulatory network inference analysis |
| Find out the significant the regulons (TFs) and the target genes of each regulon across cell types for different disease states |
| TF | Cell Type | Tissue | Disease Stage | Target Gene | RSS | Regulon Activity |
| ∗The dot plots of a searched regulon are shown for all cell subpopulations in each disease state of each tissue based on the regulon specific score inferred using pySCENIC and by calculating the average expression. |
| Page: 1 |
Top |
Somatic mutation of malignant transformation related genes |
| Annotation of somatic variants for genes involved in malignant transformation |
| Hugo Symbol | Variant Class | Variant Classification | dbSNP RS | HGVSc | HGVSp | HGVSp Short | SWISSPROT | BIOTYPE | SIFT | PolyPhen | Tumor Sample Barcode | Tissue | Histology | Sex | Age | Stage | Therapy Types | Drugs | Outcome |
| FGFBP1 | SNV | Missense_Mutation | rs769414778 | c.568A>C | p.Met190Leu | p.M190L | Q14512 | protein_coding | tolerated(0.25) | benign(0.001) | TCGA-E2-A14R-01 | Breast | breast invasive carcinoma | Female | <65 | I/II | Chemotherapy | doxorubicin | PD |
| FGFBP1 | deletion | Nonsense_Mutation | c.210_220delGGCTGCTACTG | p.Trp70Ter | p.W70* | Q14512 | protein_coding | TCGA-AO-A0J6-01 | Breast | breast invasive carcinoma | Female | <65 | I/II | Chemotherapy | doxorubicin | SD | |||
| FGFBP1 | insertion | Frame_Shift_Ins | novel | c.576_577insTTTGCTCCTCATTTGCCTTCTGCCATGATTGGGAGCCCTCCCT | p.Lys193PhefsTer15 | p.K193Ffs*15 | Q14512 | protein_coding | TCGA-BH-A0HF-01 | Breast | breast invasive carcinoma | Female | >=65 | I/II | Hormone Therapy | arimidex | SD | ||
| FGFBP1 | SNV | Missense_Mutation | rs199528852 | c.353N>A | p.Arg118Gln | p.R118Q | Q14512 | protein_coding | deleterious(0) | possibly_damaging(0.742) | TCGA-AA-3845-01 | Colorectum | colon adenocarcinoma | Female | >=65 | I/II | Unknown | Unknown | PD |
| FGFBP1 | SNV | Missense_Mutation | novel | c.613N>G | p.Asn205Asp | p.N205D | Q14512 | protein_coding | tolerated(0.19) | benign(0.055) | TCGA-AG-A032-01 | Colorectum | rectum adenocarcinoma | Male | >=65 | III/IV | Targeted Molecular therapy | bevacizumab | PD |
| FGFBP1 | deletion | Frame_Shift_Del | rs562275732 | c.78delA | p.Val27Ter | p.V27* | Q14512 | protein_coding | TCGA-A6-6781-01 | Colorectum | colon adenocarcinoma | Male | <65 | III/IV | Chemotherapy | oxaliplatin | SD | ||
| FGFBP1 | deletion | Frame_Shift_Del | rs562275732 | c.78delN | p.Val27Ter | p.V27* | Q14512 | protein_coding | TCGA-AD-A5EJ-01 | Colorectum | colon adenocarcinoma | Female | >=65 | I/II | Unknown | Unknown | SD | ||
| FGFBP1 | deletion | Frame_Shift_Del | rs562275732 | c.78delN | p.Val27Ter | p.V27* | Q14512 | protein_coding | TCGA-CM-6162-01 | Colorectum | colon adenocarcinoma | Female | <65 | III/IV | Chemotherapy | oxaliplatin | SD | ||
| FGFBP1 | SNV | Missense_Mutation | c.190N>T | p.Asp64Tyr | p.D64Y | Q14512 | protein_coding | deleterious(0) | probably_damaging(0.995) | TCGA-AP-A0LM-01 | Endometrium | uterine corpus endometrioid carcinoma | Female | <65 | III/IV | Chemotherapy | cisplatin | SD | |
| FGFBP1 | SNV | Missense_Mutation | rs374462127 | c.352N>T | p.Arg118Trp | p.R118W | Q14512 | protein_coding | deleterious(0) | possibly_damaging(0.704) | TCGA-AX-A2HA-01 | Endometrium | uterine corpus endometrioid carcinoma | Female | <65 | I/II | Unknown | Unknown | SD |
| Page: 1 2 3 4 5 |
Top |
Related drugs of malignant transformation related genes |
| Identification of chemicals and drugs interact with genes involved in malignant transfromation |
| (DGIdb 4.0) |
| Entrez ID | Symbol | Category | Interaction Types | Drug Claim Name | Drug Name | PMIDs |
| Page: 1 |

Copyright 2023-Present -The University of Texas Health Science Center at Houston |