
|
|||||
|
 | |
| |
| |
| |
| |
| |
|
Gene: FGF19 |
Gene summary for FGF19 |
| Gene information | Species | Human | Gene symbol | FGF19 | Gene ID | 9965 |
| Gene name | fibroblast growth factor 19 | |
| Gene Alias | FGF19 | |
| Cytomap | 11q13.3 | |
| Gene Type | protein-coding | GO ID | GO:0000165 | UniProtAcc | O95750 |
Top |
Malignant transformation analysis |
| Identification of the aberrant gene expression in precancerous and cancerous lesions by comparing the gene expression of stem-like cells in diseased tissues with normal stem cells |
| Entrez ID | Symbol | Replicates | Species | Organ | Tissue | Adj P-value | Log2FC | Malignancy |
| 9965 | FGF19 | LZE2T | Human | Esophagus | ESCC | 5.44e-10 | 9.65e-01 | 0.082 |
| 9965 | FGF19 | LZE4T | Human | Esophagus | ESCC | 1.47e-07 | 3.89e-01 | 0.0811 |
| 9965 | FGF19 | LZE7T | Human | Esophagus | ESCC | 3.98e-06 | 8.91e-01 | 0.0667 |
| 9965 | FGF19 | LZE21D1 | Human | Esophagus | HGIN | 5.38e-03 | 3.63e-01 | 0.0632 |
| 9965 | FGF19 | LZE22T | Human | Esophagus | ESCC | 1.54e-04 | 1.15e+00 | 0.068 |
| 9965 | FGF19 | LZE21T | Human | Esophagus | ESCC | 1.57e-07 | 1.67e+00 | 0.0655 |
| 9965 | FGF19 | P2T-E | Human | Esophagus | ESCC | 5.65e-114 | 3.45e+00 | 0.1177 |
| 9965 | FGF19 | P4T-E | Human | Esophagus | ESCC | 9.47e-14 | 8.50e-01 | 0.1323 |
| 9965 | FGF19 | P8T-E | Human | Esophagus | ESCC | 8.40e-04 | 1.98e-01 | 0.0889 |
| 9965 | FGF19 | P10T-E | Human | Esophagus | ESCC | 1.97e-10 | 3.29e-01 | 0.116 |
| 9965 | FGF19 | P15T-E | Human | Esophagus | ESCC | 1.67e-14 | 1.40e+00 | 0.1149 |
| 9965 | FGF19 | P16T-E | Human | Esophagus | ESCC | 1.59e-30 | 9.34e-01 | 0.1153 |
| 9965 | FGF19 | P22T-E | Human | Esophagus | ESCC | 1.88e-11 | 3.86e-01 | 0.1236 |
| 9965 | FGF19 | P26T-E | Human | Esophagus | ESCC | 3.60e-13 | 4.06e-01 | 0.1276 |
| 9965 | FGF19 | P28T-E | Human | Esophagus | ESCC | 4.40e-09 | 6.93e-01 | 0.1149 |
| 9965 | FGF19 | P30T-E | Human | Esophagus | ESCC | 9.60e-15 | 8.01e-01 | 0.137 |
| 9965 | FGF19 | P31T-E | Human | Esophagus | ESCC | 7.90e-03 | 1.55e-01 | 0.1251 |
| 9965 | FGF19 | P40T-E | Human | Esophagus | ESCC | 2.37e-02 | 3.17e-01 | 0.109 |
| 9965 | FGF19 | P42T-E | Human | Esophagus | ESCC | 1.97e-08 | 4.57e-01 | 0.1175 |
| 9965 | FGF19 | P47T-E | Human | Esophagus | ESCC | 2.06e-08 | 6.16e-01 | 0.1067 |
| Page: 1 2 |
| Tissue | Expression Dynamics | Abbreviation |
| Esophagus | 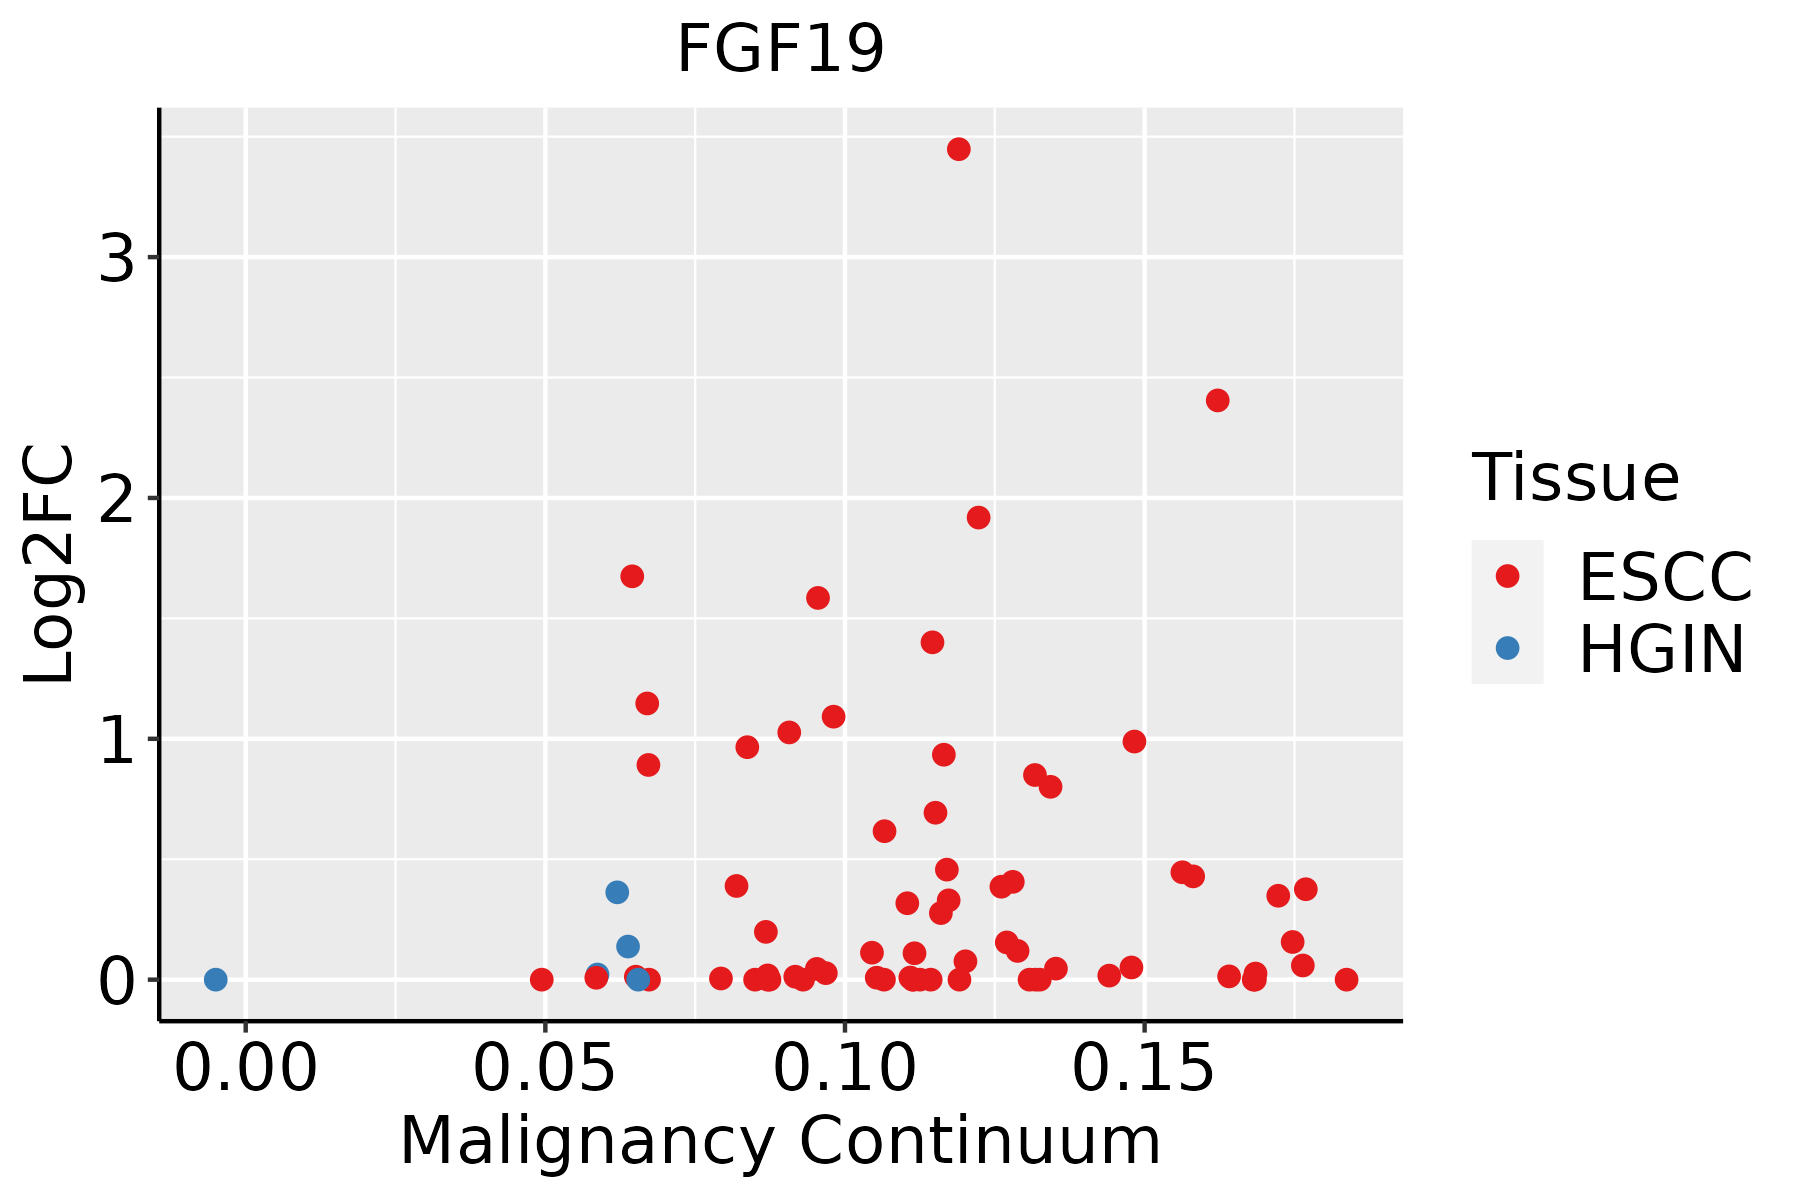 | ESCC: Esophageal squamous cell carcinoma |
| HGIN: High-grade intraepithelial neoplasias | ||
| LGIN: Low-grade intraepithelial neoplasias |
| ∗log2FC in expression of this searched gene in stem-like cells from each diseased tissue sample relative to stem-like cells in normal samples in each tissue plotted against the malignancy continuum. Samples are colored based on if they are from different disease stage. |
Top |
Malignant transformation related pathway analysis |
| Find out the enriched GO biological processes and KEGG pathways involved in transition from healthy to precancer to cancer |
| Tissue | Disease Stage | Enriched GO biological Processes |
| Colorectum | AD |  |
| Colorectum | SER |  |
| Colorectum | MSS |  |
| Colorectum | MSI-H |  |
| Colorectum | FAP |  |
| ∗Top 15 enriched GO BP terms are showed in the bar plot of each disease state in each tissue. Each row represents a significant GO biological process which is colored according to the -log10(p.adjust). |
| Page: 1 2 3 4 5 6 7 8 9 |
| GO ID | Tissue | Disease Stage | Description | Gene Ratio | Bg Ratio | pvalue | p.adjust | Count |
| GO:003109818 | Esophagus | ESCC | stress-activated protein kinase signaling cascade | 154/8552 | 247/18723 | 8.53e-08 | 1.44e-06 | 154 |
| GO:005140318 | Esophagus | ESCC | stress-activated MAPK cascade | 147/8552 | 239/18723 | 5.43e-07 | 7.18e-06 | 147 |
| GO:007030217 | Esophagus | ESCC | regulation of stress-activated protein kinase signaling cascade | 119/8552 | 195/18723 | 1.07e-05 | 1.01e-04 | 119 |
| GO:003287217 | Esophagus | ESCC | regulation of stress-activated MAPK cascade | 116/8552 | 192/18723 | 2.63e-05 | 2.21e-04 | 116 |
| GO:00072549 | Esophagus | ESCC | JNK cascade | 102/8552 | 167/18723 | 4.22e-05 | 3.39e-04 | 102 |
| GO:00463948 | Esophagus | ESCC | carboxylic acid biosynthetic process | 175/8552 | 314/18723 | 1.98e-04 | 1.26e-03 | 175 |
| GO:00160538 | Esophagus | ESCC | organic acid biosynthetic process | 175/8552 | 316/18723 | 3.04e-04 | 1.82e-03 | 175 |
| GO:00620129 | Esophagus | ESCC | regulation of small molecule metabolic process | 184/8552 | 334/18723 | 3.11e-04 | 1.85e-03 | 184 |
| GO:00463289 | Esophagus | ESCC | regulation of JNK cascade | 80/8552 | 133/18723 | 5.35e-04 | 2.95e-03 | 80 |
| GO:00421805 | Esophagus | ESCC | cellular ketone metabolic process | 120/8552 | 211/18723 | 6.70e-04 | 3.55e-03 | 120 |
| GO:00066946 | Esophagus | ESCC | steroid biosynthetic process | 98/8552 | 173/18723 | 2.34e-03 | 1.03e-02 | 98 |
| GO:00703046 | Esophagus | ESCC | positive regulation of stress-activated protein kinase signaling cascade | 74/8552 | 128/18723 | 3.77e-03 | 1.53e-02 | 74 |
| GO:19016174 | Esophagus | ESCC | organic hydroxy compound biosynthetic process | 128/8552 | 237/18723 | 5.86e-03 | 2.16e-02 | 128 |
| GO:00328745 | Esophagus | ESCC | positive regulation of stress-activated MAPK cascade | 72/8552 | 126/18723 | 6.24e-03 | 2.29e-02 | 72 |
| GO:00463302 | Esophagus | ESCC | positive regulation of JNK cascade | 52/8552 | 89/18723 | 1.04e-02 | 3.56e-02 | 52 |
| GO:00192168 | Esophagus | ESCC | regulation of lipid metabolic process | 172/8552 | 331/18723 | 1.20e-02 | 4.02e-02 | 172 |
| Page: 1 |
| Pathway ID | Tissue | Disease Stage | Description | Gene Ratio | Bg Ratio | pvalue | p.adjust | qvalue | Count |
| hsa0481028 | Esophagus | ESCC | Regulation of actin cytoskeleton | 133/4205 | 229/8465 | 5.94e-03 | 1.48e-02 | 7.56e-03 | 133 |
| hsa041517 | Esophagus | ESCC | PI3K-Akt signaling pathway | 197/4205 | 354/8465 | 1.24e-02 | 2.83e-02 | 1.45e-02 | 197 |
| hsa04810112 | Esophagus | ESCC | Regulation of actin cytoskeleton | 133/4205 | 229/8465 | 5.94e-03 | 1.48e-02 | 7.56e-03 | 133 |
| hsa0415114 | Esophagus | ESCC | PI3K-Akt signaling pathway | 197/4205 | 354/8465 | 1.24e-02 | 2.83e-02 | 1.45e-02 | 197 |
| Page: 1 |
Top |
Cell-cell communication analysis |
| Identification of potential cell-cell interactions between two cell types and their ligand-receptor pairs for different disease states |
| Ligand | Receptor | LRpair | Pathway | Tissue | Disease Stage |
| FGF19 | FGFR1 | FGF15_FGFR1 | FGF | Esophagus | ESCC |
| FGF19 | FGFR3 | FGF15_FGFR3 | FGF | Esophagus | ESCC |
| FGF19 | FGFR4 | FGF15_FGFR4 | FGF | Esophagus | ESCC |
| Page: 1 |
Top |
Single-cell gene regulatory network inference analysis |
| Find out the significant the regulons (TFs) and the target genes of each regulon across cell types for different disease states |
| TF | Cell Type | Tissue | Disease Stage | Target Gene | RSS | Regulon Activity |
| ∗The dot plots of a searched regulon are shown for all cell subpopulations in each disease state of each tissue based on the regulon specific score inferred using pySCENIC and by calculating the average expression. |
| Page: 1 |
Top |
Somatic mutation of malignant transformation related genes |
| Annotation of somatic variants for genes involved in malignant transformation |
| Hugo Symbol | Variant Class | Variant Classification | dbSNP RS | HGVSc | HGVSp | HGVSp Short | SWISSPROT | BIOTYPE | SIFT | PolyPhen | Tumor Sample Barcode | Tissue | Histology | Sex | Age | Stage | Therapy Types | Drugs | Outcome |
| FGF19 | SNV | Missense_Mutation | c.539N>T | p.Arg180Met | p.R180M | O95750 | protein_coding | tolerated(0.09) | benign(0.19) | TCGA-AA-3715-01 | Colorectum | colon adenocarcinoma | Male | >=65 | I/II | Unknown | Unknown | PD | |
| FGF19 | SNV | Missense_Mutation | novel | c.272N>T | p.Ala91Val | p.A91V | O95750 | protein_coding | tolerated(0.16) | possibly_damaging(0.548) | TCGA-AA-A010-01 | Colorectum | colon adenocarcinoma | Female | <65 | I/II | Chemotherapy | folinic | CR |
| FGF19 | SNV | Missense_Mutation | novel | c.564N>A | p.Phe188Leu | p.F188L | O95750 | protein_coding | tolerated(0.37) | benign(0.113) | TCGA-AG-A002-01 | Colorectum | rectum adenocarcinoma | Male | <65 | I/II | Unknown | Unknown | SD |
| FGF19 | SNV | Missense_Mutation | novel | c.382N>T | p.Pro128Ser | p.P128S | O95750 | protein_coding | tolerated(0.21) | benign(0.031) | TCGA-AP-A1DV-01 | Endometrium | uterine corpus endometrioid carcinoma | Female | <65 | I/II | Unknown | Unknown | SD |
| FGF19 | SNV | Missense_Mutation | c.351N>T | p.Glu117Asp | p.E117D | O95750 | protein_coding | tolerated(0.48) | benign(0.029) | TCGA-AX-A1CE-01 | Endometrium | uterine corpus endometrioid carcinoma | Female | <65 | I/II | Unspecific | Paclitaxel | SD | |
| FGF19 | SNV | Missense_Mutation | novel | c.431N>T | p.Ser144Phe | p.S144F | O95750 | protein_coding | deleterious(0.01) | probably_damaging(0.994) | TCGA-AX-A2HC-01 | Endometrium | uterine corpus endometrioid carcinoma | Female | <65 | III/IV | Chemotherapy | paclitaxel | PD |
| FGF19 | SNV | Missense_Mutation | novel | c.272N>T | p.Ala91Val | p.A91V | O95750 | protein_coding | tolerated(0.16) | possibly_damaging(0.548) | TCGA-B5-A11P-01 | Endometrium | uterine corpus endometrioid carcinoma | Female | >=65 | I/II | Unknown | Unknown | SD |
| FGF19 | SNV | Missense_Mutation | novel | c.645N>T | p.Glu215Asp | p.E215D | O95750 | protein_coding | tolerated(0.05) | benign(0.011) | TCGA-E6-A1LX-01 | Endometrium | uterine corpus endometrioid carcinoma | Female | <65 | I/II | Unknown | Unknown | SD |
| FGF19 | SNV | Missense_Mutation | c.527C>A | p.Pro176His | p.P176H | O95750 | protein_coding | deleterious(0.01) | benign(0.321) | TCGA-75-5146-01 | Lung | lung adenocarcinoma | Male | Unknown | I/II | Unknown | Unknown | PD | |
| FGF19 | SNV | Missense_Mutation | novel | c.572C>T | p.Pro191Leu | p.P191L | O95750 | protein_coding | deleterious(0.01) | possibly_damaging(0.784) | TCGA-56-8309-01 | Lung | lung squamous cell carcinoma | Male | >=65 | I/II | Unknown | Unknown | SD |
| Page: 1 2 |
Top |
Related drugs of malignant transformation related genes |
| Identification of chemicals and drugs interact with genes involved in malignant transfromation |
| (DGIdb 4.0) |
| Entrez ID | Symbol | Category | Interaction Types | Drug Claim Name | Drug Name | PMIDs |
| 9965 | FGF19 | CLINICALLY ACTIONABLE, DRUGGABLE GENOME, GROWTH FACTOR | FISOGATINIB | 31575541 | ||
| 9965 | FGF19 | CLINICALLY ACTIONABLE, DRUGGABLE GENOME, GROWTH FACTOR | FGFR4 INHIBITOR H3B-6527 | 29247039 |
| Page: 1 |

Copyright 2023-Present -The University of Texas Health Science Center at Houston |