
|
|||||
|
 | |
| |
| |
| |
| |
| |
|
Gene: FGF14 |
Gene summary for FGF14 |
| Gene information | Species | Human | Gene symbol | FGF14 | Gene ID | 2259 |
| Gene name | fibroblast growth factor 14 | |
| Gene Alias | FGF-14 | |
| Cytomap | 13q33.1 | |
| Gene Type | protein-coding | GO ID | GO:0002028 | UniProtAcc | Q92915 |
Top |
Malignant transformation analysis |
| Identification of the aberrant gene expression in precancerous and cancerous lesions by comparing the gene expression of stem-like cells in diseased tissues with normal stem cells |
| Entrez ID | Symbol | Replicates | Species | Organ | Tissue | Adj P-value | Log2FC | Malignancy |
| 2259 | FGF14 | NAFLD1 | Human | Liver | NAFLD | 5.95e-06 | 8.15e-01 | -0.04 |
| 2259 | FGF14 | S027 | Human | Liver | HCC | 2.98e-03 | 5.90e-01 | 0.2446 |
| 2259 | FGF14 | S028 | Human | Liver | HCC | 4.90e-02 | 1.91e-01 | 0.2503 |
| 2259 | FGF14 | S029 | Human | Liver | HCC | 2.04e-08 | 5.23e-01 | 0.2581 |
| 2259 | FGF14 | HTA12-15-2 | Human | Pancreas | PDAC | 4.32e-07 | 4.78e-01 | 0.2315 |
| 2259 | FGF14 | HTA12-23-1 | Human | Pancreas | PDAC | 1.06e-18 | 1.26e+00 | 0.3405 |
| 2259 | FGF14 | HTA12-25-1 | Human | Pancreas | PDAC | 2.04e-11 | 8.50e-01 | 0.313 |
| 2259 | FGF14 | HTA12-26-1 | Human | Pancreas | PDAC | 9.91e-34 | 1.23e+00 | 0.3728 |
| 2259 | FGF14 | HTA12-29-1 | Human | Pancreas | PDAC | 4.72e-76 | 1.44e+00 | 0.3722 |
| 2259 | FGF14 | HTA12-30-1 | Human | Pancreas | PDAC | 1.14e-02 | 9.16e-01 | 0.3671 |
| 2259 | FGF14 | HTA12-32-1 | Human | Pancreas | PDAC | 9.72e-12 | 1.53e+00 | 0.3624 |
| Page: 1 |
| Tissue | Expression Dynamics | Abbreviation |
| Liver | 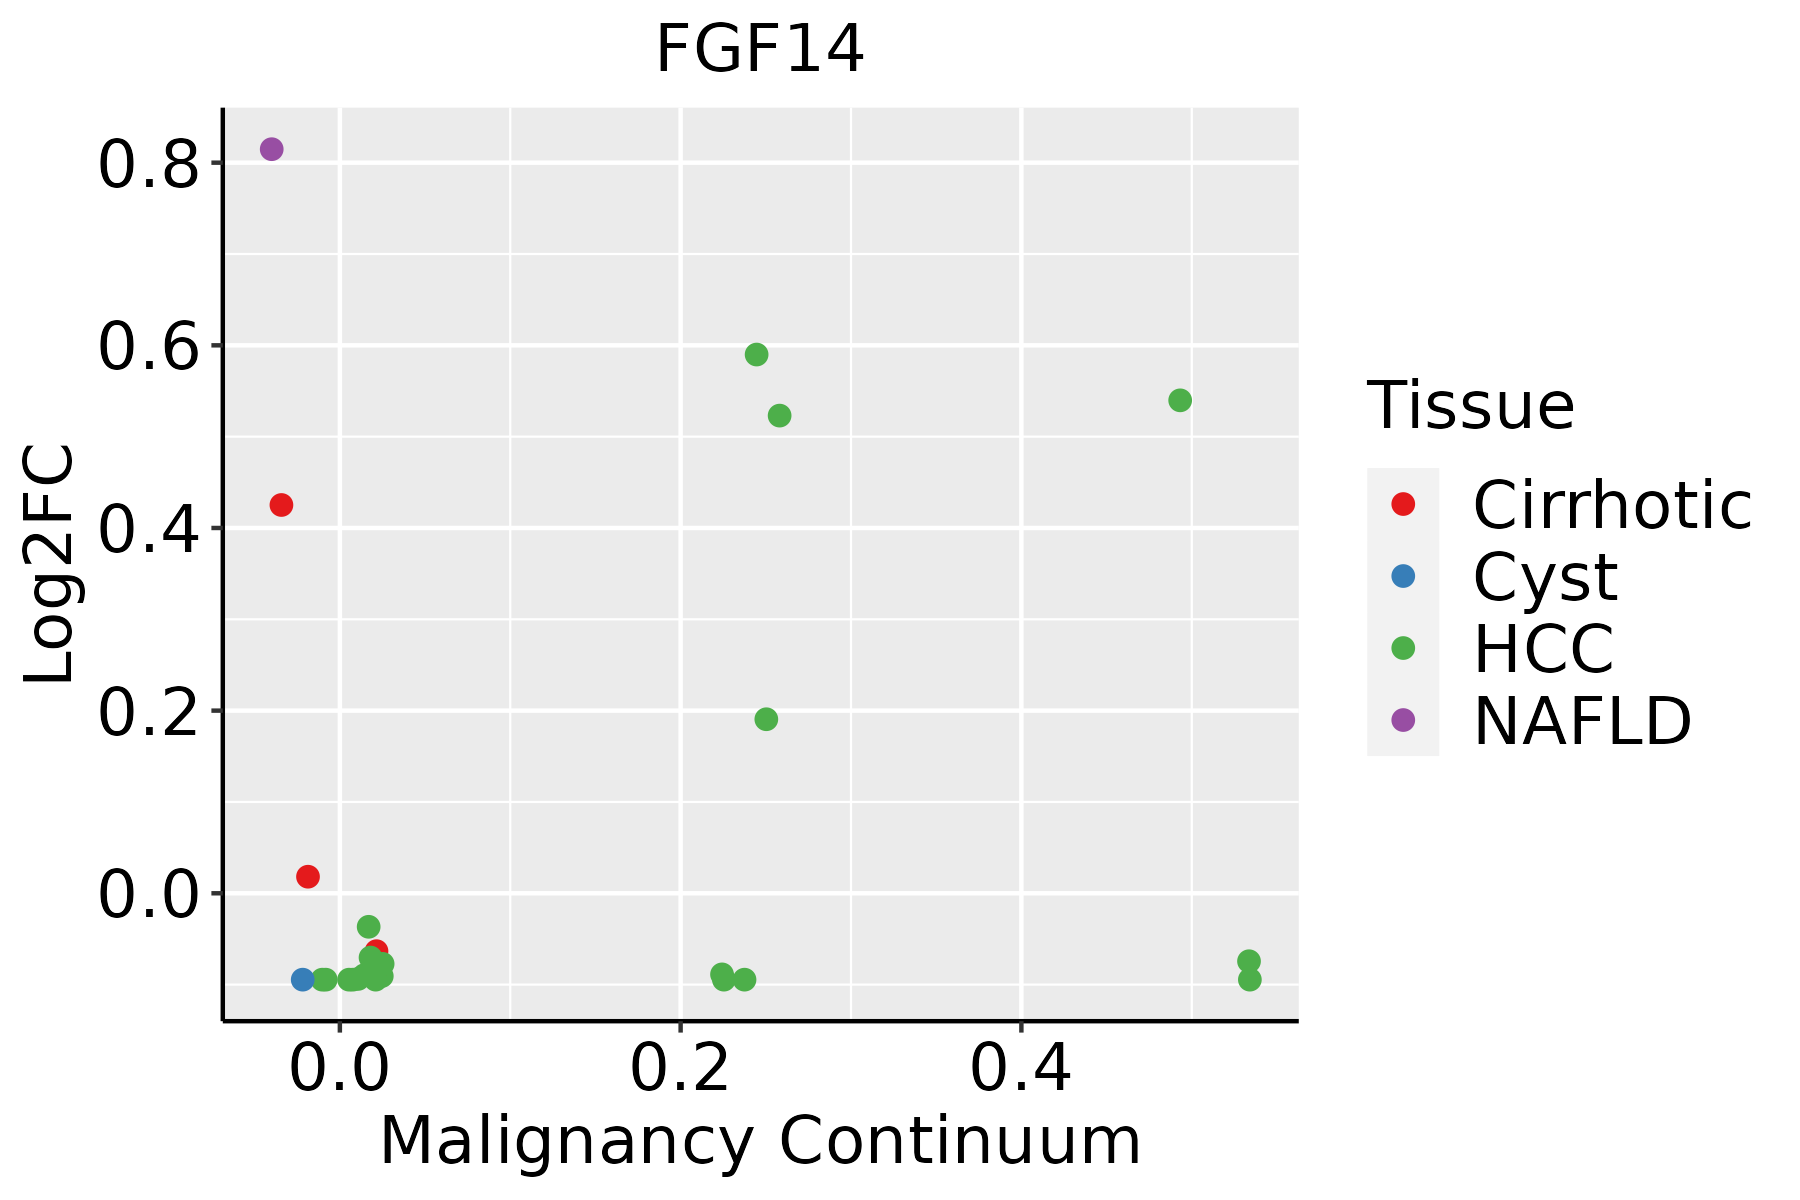 | HCC: Hepatocellular carcinoma |
| NAFLD: Non-alcoholic fatty liver disease |
| ∗log2FC in expression of this searched gene in stem-like cells from each diseased tissue sample relative to stem-like cells in normal samples in each tissue plotted against the malignancy continuum. Samples are colored based on if they are from different disease stage. |
Top |
Malignant transformation related pathway analysis |
| Find out the enriched GO biological processes and KEGG pathways involved in transition from healthy to precancer to cancer |
| Tissue | Disease Stage | Enriched GO biological Processes |
| Colorectum | AD |  |
| Colorectum | SER |  |
| Colorectum | MSS |  |
| Colorectum | MSI-H |  |
| Colorectum | FAP |  |
| ∗Top 15 enriched GO BP terms are showed in the bar plot of each disease state in each tissue. Each row represents a significant GO biological process which is colored according to the -log10(p.adjust). |
| Page: 1 2 3 4 5 6 7 8 9 |
| GO ID | Tissue | Disease Stage | Description | Gene Ratio | Bg Ratio | pvalue | p.adjust | Count |
| GO:00020286 | Liver | NAFLD | regulation of sodium ion transport | 18/1882 | 90/18723 | 3.34e-03 | 2.93e-02 | 18 |
| GO:00347643 | Liver | NAFLD | positive regulation of transmembrane transport | 35/1882 | 219/18723 | 3.92e-03 | 3.32e-02 | 35 |
| GO:19023057 | Liver | NAFLD | regulation of sodium ion transmembrane transport | 14/1882 | 68/18723 | 6.95e-03 | 4.88e-02 | 14 |
| GO:00364653 | Liver | NAFLD | synaptic vesicle recycling | 15/1882 | 75/18723 | 7.02e-03 | 4.91e-02 | 15 |
| Page: 1 |
| Pathway ID | Tissue | Disease Stage | Description | Gene Ratio | Bg Ratio | pvalue | p.adjust | qvalue | Count |
| Page: 1 |
Top |
Cell-cell communication analysis |
| Identification of potential cell-cell interactions between two cell types and their ligand-receptor pairs for different disease states |
| Ligand | Receptor | LRpair | Pathway | Tissue | Disease Stage |
| Page: 1 |
Top |
Single-cell gene regulatory network inference analysis |
| Find out the significant the regulons (TFs) and the target genes of each regulon across cell types for different disease states |
| TF | Cell Type | Tissue | Disease Stage | Target Gene | RSS | Regulon Activity |
| ∗The dot plots of a searched regulon are shown for all cell subpopulations in each disease state of each tissue based on the regulon specific score inferred using pySCENIC and by calculating the average expression. |
| Page: 1 |
Top |
Somatic mutation of malignant transformation related genes |
| Annotation of somatic variants for genes involved in malignant transformation |
| Hugo Symbol | Variant Class | Variant Classification | dbSNP RS | HGVSc | HGVSp | HGVSp Short | SWISSPROT | BIOTYPE | SIFT | PolyPhen | Tumor Sample Barcode | Tissue | Histology | Sex | Age | Stage | Therapy Types | Drugs | Outcome |
| FGF14 | SNV | Missense_Mutation | c.596C>T | p.Ala199Val | p.A199V | Q92915 | protein_coding | deleterious(0) | possibly_damaging(0.503) | TCGA-A7-A0CG-01 | Breast | breast invasive carcinoma | Female | >=65 | I/II | Unknown | Unknown | SD | |
| FGF14 | SNV | Missense_Mutation | rs757596950 | c.396N>A | p.Met132Ile | p.M132I | Q92915 | protein_coding | deleterious(0.01) | benign(0.044) | TCGA-BH-A0HF-01 | Breast | breast invasive carcinoma | Female | >=65 | I/II | Hormone Therapy | arimidex | SD |
| FGF14 | SNV | Missense_Mutation | rs757879324 | c.686C>T | p.Thr229Met | p.T229M | Q92915 | protein_coding | tolerated(0.07) | possibly_damaging(0.888) | TCGA-C5-A7CG-01 | Cervix | cervical & endocervical cancer | Female | <65 | I/II | Unknown | Unknown | SD |
| FGF14 | SNV | Missense_Mutation | c.734N>A | p.Pro245Gln | p.P245Q | Q92915 | protein_coding | tolerated(0.12) | possibly_damaging(0.577) | TCGA-VS-A8QH-01 | Cervix | cervical & endocervical cancer | Female | >=65 | I/II | Chemotherapy | gemcitabine | PD | |
| FGF14 | SNV | Missense_Mutation | rs757879324 | c.686N>T | p.Thr229Met | p.T229M | Q92915 | protein_coding | tolerated(0.07) | possibly_damaging(0.888) | TCGA-VS-A94Z-01 | Cervix | cervical & endocervical cancer | Female | <65 | I/II | Chemotherapy | cisplatin | CR |
| FGF14 | SNV | Missense_Mutation | rs760595879 | c.635G>A | p.Arg212Gln | p.R212Q | Q92915 | protein_coding | deleterious(0.04) | possibly_damaging(0.629) | TCGA-AA-3666-01 | Colorectum | colon adenocarcinoma | Male | >=65 | III/IV | Unknown | Unknown | PD |
| FGF14 | SNV | Missense_Mutation | rs199536239 | c.707C>T | p.Ala236Val | p.A236V | Q92915 | protein_coding | tolerated(0.41) | benign(0.039) | TCGA-AA-3715-01 | Colorectum | colon adenocarcinoma | Male | >=65 | I/II | Unknown | Unknown | PD |
| FGF14 | SNV | Missense_Mutation | rs199536239 | c.707N>T | p.Ala236Val | p.A236V | Q92915 | protein_coding | tolerated(0.41) | benign(0.039) | TCGA-AA-3949-01 | Colorectum | colon adenocarcinoma | Female | >=65 | III/IV | Unknown | Unknown | SD |
| FGF14 | SNV | Missense_Mutation | novel | c.579N>T | p.Lys193Asn | p.K193N | Q92915 | protein_coding | deleterious(0.01) | probably_damaging(0.993) | TCGA-CA-6717-01 | Colorectum | colon adenocarcinoma | Male | <65 | I/II | Chemotherapy | oxaliplatin | CR |
| FGF14 | SNV | Missense_Mutation | novel | c.192N>C | p.Lys64Asn | p.K64N | Q92915 | protein_coding | tolerated(0.23) | benign(0.005) | TCGA-CA-6717-01 | Colorectum | colon adenocarcinoma | Male | <65 | I/II | Chemotherapy | oxaliplatin | CR |
| Page: 1 2 3 4 5 6 |
Top |
Related drugs of malignant transformation related genes |
| Identification of chemicals and drugs interact with genes involved in malignant transfromation |
| (DGIdb 4.0) |
| Entrez ID | Symbol | Category | Interaction Types | Drug Claim Name | Drug Name | PMIDs |
| Page: 1 |

Copyright 2023-Present -The University of Texas Health Science Center at Houston |