
|
|||||
|
 | |
| |
| |
| |
| |
| |
|
Gene: FGF13 |
Gene summary for FGF13 |
| Gene information | Species | Human | Gene symbol | FGF13 | Gene ID | 2258 |
| Gene name | fibroblast growth factor 13 | |
| Gene Alias | DEE90 | |
| Cytomap | Xq26.3-q27.1 | |
| Gene Type | protein-coding | GO ID | GO:0000165 | UniProtAcc | Q92913 |
Top |
Malignant transformation analysis |
| Identification of the aberrant gene expression in precancerous and cancerous lesions by comparing the gene expression of stem-like cells in diseased tissues with normal stem cells |
| Entrez ID | Symbol | Replicates | Species | Organ | Tissue | Adj P-value | Log2FC | Malignancy |
| 2258 | FGF13 | EEC-subject1 | Human | Endometrium | EEC | 2.38e-13 | 6.07e-01 | -0.2682 |
| 2258 | FGF13 | EEC-subject3 | Human | Endometrium | EEC | 6.18e-03 | 1.30e-01 | -0.2525 |
| 2258 | FGF13 | GSM6177621_NYU_UCEC2_lib1_lib1 | Human | Endometrium | EEC | 1.31e-04 | -8.45e-02 | -0.1934 |
| 2258 | FGF13 | GSM6177622_NYU_UCEC3_lib1_lib1 | Human | Endometrium | EEC | 3.87e-05 | -1.04e-01 | -0.1917 |
| 2258 | FGF13 | GSM6177622_NYU_UCEC3_lib2_lib2 | Human | Endometrium | EEC | 8.54e-03 | -1.04e-01 | -0.1916 |
| 2258 | FGF13 | P1T-E | Human | Esophagus | ESCC | 2.49e-05 | 2.01e-01 | 0.0875 |
| 2258 | FGF13 | P8T-E | Human | Esophagus | ESCC | 1.20e-05 | 9.57e-02 | 0.0889 |
| 2258 | FGF13 | P9T-E | Human | Esophagus | ESCC | 9.40e-06 | 1.93e-01 | 0.1131 |
| 2258 | FGF13 | P10T-E | Human | Esophagus | ESCC | 5.42e-23 | 4.68e-01 | 0.116 |
| 2258 | FGF13 | P12T-E | Human | Esophagus | ESCC | 2.93e-24 | 5.20e-01 | 0.1122 |
| 2258 | FGF13 | P19T-E | Human | Esophagus | ESCC | 1.37e-05 | 4.69e-01 | 0.1662 |
| 2258 | FGF13 | P22T-E | Human | Esophagus | ESCC | 5.48e-03 | 5.02e-02 | 0.1236 |
| 2258 | FGF13 | P23T-E | Human | Esophagus | ESCC | 9.69e-06 | 1.85e-01 | 0.108 |
| 2258 | FGF13 | P28T-E | Human | Esophagus | ESCC | 7.83e-06 | 7.03e-02 | 0.1149 |
| 2258 | FGF13 | P31T-E | Human | Esophagus | ESCC | 8.24e-19 | 3.66e-01 | 0.1251 |
| 2258 | FGF13 | P32T-E | Human | Esophagus | ESCC | 1.77e-03 | 8.95e-02 | 0.1666 |
| 2258 | FGF13 | P39T-E | Human | Esophagus | ESCC | 2.05e-04 | 7.86e-02 | 0.0894 |
| 2258 | FGF13 | P61T-E | Human | Esophagus | ESCC | 5.80e-04 | 6.43e-02 | 0.099 |
| 2258 | FGF13 | P76T-E | Human | Esophagus | ESCC | 2.56e-02 | 8.51e-02 | 0.1207 |
| 2258 | FGF13 | P84T-E | Human | Esophagus | ESCC | 4.71e-02 | 1.54e-01 | 0.0933 |
| Page: 1 2 |
| Tissue | Expression Dynamics | Abbreviation |
| Endometrium | 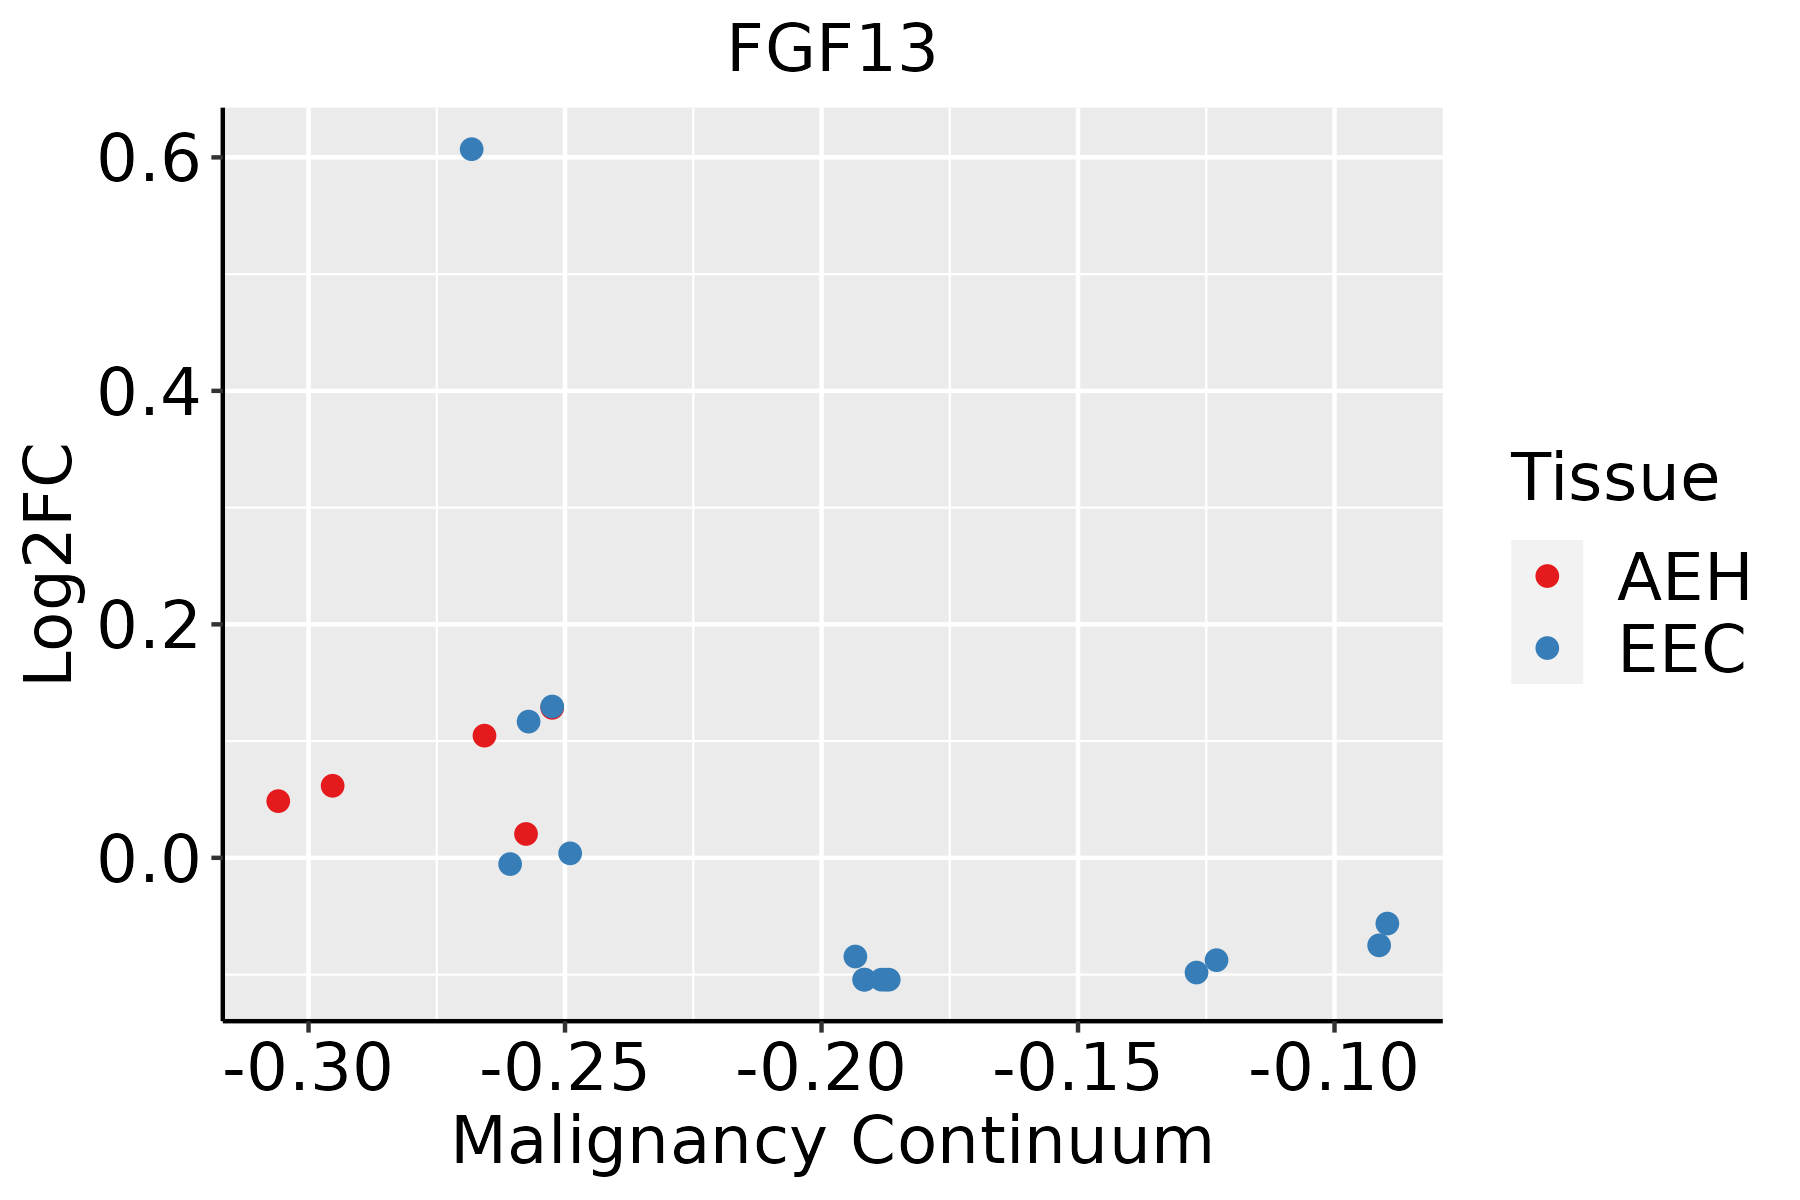 | AEH: Atypical endometrial hyperplasia |
| EEC: Endometrioid Cancer | ||
| Esophagus |  | ESCC: Esophageal squamous cell carcinoma |
| HGIN: High-grade intraepithelial neoplasias | ||
| LGIN: Low-grade intraepithelial neoplasias | ||
| Liver | 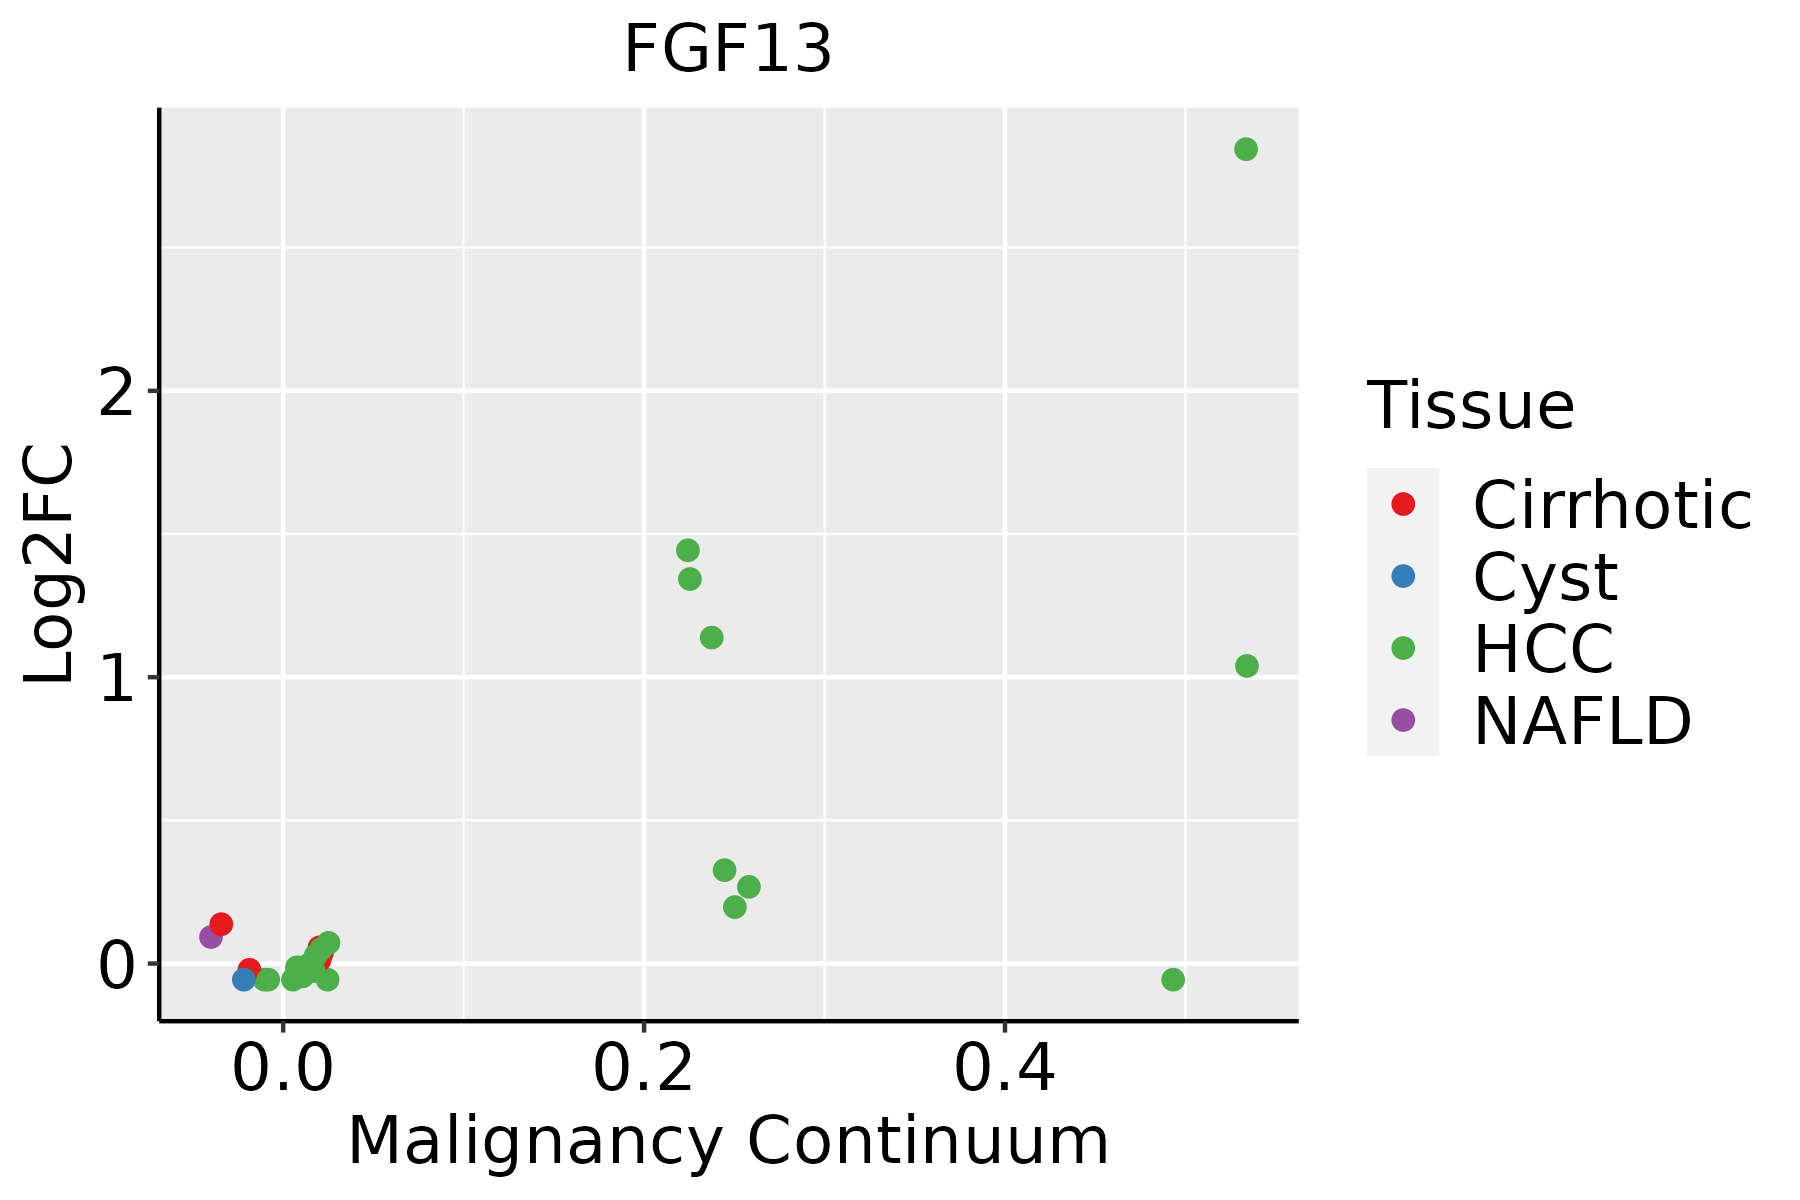 | HCC: Hepatocellular carcinoma |
| NAFLD: Non-alcoholic fatty liver disease | ||
| Lung | 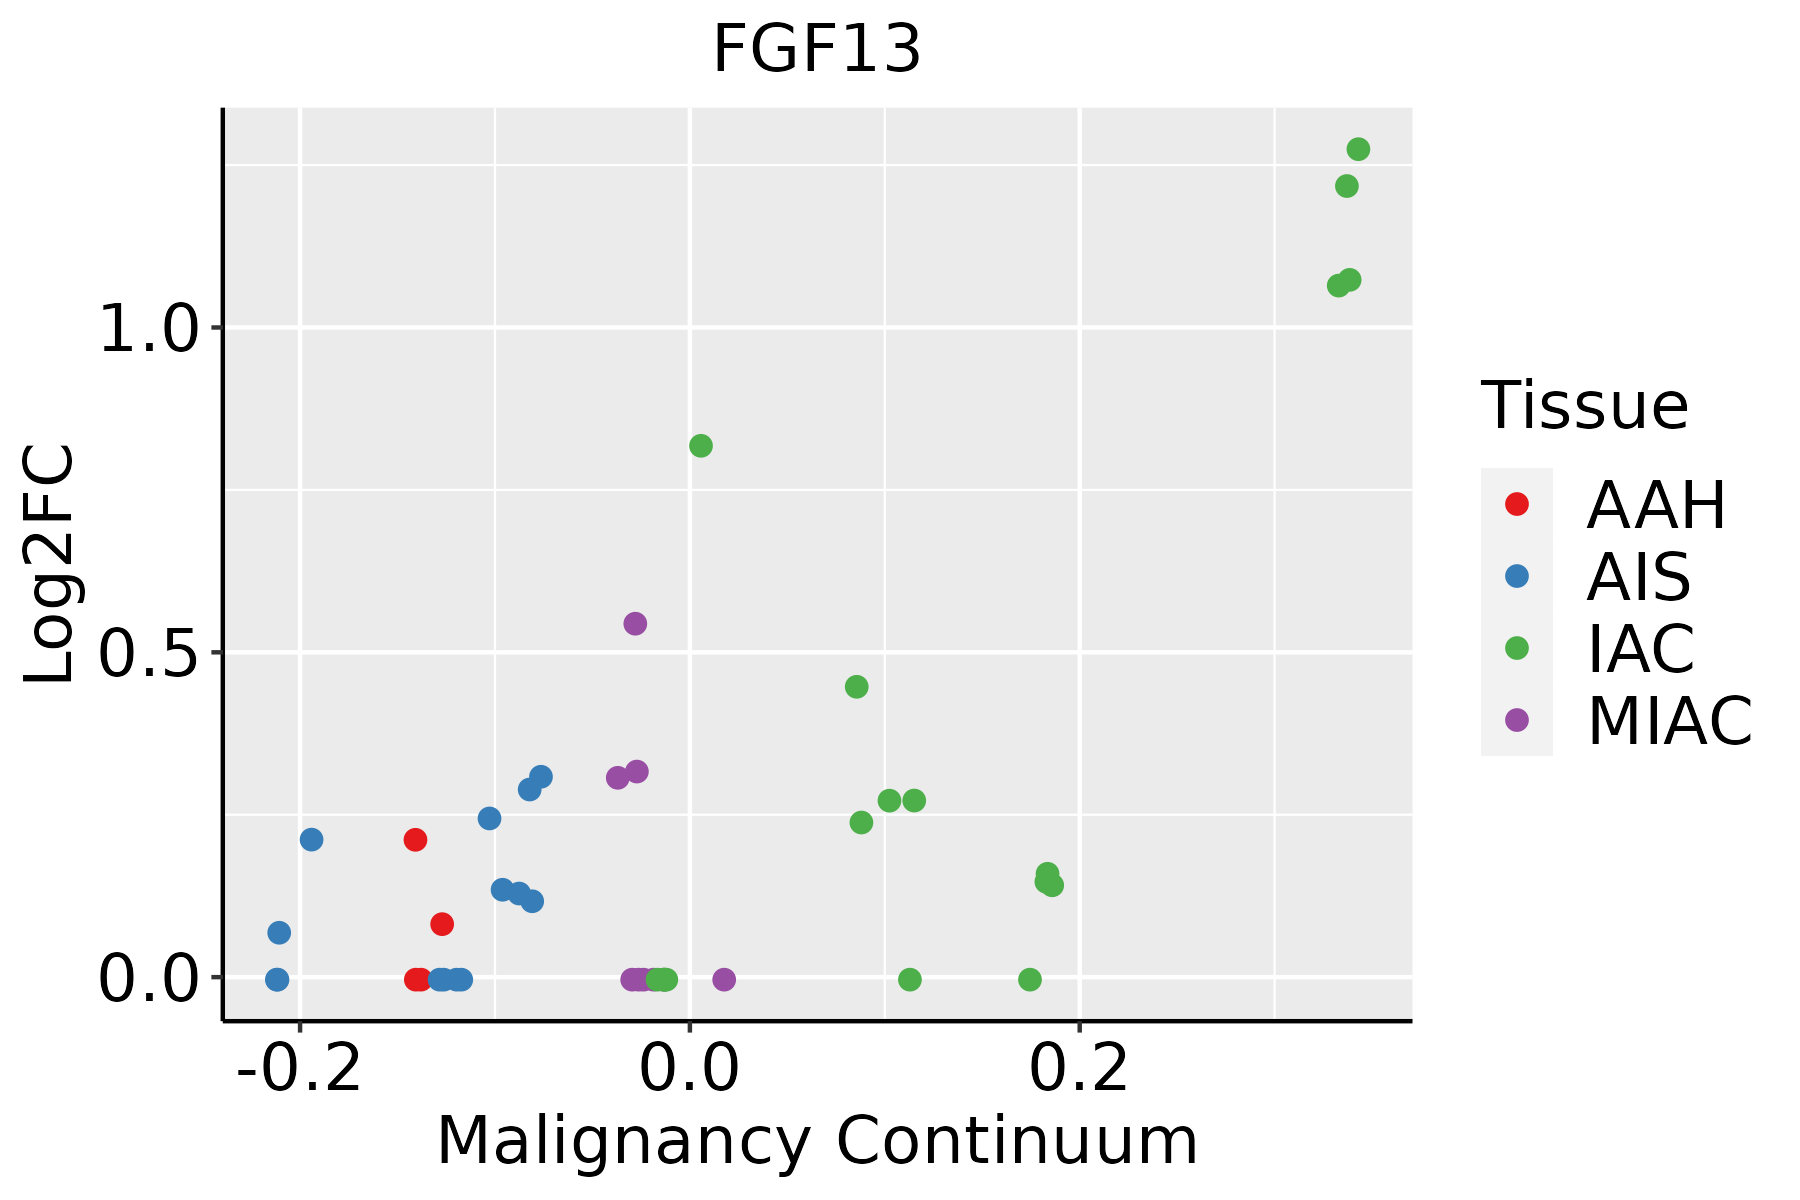 | AAH: Atypical adenomatous hyperplasia |
| AIS: Adenocarcinoma in situ | ||
| IAC: Invasive lung adenocarcinoma | ||
| MIA: Minimally invasive adenocarcinoma | ||
| Prostate | 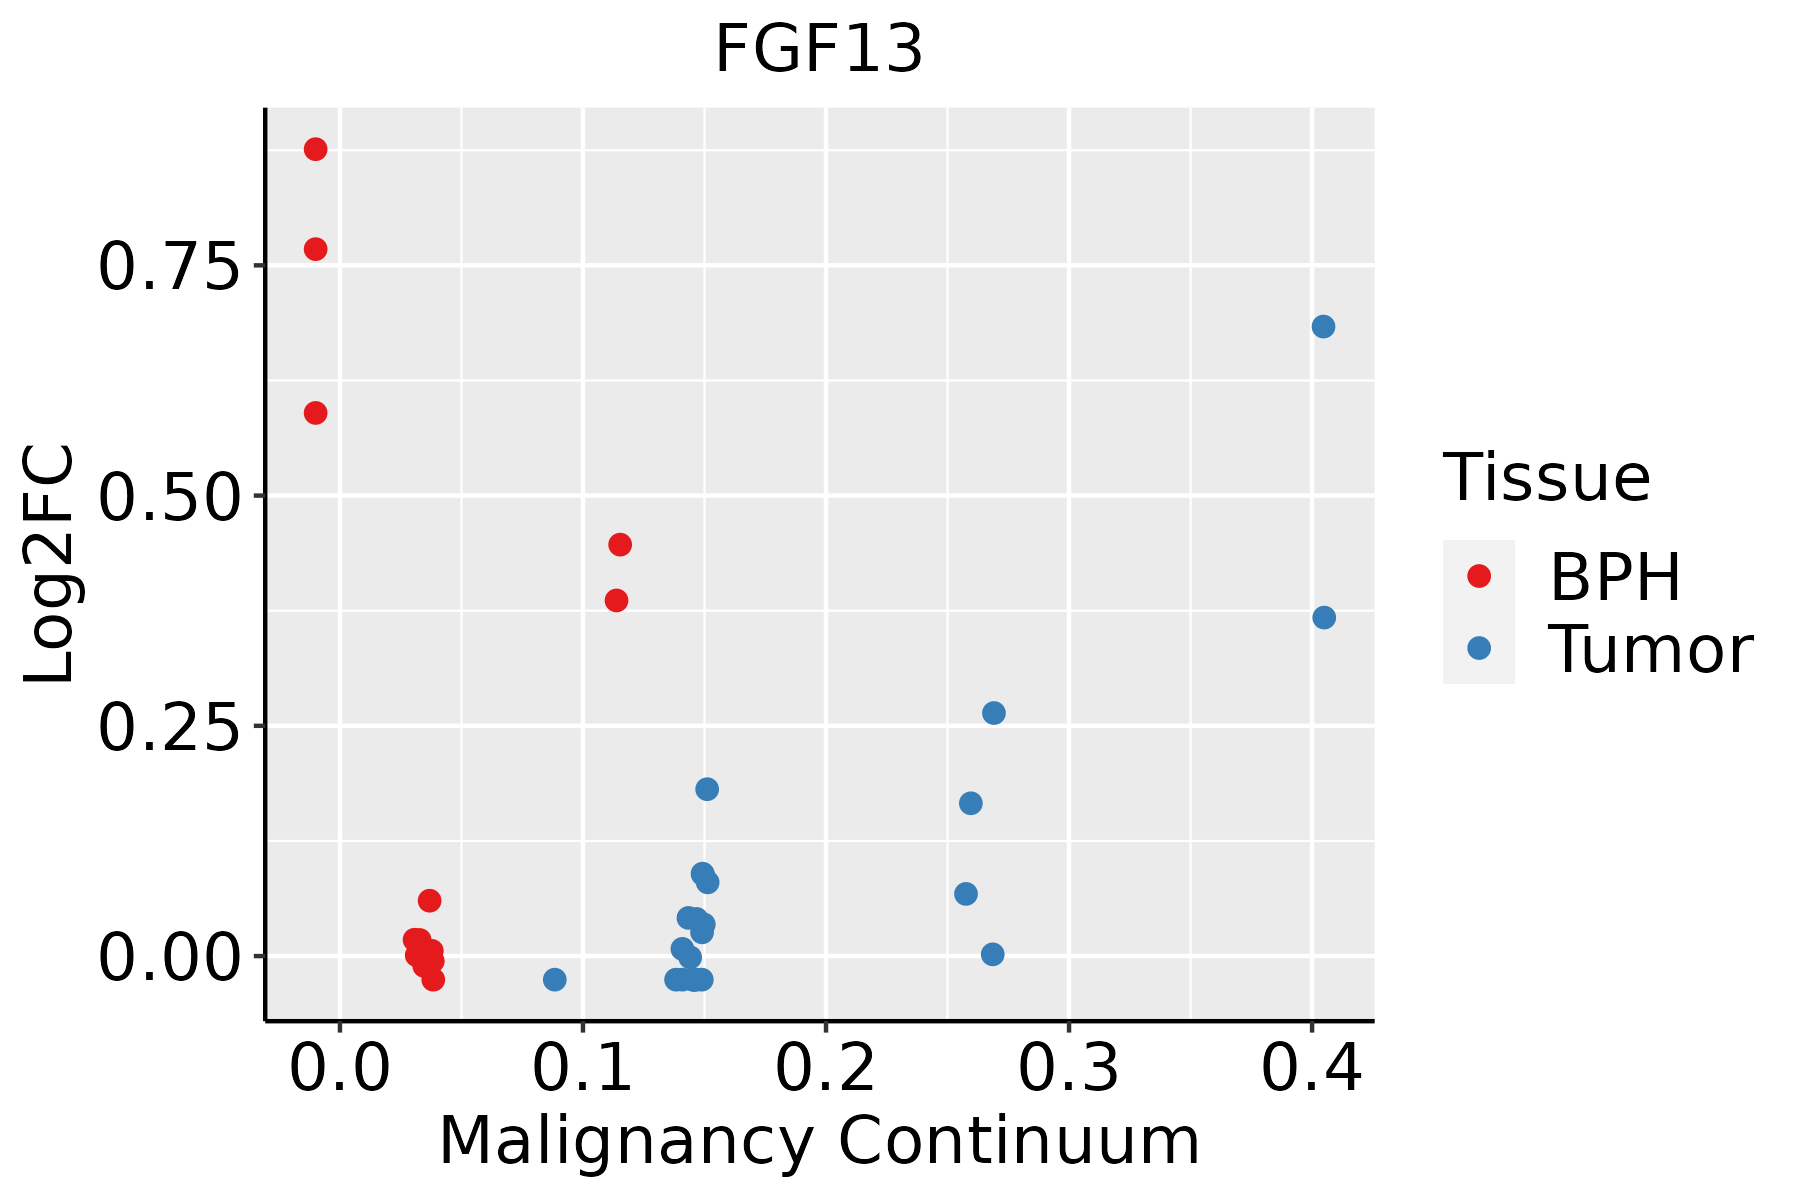 | BPH: Benign Prostatic Hyperplasia |
| ∗log2FC in expression of this searched gene in stem-like cells from each diseased tissue sample relative to stem-like cells in normal samples in each tissue plotted against the malignancy continuum. Samples are colored based on if they are from different disease stage. |
Top |
Malignant transformation related pathway analysis |
| Find out the enriched GO biological processes and KEGG pathways involved in transition from healthy to precancer to cancer |
| Tissue | Disease Stage | Enriched GO biological Processes |
| Colorectum | AD |  |
| Colorectum | SER |  |
| Colorectum | MSS |  |
| Colorectum | MSI-H |  |
| Colorectum | FAP |  |
| ∗Top 15 enriched GO BP terms are showed in the bar plot of each disease state in each tissue. Each row represents a significant GO biological process which is colored according to the -log10(p.adjust). |
| Page: 1 2 3 4 5 6 7 8 9 |
| GO ID | Tissue | Disease Stage | Description | Gene Ratio | Bg Ratio | pvalue | p.adjust | Count |
| GO:003297017 | Endometrium | EEC | regulation of actin filament-based process | 89/2168 | 397/18723 | 4.76e-10 | 4.76e-08 | 89 |
| GO:000716315 | Endometrium | EEC | establishment or maintenance of cell polarity | 56/2168 | 218/18723 | 5.41e-09 | 3.57e-07 | 56 |
| GO:190290317 | Endometrium | EEC | regulation of supramolecular fiber organization | 82/2168 | 383/18723 | 2.11e-08 | 1.25e-06 | 82 |
| GO:006156412 | Endometrium | EEC | axon development | 93/2168 | 467/18723 | 9.60e-08 | 4.69e-06 | 93 |
| GO:007265915 | Endometrium | EEC | protein localization to plasma membrane | 64/2168 | 284/18723 | 1.05e-07 | 5.05e-06 | 64 |
| GO:001604915 | Endometrium | EEC | cell growth | 95/2168 | 482/18723 | 1.16e-07 | 5.54e-06 | 95 |
| GO:003253516 | Endometrium | EEC | regulation of cellular component size | 79/2168 | 383/18723 | 1.98e-07 | 8.93e-06 | 79 |
| GO:006056013 | Endometrium | EEC | developmental growth involved in morphogenesis | 54/2168 | 234/18723 | 4.60e-07 | 1.78e-05 | 54 |
| GO:199077814 | Endometrium | EEC | protein localization to cell periphery | 69/2168 | 333/18723 | 9.71e-07 | 3.31e-05 | 69 |
| GO:000740912 | Endometrium | EEC | axonogenesis | 82/2168 | 418/18723 | 1.03e-06 | 3.49e-05 | 82 |
| GO:005125817 | Endometrium | EEC | protein polymerization | 63/2168 | 297/18723 | 1.24e-06 | 4.07e-05 | 63 |
| GO:003001014 | Endometrium | EEC | establishment of cell polarity | 36/2168 | 143/18723 | 4.57e-06 | 1.15e-04 | 36 |
| GO:190290415 | Endometrium | EEC | negative regulation of supramolecular fiber organization | 40/2168 | 167/18723 | 5.23e-06 | 1.28e-04 | 40 |
| GO:003432914 | Endometrium | EEC | cell junction assembly | 79/2168 | 420/18723 | 8.37e-06 | 1.85e-04 | 79 |
| GO:002241116 | Endometrium | EEC | cellular component disassembly | 82/2168 | 443/18723 | 1.06e-05 | 2.26e-04 | 82 |
| GO:000155814 | Endometrium | EEC | regulation of cell growth | 77/2168 | 414/18723 | 1.64e-05 | 3.16e-04 | 77 |
| GO:009890113 | Endometrium | EEC | regulation of cardiac muscle cell action potential | 12/2168 | 27/18723 | 1.84e-05 | 3.43e-04 | 12 |
| GO:004858813 | Endometrium | EEC | developmental cell growth | 49/2168 | 234/18723 | 2.59e-05 | 4.56e-04 | 49 |
| GO:003298412 | Endometrium | EEC | protein-containing complex disassembly | 47/2168 | 224/18723 | 3.56e-05 | 5.99e-04 | 47 |
| GO:003004814 | Endometrium | EEC | actin filament-based movement | 31/2168 | 127/18723 | 3.90e-05 | 6.56e-04 | 31 |
| Page: 1 2 3 4 5 6 7 8 9 10 11 12 13 14 |
| Pathway ID | Tissue | Disease Stage | Description | Gene Ratio | Bg Ratio | pvalue | p.adjust | qvalue | Count |
| Page: 1 |
Top |
Cell-cell communication analysis |
| Identification of potential cell-cell interactions between two cell types and their ligand-receptor pairs for different disease states |
| Ligand | Receptor | LRpair | Pathway | Tissue | Disease Stage |
| Page: 1 |
Top |
Single-cell gene regulatory network inference analysis |
| Find out the significant the regulons (TFs) and the target genes of each regulon across cell types for different disease states |
| TF | Cell Type | Tissue | Disease Stage | Target Gene | RSS | Regulon Activity |
| ∗The dot plots of a searched regulon are shown for all cell subpopulations in each disease state of each tissue based on the regulon specific score inferred using pySCENIC and by calculating the average expression. |
| Page: 1 |
Top |
Somatic mutation of malignant transformation related genes |
| Annotation of somatic variants for genes involved in malignant transformation |
| Hugo Symbol | Variant Class | Variant Classification | dbSNP RS | HGVSc | HGVSp | HGVSp Short | SWISSPROT | BIOTYPE | SIFT | PolyPhen | Tumor Sample Barcode | Tissue | Histology | Sex | Age | Stage | Therapy Types | Drugs | Outcome |
| FGF13 | SNV | Missense_Mutation | c.500N>T | p.Ser167Leu | p.S167L | Q92913 | protein_coding | deleterious(0) | probably_damaging(1) | TCGA-BH-A18P-01 | Breast | breast invasive carcinoma | Female | <65 | I/II | Unknown | Unknown | PD | |
| FGF13 | SNV | Missense_Mutation | c.705N>C | p.Lys235Asn | p.K235N | Q92913 | protein_coding | deleterious_low_confidence(0.01) | possibly_damaging(0.696) | TCGA-C8-A275-01 | Breast | breast invasive carcinoma | Female | <65 | I/II | Unknown | Unknown | SD | |
| FGF13 | insertion | Frame_Shift_Ins | novel | c.26_27insGTGCATGTGTGTGCGTGTGCGCGAGTGTGCAT | p.Glu10CysfsTer11 | p.E10Cfs*11 | Q92913 | protein_coding | TCGA-E9-A1NC-01 | Breast | breast invasive carcinoma | Female | <65 | I/II | Chemotherapy | doxorubicin | CR | ||
| FGF13 | deletion | Frame_Shift_Del | novel | c.555delA | p.Glu186LysfsTer5 | p.E186Kfs*5 | Q92913 | protein_coding | TCGA-EW-A2FV-01 | Breast | breast invasive carcinoma | Female | <65 | III/IV | Chemotherapy | docetaxel | SD | ||
| FGF13 | SNV | Missense_Mutation | novel | c.8G>A | p.Gly3Glu | p.G3E | Q92913 | protein_coding | deleterious_low_confidence(0) | benign(0.066) | TCGA-VS-A958-01 | Cervix | cervical & endocervical cancer | Female | <65 | I/II | Chemotherapy | cisplatin | CR |
| FGF13 | SNV | Missense_Mutation | c.604N>T | p.Ala202Ser | p.A202S | Q92913 | protein_coding | tolerated(0.46) | possibly_damaging(0.505) | TCGA-A6-5665-01 | Colorectum | colon adenocarcinoma | Female | >=65 | I/II | Unknown | Unknown | PD | |
| FGF13 | SNV | Missense_Mutation | novel | c.190N>A | p.His64Asn | p.H64N | Q92913 | protein_coding | tolerated(0.55) | benign(0.046) | TCGA-AA-3855-01 | Colorectum | colon adenocarcinoma | Male | >=65 | I/II | Unknown | Unknown | SD |
| FGF13 | SNV | Missense_Mutation | rs762632439 | c.680N>A | p.Arg227Gln | p.R227Q | Q92913 | protein_coding | tolerated_low_confidence(0.27) | possibly_damaging(0.815) | TCGA-AA-A010-01 | Colorectum | colon adenocarcinoma | Female | <65 | I/II | Chemotherapy | folinic | CR |
| FGF13 | SNV | Missense_Mutation | c.550N>G | p.Asn184Asp | p.N184D | Q92913 | protein_coding | tolerated(0.08) | possibly_damaging(0.448) | TCGA-AD-6964-01 | Colorectum | colon adenocarcinoma | Male | <65 | III/IV | Chemotherapy | folfox | PD | |
| FGF13 | SNV | Missense_Mutation | novel | c.605N>T | p.Ala202Val | p.A202V | Q92913 | protein_coding | deleterious(0.04) | probably_damaging(0.947) | TCGA-AZ-6598-01 | Colorectum | colon adenocarcinoma | Female | >=65 | I/II | Unknown | Unknown | SD |
| Page: 1 2 3 4 5 6 |
Top |
Related drugs of malignant transformation related genes |
| Identification of chemicals and drugs interact with genes involved in malignant transfromation |
| (DGIdb 4.0) |
| Entrez ID | Symbol | Category | Interaction Types | Drug Claim Name | Drug Name | PMIDs |
| Page: 1 |

Copyright 2023-Present -The University of Texas Health Science Center at Houston |