
|
|||||
|
 | |
| |
| |
| |
| |
| |
|
Gene: FGF11 |
Gene summary for FGF11 |
| Gene information | Species | Human | Gene symbol | FGF11 | Gene ID | 2256 |
| Gene name | fibroblast growth factor 11 | |
| Gene Alias | FGF-11 | |
| Cytomap | 17p13.1 | |
| Gene Type | protein-coding | GO ID | GO:0002028 | UniProtAcc | B7Z1C3 |
Top |
Malignant transformation analysis |
| Identification of the aberrant gene expression in precancerous and cancerous lesions by comparing the gene expression of stem-like cells in diseased tissues with normal stem cells |
| Entrez ID | Symbol | Replicates | Species | Organ | Tissue | Adj P-value | Log2FC | Malignancy |
| 2256 | FGF11 | LZE4T | Human | Esophagus | ESCC | 5.73e-13 | 3.45e-01 | 0.0811 |
| 2256 | FGF11 | LZE8T | Human | Esophagus | ESCC | 2.72e-03 | 1.33e-01 | 0.067 |
| 2256 | FGF11 | LZE20T | Human | Esophagus | ESCC | 1.20e-05 | 2.08e-01 | 0.0662 |
| 2256 | FGF11 | P1T-E | Human | Esophagus | ESCC | 7.11e-04 | 1.84e-01 | 0.0875 |
| 2256 | FGF11 | P4T-E | Human | Esophagus | ESCC | 2.81e-13 | 3.28e-01 | 0.1323 |
| 2256 | FGF11 | P5T-E | Human | Esophagus | ESCC | 4.24e-18 | 2.82e-01 | 0.1327 |
| 2256 | FGF11 | P10T-E | Human | Esophagus | ESCC | 1.30e-15 | 2.75e-01 | 0.116 |
| 2256 | FGF11 | P11T-E | Human | Esophagus | ESCC | 1.13e-06 | 3.08e-01 | 0.1426 |
| 2256 | FGF11 | P12T-E | Human | Esophagus | ESCC | 9.35e-10 | 2.15e-01 | 0.1122 |
| 2256 | FGF11 | P15T-E | Human | Esophagus | ESCC | 7.37e-19 | 4.15e-01 | 0.1149 |
| 2256 | FGF11 | P16T-E | Human | Esophagus | ESCC | 3.28e-14 | 2.23e-01 | 0.1153 |
| 2256 | FGF11 | P19T-E | Human | Esophagus | ESCC | 5.57e-05 | 5.18e-01 | 0.1662 |
| 2256 | FGF11 | P21T-E | Human | Esophagus | ESCC | 1.13e-16 | 3.84e-01 | 0.1617 |
| 2256 | FGF11 | P23T-E | Human | Esophagus | ESCC | 9.87e-03 | 1.11e-01 | 0.108 |
| 2256 | FGF11 | P24T-E | Human | Esophagus | ESCC | 4.17e-05 | 1.69e-01 | 0.1287 |
| 2256 | FGF11 | P26T-E | Human | Esophagus | ESCC | 2.56e-16 | 3.34e-01 | 0.1276 |
| 2256 | FGF11 | P27T-E | Human | Esophagus | ESCC | 8.40e-04 | 1.42e-01 | 0.1055 |
| 2256 | FGF11 | P28T-E | Human | Esophagus | ESCC | 9.35e-10 | 1.97e-01 | 0.1149 |
| 2256 | FGF11 | P30T-E | Human | Esophagus | ESCC | 9.20e-05 | 2.02e-01 | 0.137 |
| 2256 | FGF11 | P31T-E | Human | Esophagus | ESCC | 2.05e-07 | 1.80e-01 | 0.1251 |
| Page: 1 2 3 |
| Tissue | Expression Dynamics | Abbreviation |
| Esophagus | 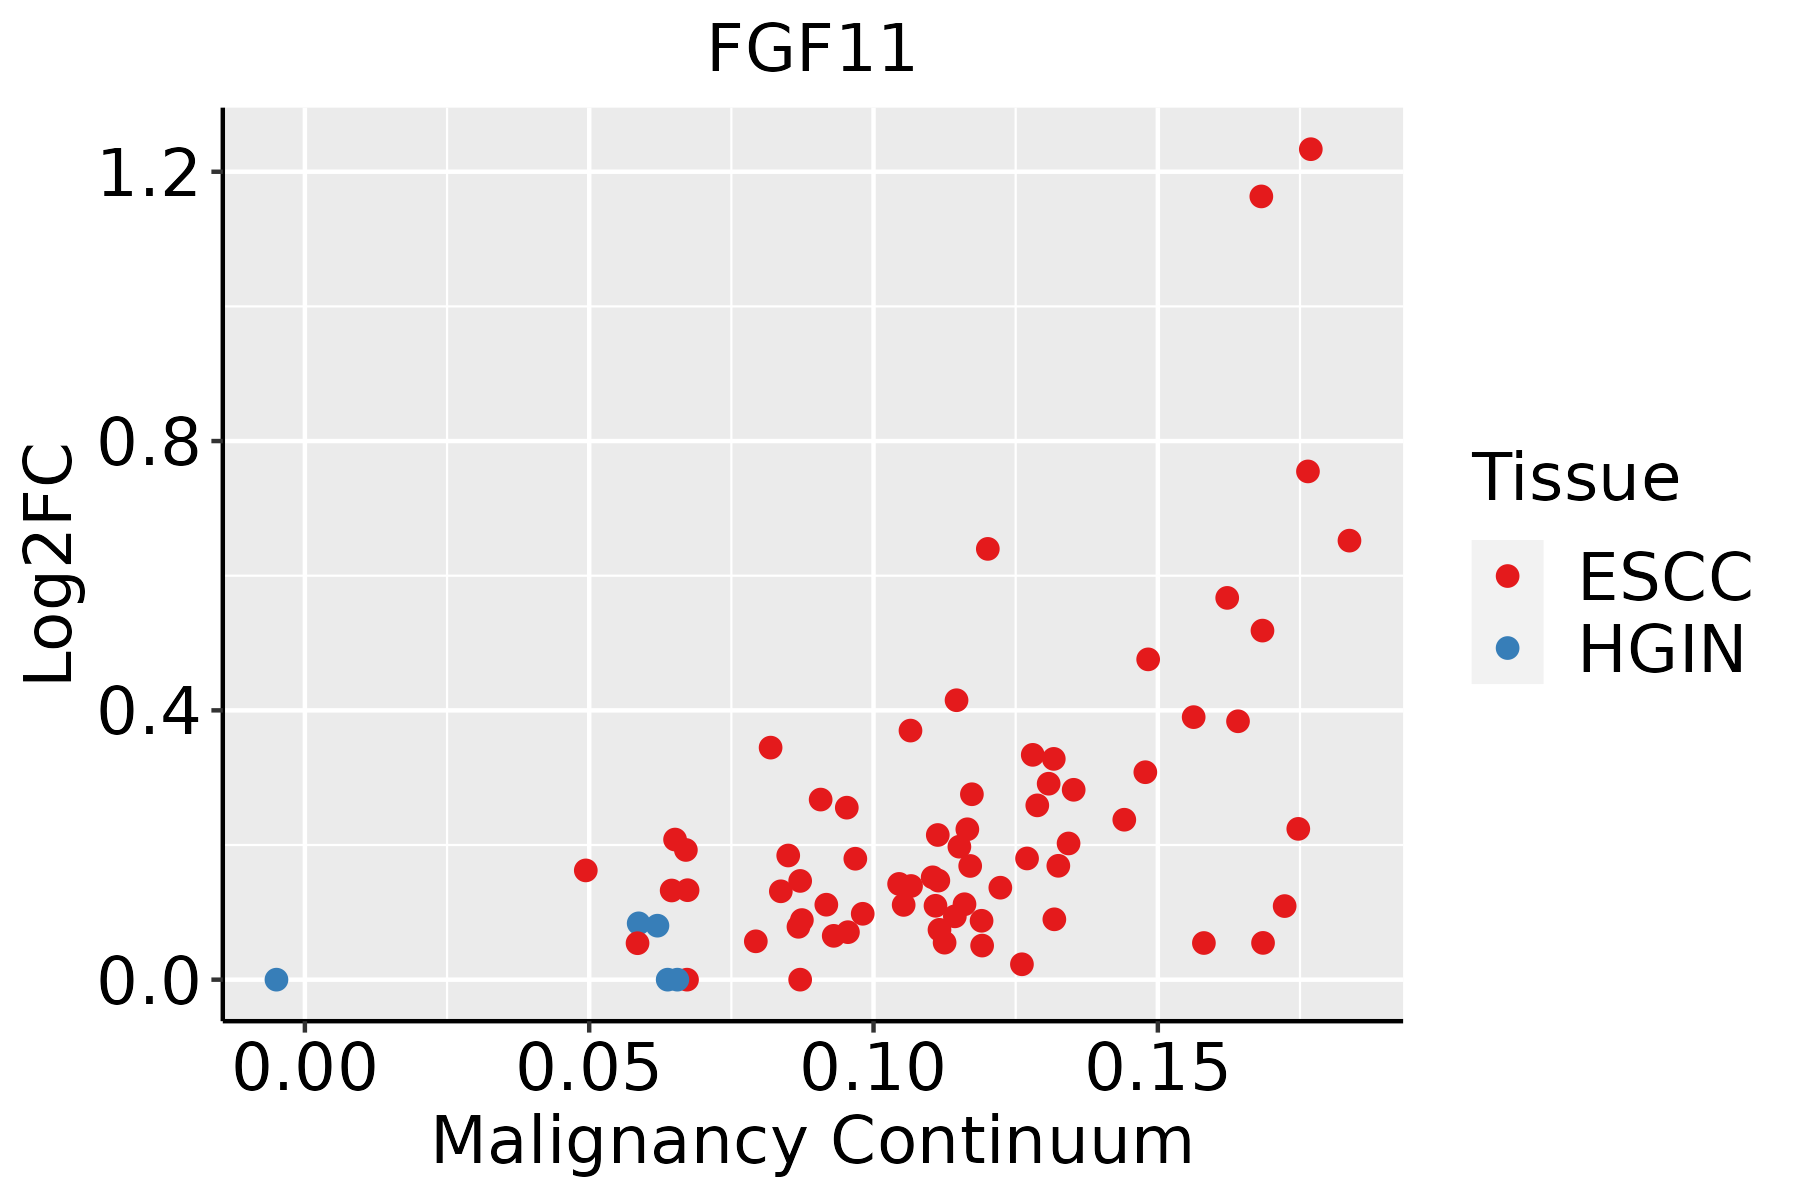 | ESCC: Esophageal squamous cell carcinoma |
| HGIN: High-grade intraepithelial neoplasias | ||
| LGIN: Low-grade intraepithelial neoplasias |
| ∗log2FC in expression of this searched gene in stem-like cells from each diseased tissue sample relative to stem-like cells in normal samples in each tissue plotted against the malignancy continuum. Samples are colored based on if they are from different disease stage. |
Top |
Malignant transformation related pathway analysis |
| Find out the enriched GO biological processes and KEGG pathways involved in transition from healthy to precancer to cancer |
| Tissue | Disease Stage | Enriched GO biological Processes |
| Colorectum | AD |  |
| Colorectum | SER |  |
| Colorectum | MSS |  |
| Colorectum | MSI-H |  |
| Colorectum | FAP |  |
| ∗Top 15 enriched GO BP terms are showed in the bar plot of each disease state in each tissue. Each row represents a significant GO biological process which is colored according to the -log10(p.adjust). |
| Page: 1 2 3 4 5 6 7 8 9 |
| GO ID | Tissue | Disease Stage | Description | Gene Ratio | Bg Ratio | pvalue | p.adjust | Count |
| Page: 1 |
| Pathway ID | Tissue | Disease Stage | Description | Gene Ratio | Bg Ratio | pvalue | p.adjust | qvalue | Count |
| Page: 1 |
Top |
Cell-cell communication analysis |
| Identification of potential cell-cell interactions between two cell types and their ligand-receptor pairs for different disease states |
| Ligand | Receptor | LRpair | Pathway | Tissue | Disease Stage |
| Page: 1 |
Top |
Single-cell gene regulatory network inference analysis |
| Find out the significant the regulons (TFs) and the target genes of each regulon across cell types for different disease states |
| TF | Cell Type | Tissue | Disease Stage | Target Gene | RSS | Regulon Activity |
| ∗The dot plots of a searched regulon are shown for all cell subpopulations in each disease state of each tissue based on the regulon specific score inferred using pySCENIC and by calculating the average expression. |
| Page: 1 |
Top |
Somatic mutation of malignant transformation related genes |
| Annotation of somatic variants for genes involved in malignant transformation |
| Hugo Symbol | Variant Class | Variant Classification | dbSNP RS | HGVSc | HGVSp | HGVSp Short | SWISSPROT | BIOTYPE | SIFT | PolyPhen | Tumor Sample Barcode | Tissue | Histology | Sex | Age | Stage | Therapy Types | Drugs | Outcome |
| FGF11 | SNV | Missense_Mutation | rs370094891 | c.557N>A | p.Arg186Gln | p.R186Q | Q92914 | protein_coding | deleterious(0.02) | benign(0.351) | TCGA-A2-A0EM-01 | Breast | breast invasive carcinoma | Female | >=65 | I/II | Hormone Therapy | tamoxiphen | SD |
| FGF11 | SNV | Missense_Mutation | rs756454648 | c.262N>A | p.Asp88Asn | p.D88N | Q92914 | protein_coding | tolerated(0.21) | possibly_damaging(0.476) | TCGA-DS-A1OB-01 | Cervix | cervical & endocervical cancer | Female | <65 | I/II | Chemotherapy | carboplatin | PD |
| FGF11 | SNV | Missense_Mutation | rs201458275 | c.232N>T | p.Arg78Cys | p.R78C | Q92914 | protein_coding | deleterious(0.01) | probably_damaging(0.988) | TCGA-Q1-A5R1-01 | Cervix | cervical & endocervical cancer | Female | <65 | I/II | Unknown | Unknown | SD |
| FGF11 | SNV | Missense_Mutation | c.640N>C | p.Val214Leu | p.V214L | Q92914 | protein_coding | tolerated(0.76) | probably_damaging(0.935) | TCGA-AA-3530-01 | Colorectum | colon adenocarcinoma | Male | >=65 | I/II | Unknown | Unknown | SD | |
| FGF11 | SNV | Missense_Mutation | c.343N>T | p.Thr115Ser | p.T115S | Q92914 | protein_coding | tolerated(0.43) | benign(0.05) | TCGA-AA-A01X-01 | Colorectum | colon adenocarcinoma | Female | >=65 | III/IV | Unknown | Unknown | PD | |
| FGF11 | SNV | Missense_Mutation | rs548703936 | c.488N>A | p.Arg163His | p.R163H | Q92914 | protein_coding | deleterious(0.01) | probably_damaging(0.991) | TCGA-AZ-4315-01 | Colorectum | colon adenocarcinoma | Male | <65 | I/II | Unknown | Unknown | SD |
| FGF11 | SNV | Missense_Mutation | novel | c.422N>T | p.Ala141Val | p.A141V | Q92914 | protein_coding | deleterious(0.04) | benign(0.065) | TCGA-A5-A0G2-01 | Endometrium | uterine corpus endometrioid carcinoma | Female | <65 | III/IV | Unknown | Unknown | SD |
| FGF11 | SNV | Missense_Mutation | rs765090559 | c.254N>T | p.Ala85Val | p.A85V | Q92914 | protein_coding | tolerated(0.09) | benign(0.013) | TCGA-AX-A1CE-01 | Endometrium | uterine corpus endometrioid carcinoma | Female | <65 | I/II | Unspecific | Paclitaxel | SD |
| FGF11 | SNV | Missense_Mutation | novel | c.559G>T | p.Val187Phe | p.V187F | Q92914 | protein_coding | deleterious(0) | probably_damaging(0.996) | TCGA-AX-A2HC-01 | Endometrium | uterine corpus endometrioid carcinoma | Female | <65 | III/IV | Chemotherapy | paclitaxel | PD |
| FGF11 | SNV | Missense_Mutation | rs765090559 | c.254C>T | p.Ala85Val | p.A85V | Q92914 | protein_coding | tolerated(0.09) | benign(0.013) | TCGA-B5-A0JY-01 | Endometrium | uterine corpus endometrioid carcinoma | Female | <65 | III/IV | Chemotherapy | doxorubicin | SD |
| Page: 1 2 |
Top |
Related drugs of malignant transformation related genes |
| Identification of chemicals and drugs interact with genes involved in malignant transfromation |
| (DGIdb 4.0) |
| Entrez ID | Symbol | Category | Interaction Types | Drug Claim Name | Drug Name | PMIDs |
| Page: 1 |

Copyright 2023-Present -The University of Texas Health Science Center at Houston |