| Tissue | Expression Dynamics | Abbreviation |
| Cervix | 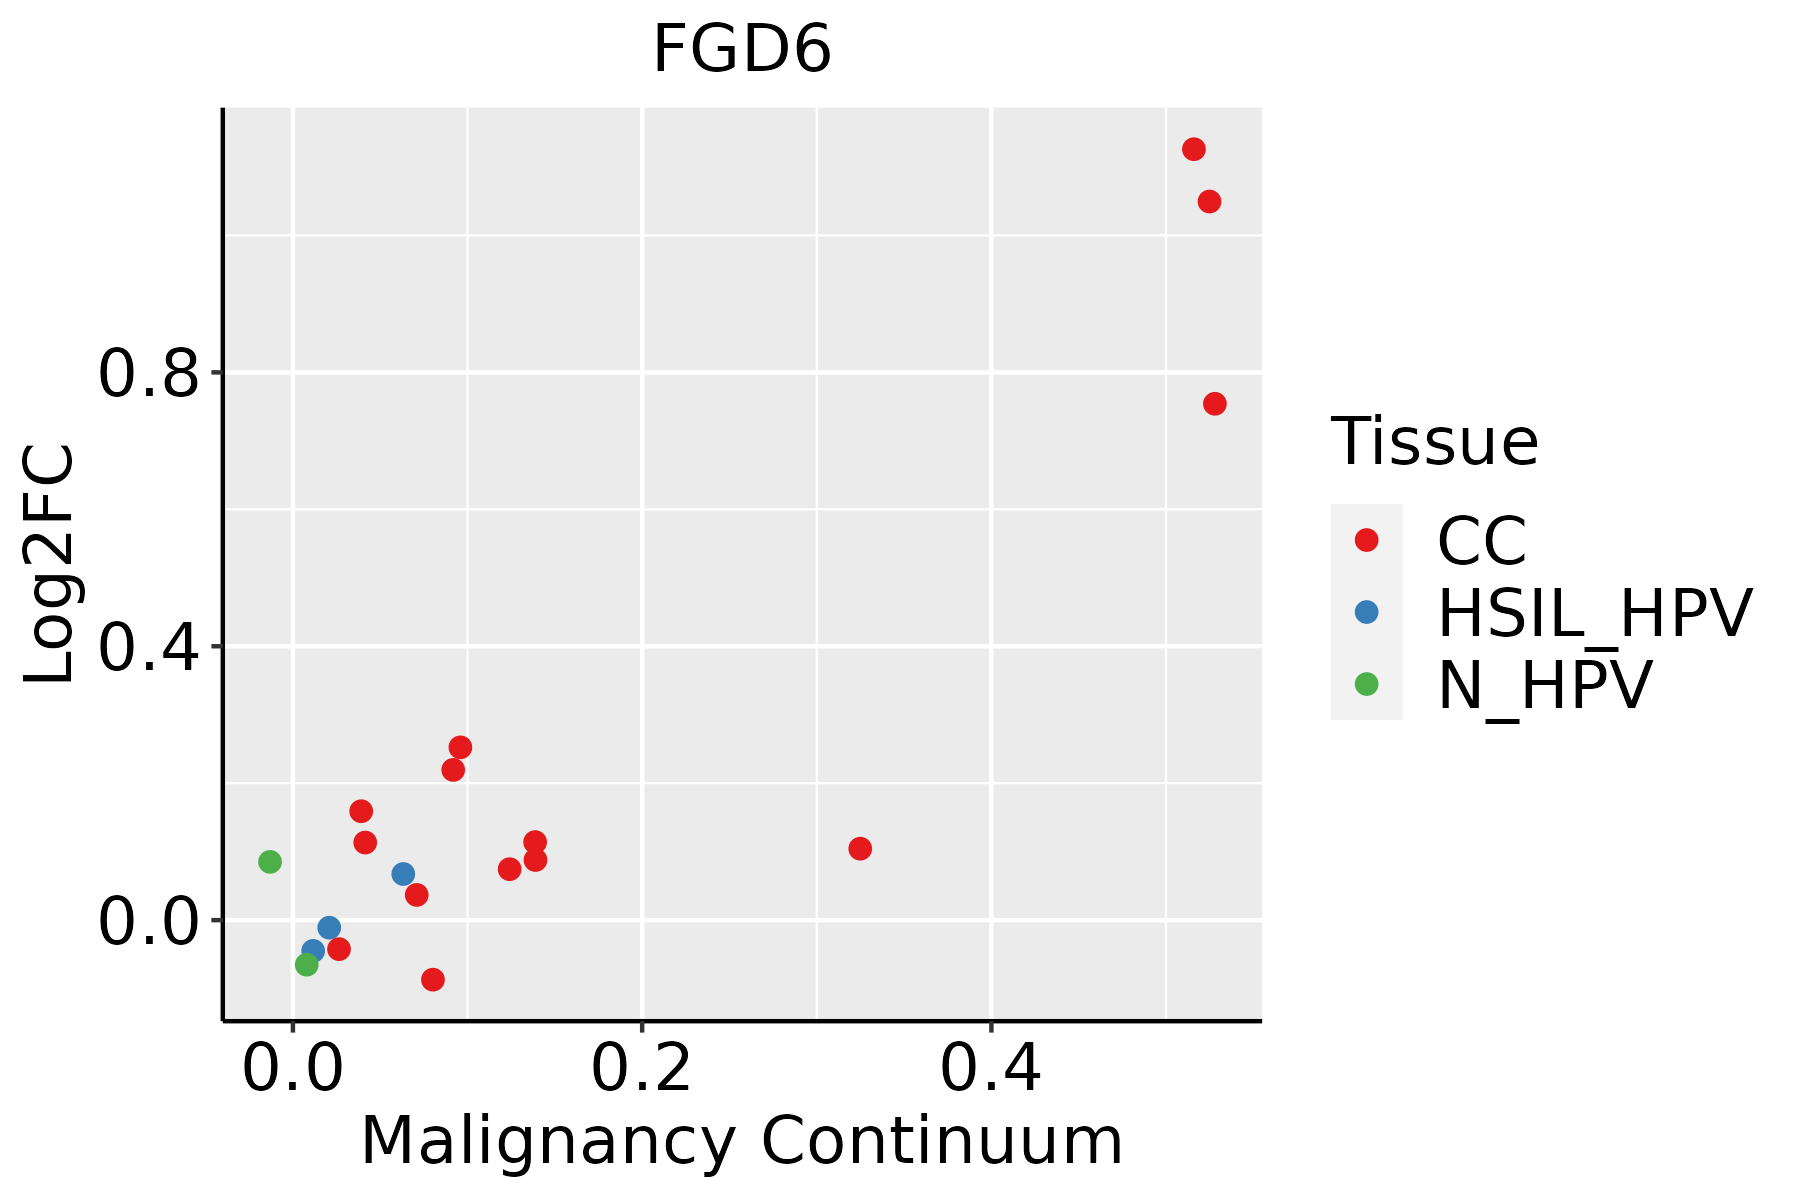 | CC: Cervix cancer |
| HSIL_HPV: HPV-infected high-grade squamous intraepithelial lesions |
| N_HPV: HPV-infected normal cervix |
| Esophagus | 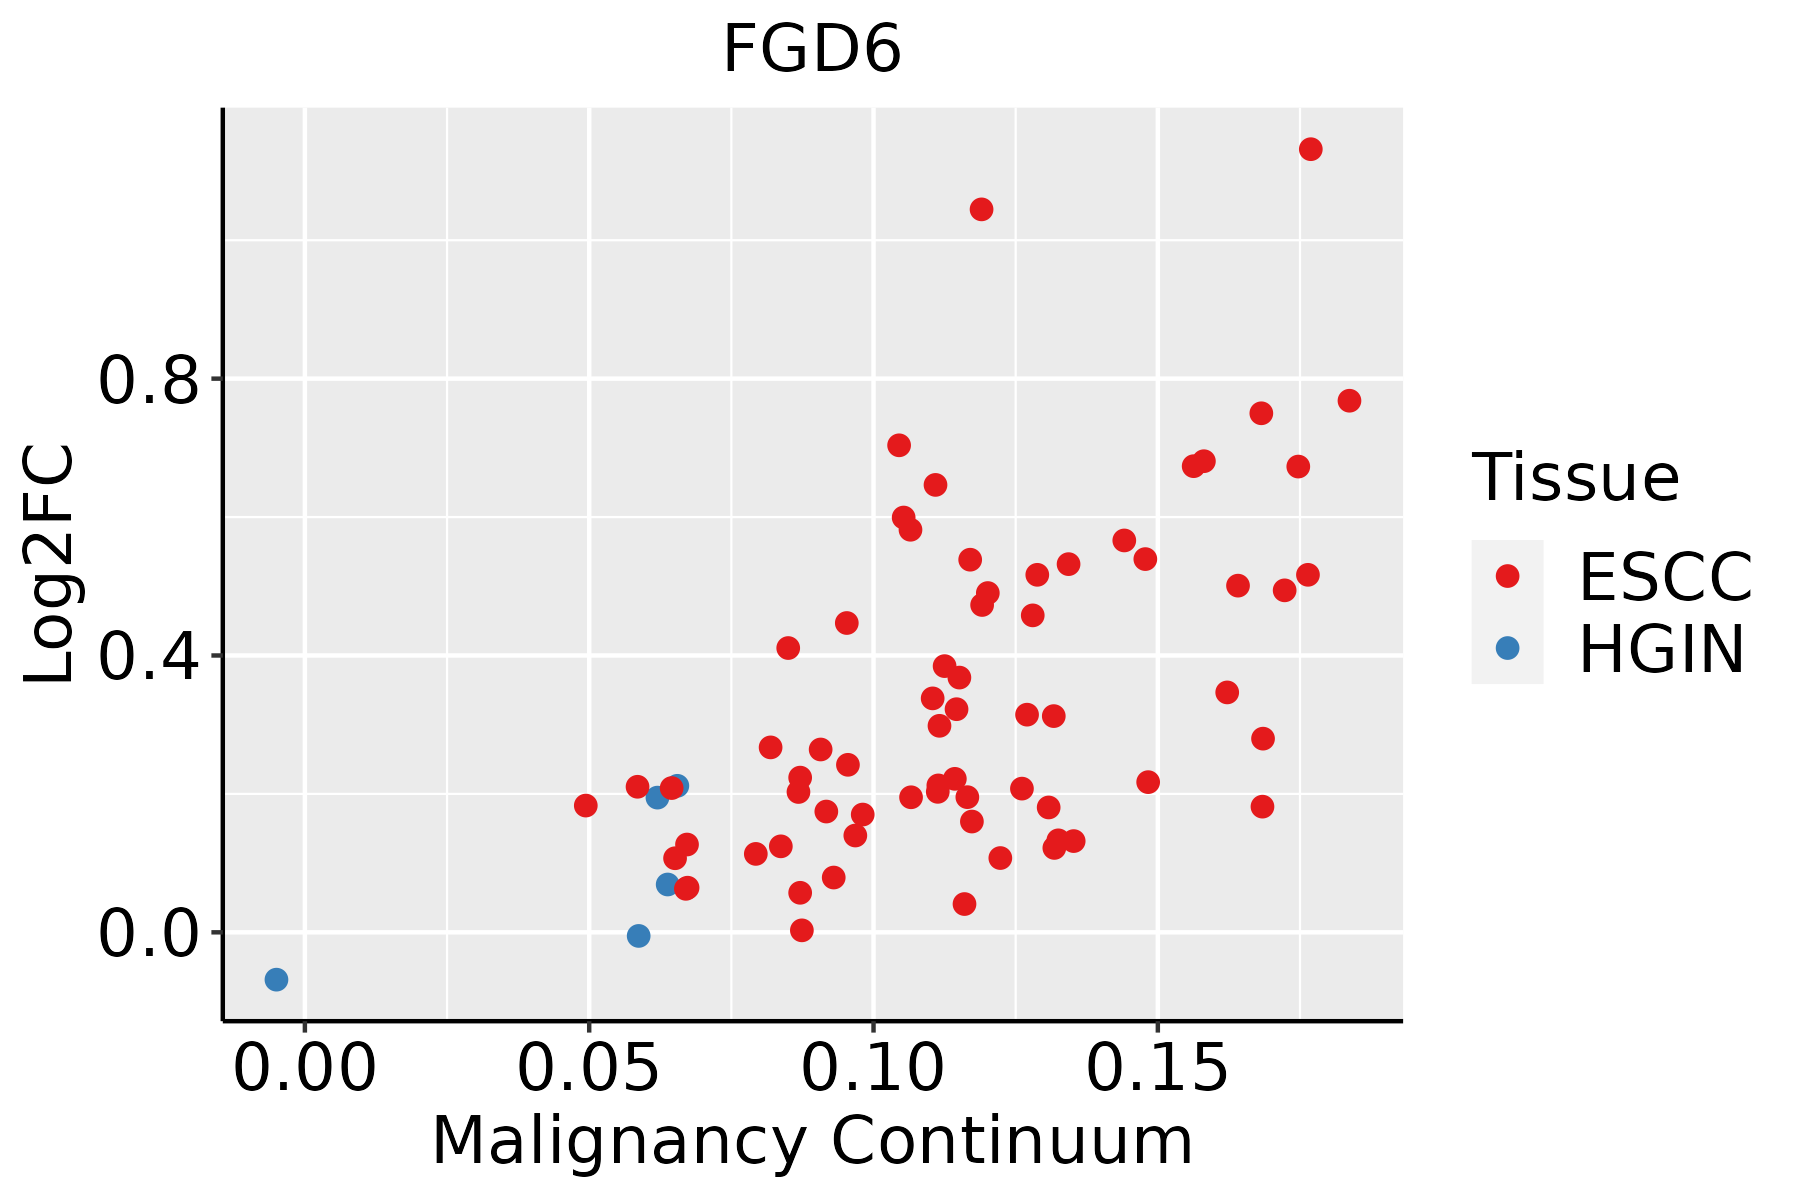 | ESCC: Esophageal squamous cell carcinoma |
| HGIN: High-grade intraepithelial neoplasias |
| LGIN: Low-grade intraepithelial neoplasias |
| Liver |  | HCC: Hepatocellular carcinoma |
| NAFLD: Non-alcoholic fatty liver disease |
| Lung |  | AAH: Atypical adenomatous hyperplasia |
| AIS: Adenocarcinoma in situ |
| IAC: Invasive lung adenocarcinoma |
| MIA: Minimally invasive adenocarcinoma |
| Oral Cavity | 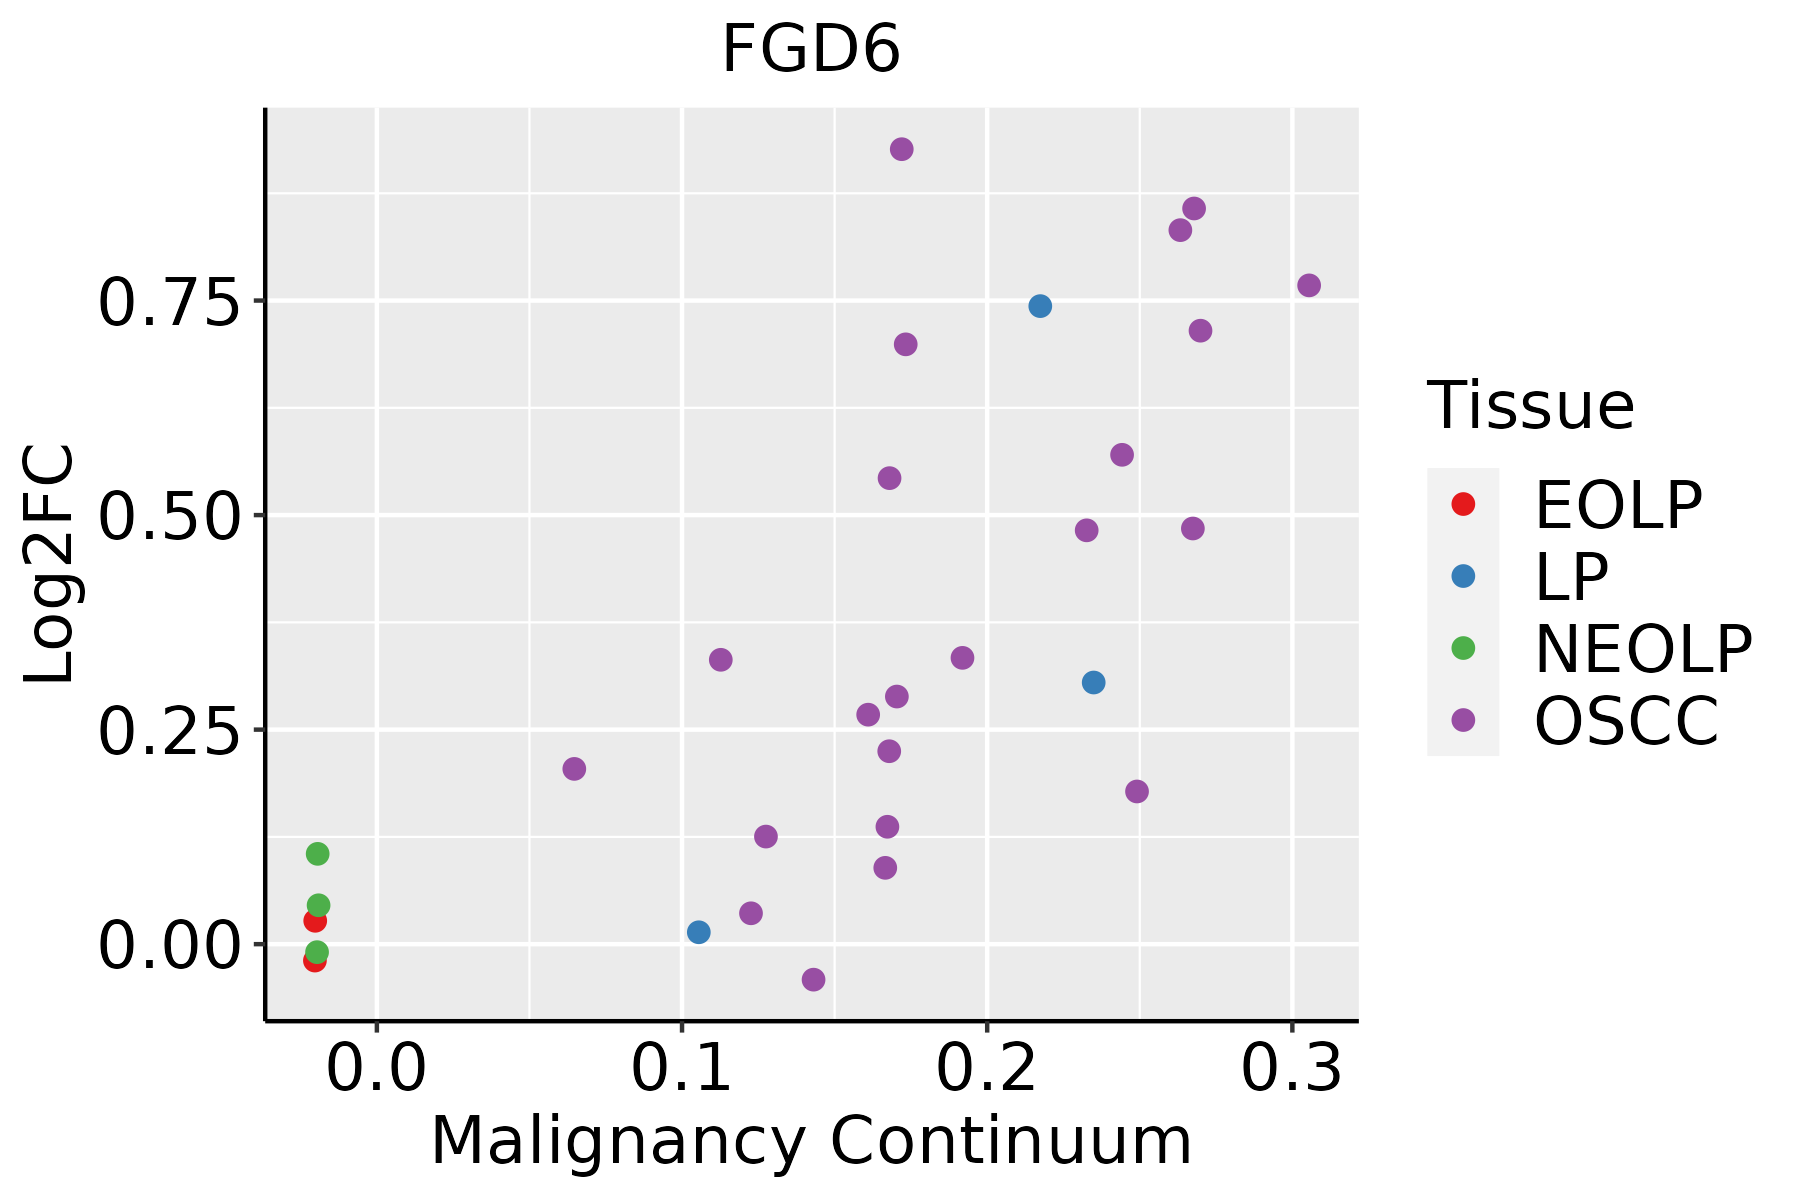 | EOLP: Erosive Oral lichen planus |
| LP: leukoplakia |
| NEOLP: Non-erosive oral lichen planus |
| OSCC: Oral squamous cell carcinoma |
| Prostate | 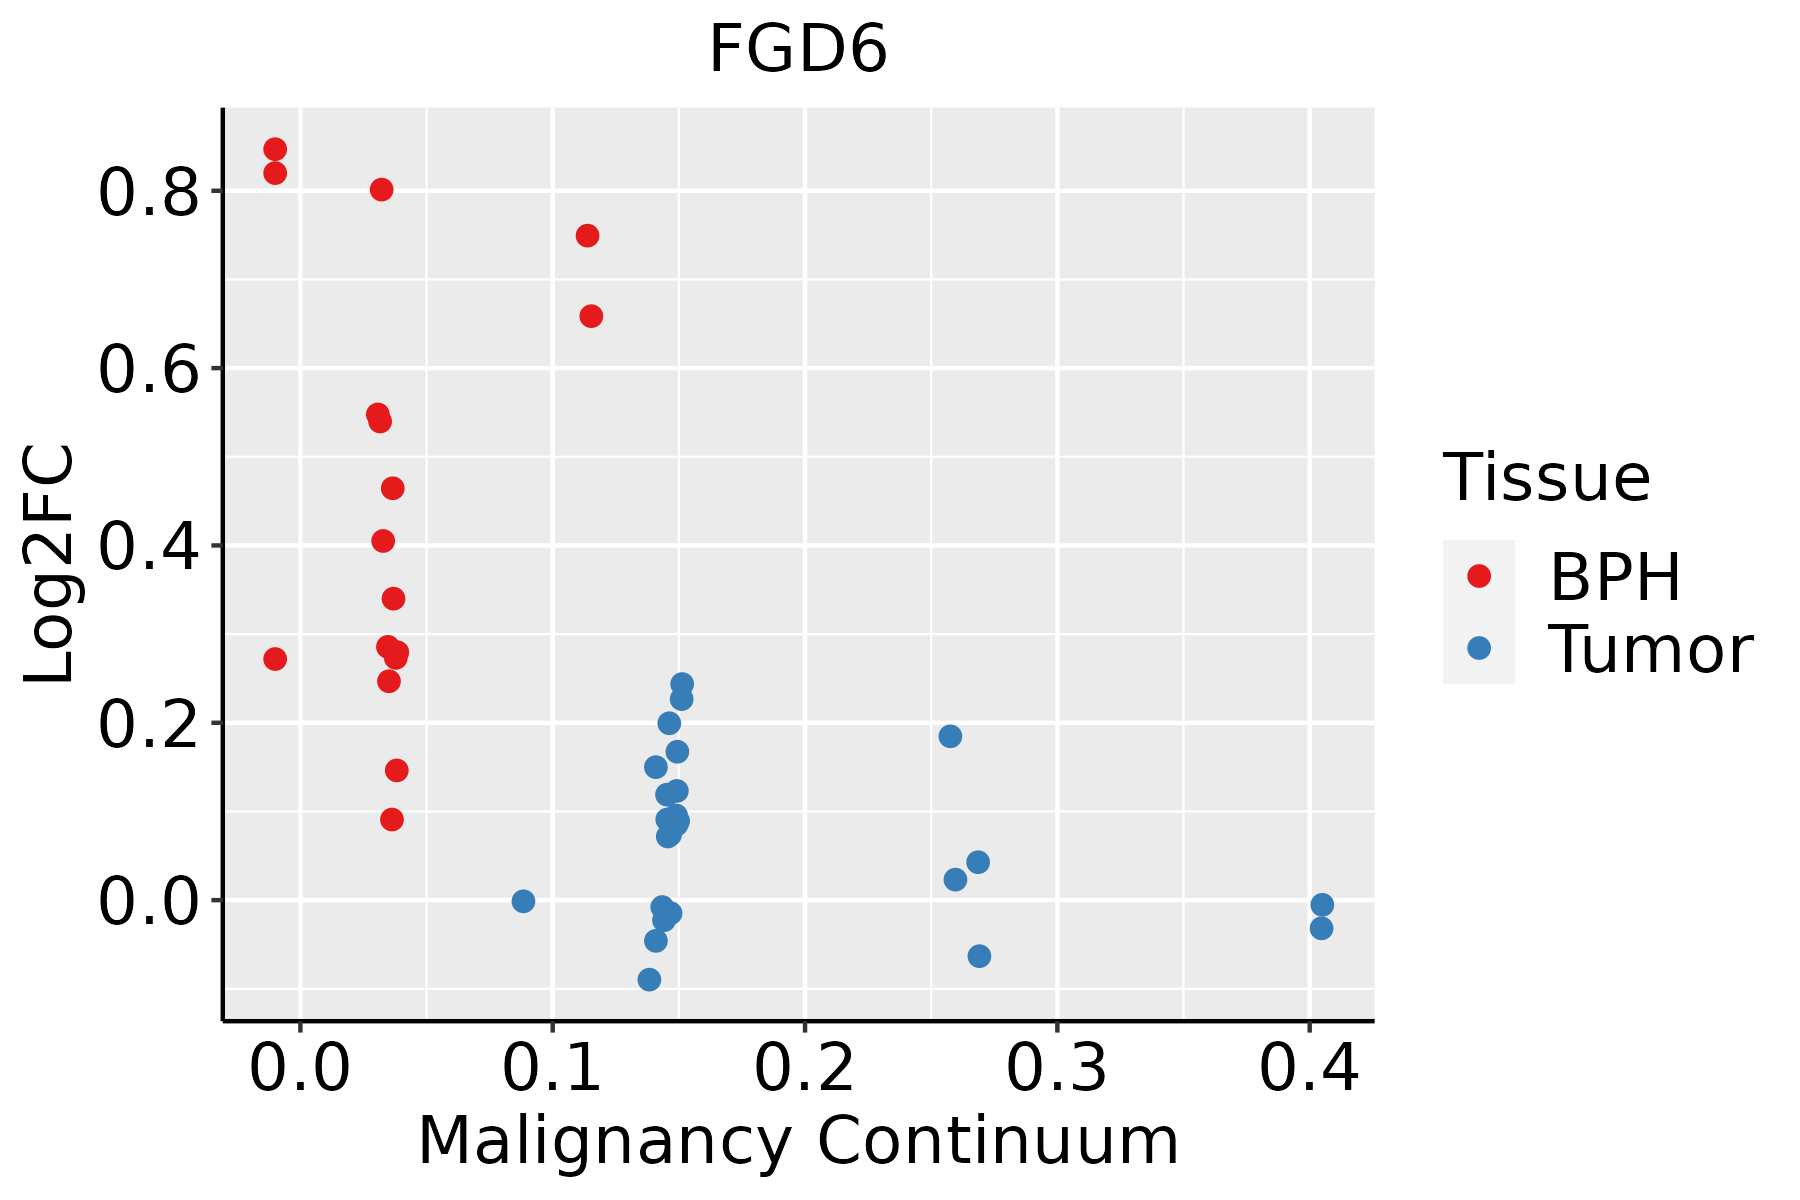 | BPH: Benign Prostatic Hyperplasia |
| Skin |  | AK: Actinic keratosis |
| cSCC: Cutaneous squamous cell carcinoma |
| SCCIS:squamous cell carcinoma in situ |
| GO ID | Tissue | Disease Stage | Description | Gene Ratio | Bg Ratio | pvalue | p.adjust | Count |
| GO:002260410 | Cervix | CC | regulation of cell morphogenesis | 84/2311 | 309/18723 | 1.00e-12 | 4.29e-10 | 84 |
| GO:00430877 | Cervix | CC | regulation of GTPase activity | 79/2311 | 348/18723 | 4.21e-08 | 2.60e-06 | 79 |
| GO:00083608 | Cervix | CC | regulation of cell shape | 38/2311 | 154/18723 | 1.86e-05 | 3.46e-04 | 38 |
| GO:002260420 | Esophagus | ESCC | regulation of cell morphogenesis | 180/8552 | 309/18723 | 5.19e-06 | 5.45e-05 | 180 |
| GO:000836018 | Esophagus | ESCC | regulation of cell shape | 92/8552 | 154/18723 | 3.00e-04 | 1.81e-03 | 92 |
| GO:004308715 | Esophagus | ESCC | regulation of GTPase activity | 183/8552 | 348/18723 | 5.34e-03 | 2.00e-02 | 183 |
| GO:002260422 | Liver | HCC | regulation of cell morphogenesis | 188/7958 | 309/18723 | 4.84e-11 | 1.82e-09 | 188 |
| GO:000836022 | Liver | HCC | regulation of cell shape | 92/7958 | 154/18723 | 1.15e-05 | 1.31e-04 | 92 |
| GO:00226048 | Lung | IAC | regulation of cell morphogenesis | 74/2061 | 309/18723 | 6.31e-11 | 1.70e-08 | 74 |
| GO:00083607 | Lung | IAC | regulation of cell shape | 37/2061 | 154/18723 | 3.35e-06 | 1.42e-04 | 37 |
| GO:00430876 | Lung | IAC | regulation of GTPase activity | 67/2061 | 348/18723 | 3.43e-06 | 1.44e-04 | 67 |
| GO:0046847 | Lung | IAC | filopodium assembly | 14/2061 | 62/18723 | 6.56e-03 | 4.60e-02 | 14 |
| GO:002260413 | Lung | AIS | regulation of cell morphogenesis | 65/1849 | 309/18723 | 2.97e-09 | 5.09e-07 | 65 |
| GO:004308711 | Lung | AIS | regulation of GTPase activity | 65/1849 | 348/18723 | 3.35e-07 | 2.83e-05 | 65 |
| GO:000836013 | Lung | AIS | regulation of cell shape | 32/1849 | 154/18723 | 3.75e-05 | 1.14e-03 | 32 |
| GO:00468471 | Lung | AIS | filopodium assembly | 14/1849 | 62/18723 | 2.46e-03 | 2.55e-02 | 14 |
| GO:002260432 | Lung | MIAC | regulation of cell morphogenesis | 38/967 | 309/18723 | 6.47e-07 | 9.76e-05 | 38 |
| GO:004308721 | Lung | MIAC | regulation of GTPase activity | 41/967 | 348/18723 | 7.39e-07 | 1.08e-04 | 41 |
| GO:000836032 | Lung | MIAC | regulation of cell shape | 20/967 | 154/18723 | 1.34e-04 | 5.35e-03 | 20 |
| GO:002260419 | Oral cavity | OSCC | regulation of cell morphogenesis | 163/7305 | 309/18723 | 5.66e-07 | 8.19e-06 | 163 |
| Hugo Symbol | Variant Class | Variant Classification | dbSNP RS | HGVSc | HGVSp | HGVSp Short | SWISSPROT | BIOTYPE | SIFT | PolyPhen | Tumor Sample Barcode | Tissue | Histology | Sex | Age | Stage | Therapy Types | Drugs | Outcome |
| FGD6 | SNV | Missense_Mutation | | c.341C>G | p.Ser114Cys | p.S114C | Q6ZV73 | protein_coding | tolerated_low_confidence(0.13) | possibly_damaging(0.533) | TCGA-AC-A23C-01 | Breast | breast invasive carcinoma | Female | <65 | I/II | Chemotherapy | chemo | CR |
| FGD6 | SNV | Missense_Mutation | | c.2860N>A | p.Asp954Asn | p.D954N | Q6ZV73 | protein_coding | deleterious(0.01) | probably_damaging(0.999) | TCGA-AC-A23H-01 | Breast | breast invasive carcinoma | Female | >=65 | I/II | Unknown | Unknown | PD |
| FGD6 | SNV | Missense_Mutation | | c.943N>G | p.Pro315Ala | p.P315A | Q6ZV73 | protein_coding | deleterious_low_confidence(0) | probably_damaging(0.996) | TCGA-AC-A23H-01 | Breast | breast invasive carcinoma | Female | >=65 | I/II | Unknown | Unknown | PD |
| FGD6 | SNV | Missense_Mutation | rs377183623 | c.3530C>T | p.Ala1177Val | p.A1177V | Q6ZV73 | protein_coding | deleterious(0) | probably_damaging(1) | TCGA-AO-A128-01 | Breast | breast invasive carcinoma | Female | <65 | I/II | Chemotherapy | doxorubicin | SD |
| FGD6 | SNV | Missense_Mutation | | c.3302N>A | p.Arg1101Gln | p.R1101Q | Q6ZV73 | protein_coding | deleterious(0.02) | probably_damaging(1) | TCGA-AR-A24H-01 | Breast | breast invasive carcinoma | Female | >=65 | I/II | Hormone Therapy | tamoxiphen | SD |
| FGD6 | SNV | Missense_Mutation | rs757525900 | c.2237C>T | p.Pro746Leu | p.P746L | Q6ZV73 | protein_coding | deleterious(0.01) | probably_damaging(0.963) | TCGA-B6-A409-01 | Breast | breast invasive carcinoma | Female | <65 | III/IV | Chemotherapy | cyclophosphamide | PD |
| FGD6 | SNV | Missense_Mutation | | c.4124N>G | p.Glu1375Gly | p.E1375G | Q6ZV73 | protein_coding | deleterious(0) | probably_damaging(1) | TCGA-BH-A1FU-01 | Breast | breast invasive carcinoma | Female | <65 | I/II | Unknown | Unknown | PD |
| FGD6 | SNV | Missense_Mutation | | c.1370N>T | p.Lys457Met | p.K457M | Q6ZV73 | protein_coding | deleterious_low_confidence(0) | probably_damaging(0.921) | TCGA-C8-A12K-01 | Breast | breast invasive carcinoma | Female | >=65 | I/II | Unknown | Unknown | SD |
| FGD6 | SNV | Missense_Mutation | | c.2613N>C | p.Lys871Asn | p.K871N | Q6ZV73 | protein_coding | deleterious(0) | probably_damaging(0.998) | TCGA-D8-A147-01 | Breast | breast invasive carcinoma | Female | <65 | I/II | Chemotherapy | doxorubicine | SD |
| FGD6 | SNV | Missense_Mutation | | c.4249N>A | p.Ala1417Thr | p.A1417T | Q6ZV73 | protein_coding | tolerated(0.07) | benign(0.146) | TCGA-D8-A1XK-01 | Breast | breast invasive carcinoma | Female | <65 | I/II | Chemotherapy | doxorubicine+cyclophosphamide | SD |


