
|
|||||
|
 | |
| |
| |
| |
| |
| |
|
Gene: FGD4 |
Gene summary for FGD4 |
| Gene information | Species | Human | Gene symbol | FGD4 | Gene ID | 121512 |
| Gene name | FYVE, RhoGEF and PH domain containing 4 | |
| Gene Alias | CMT4H | |
| Cytomap | 12p11.21 | |
| Gene Type | protein-coding | GO ID | GO:0000902 | UniProtAcc | B7Z8F9 |
Top |
Malignant transformation analysis |
| Identification of the aberrant gene expression in precancerous and cancerous lesions by comparing the gene expression of stem-like cells in diseased tissues with normal stem cells |
| Entrez ID | Symbol | Replicates | Species | Organ | Tissue | Adj P-value | Log2FC | Malignancy |
| 121512 | FGD4 | CCI_1 | Human | Cervix | CC | 9.81e-11 | 9.66e-01 | 0.528 |
| 121512 | FGD4 | CCI_2 | Human | Cervix | CC | 3.52e-05 | 9.53e-01 | 0.5249 |
| 121512 | FGD4 | CCI_3 | Human | Cervix | CC | 1.24e-43 | 2.07e+00 | 0.516 |
| 121512 | FGD4 | HTA11_3410_2000001011 | Human | Colorectum | AD | 1.68e-38 | -7.49e-01 | 0.0155 |
| 121512 | FGD4 | HTA11_2951_2000001011 | Human | Colorectum | AD | 2.01e-10 | -7.15e-01 | 0.0216 |
| 121512 | FGD4 | HTA11_347_2000001011 | Human | Colorectum | AD | 2.02e-28 | 1.02e+00 | -0.1954 |
| 121512 | FGD4 | HTA11_411_2000001011 | Human | Colorectum | SER | 5.99e-08 | 6.25e-01 | -0.2602 |
| 121512 | FGD4 | HTA11_2112_2000001011 | Human | Colorectum | SER | 1.42e-04 | 6.49e-01 | -0.2196 |
| 121512 | FGD4 | HTA11_696_2000001011 | Human | Colorectum | AD | 3.95e-07 | 5.05e-01 | -0.1464 |
| 121512 | FGD4 | HTA11_866_2000001011 | Human | Colorectum | AD | 7.81e-03 | 4.00e-01 | -0.1001 |
| 121512 | FGD4 | HTA11_9341_2000001011 | Human | Colorectum | SER | 1.95e-02 | -2.39e-01 | -0.00410000000000005 |
| 121512 | FGD4 | HTA11_866_3004761011 | Human | Colorectum | AD | 2.91e-32 | -8.73e-01 | 0.096 |
| 121512 | FGD4 | HTA11_9408_2000001011 | Human | Colorectum | AD | 1.10e-04 | -5.92e-01 | 0.0451 |
| 121512 | FGD4 | HTA11_7696_3000711011 | Human | Colorectum | AD | 1.69e-06 | -3.82e-01 | 0.0674 |
| 121512 | FGD4 | HTA11_11156_2000001011 | Human | Colorectum | AD | 8.58e-08 | -7.00e-01 | 0.0397 |
| 121512 | FGD4 | HTA11_6818_2000001021 | Human | Colorectum | AD | 9.11e-04 | -5.16e-01 | 0.0588 |
| 121512 | FGD4 | HTA11_99999970781_79442 | Human | Colorectum | MSS | 7.92e-34 | -7.32e-01 | 0.294 |
| 121512 | FGD4 | HTA11_99999965062_69753 | Human | Colorectum | MSI-H | 7.79e-09 | 5.67e-01 | 0.3487 |
| 121512 | FGD4 | HTA11_99999971662_82457 | Human | Colorectum | MSS | 1.26e-14 | -5.43e-01 | 0.3859 |
| 121512 | FGD4 | HTA11_99999973899_84307 | Human | Colorectum | MSS | 3.52e-29 | -1.11e+00 | 0.2585 |
| Page: 1 2 3 4 5 6 7 8 9 |
| Tissue | Expression Dynamics | Abbreviation |
| Cervix | 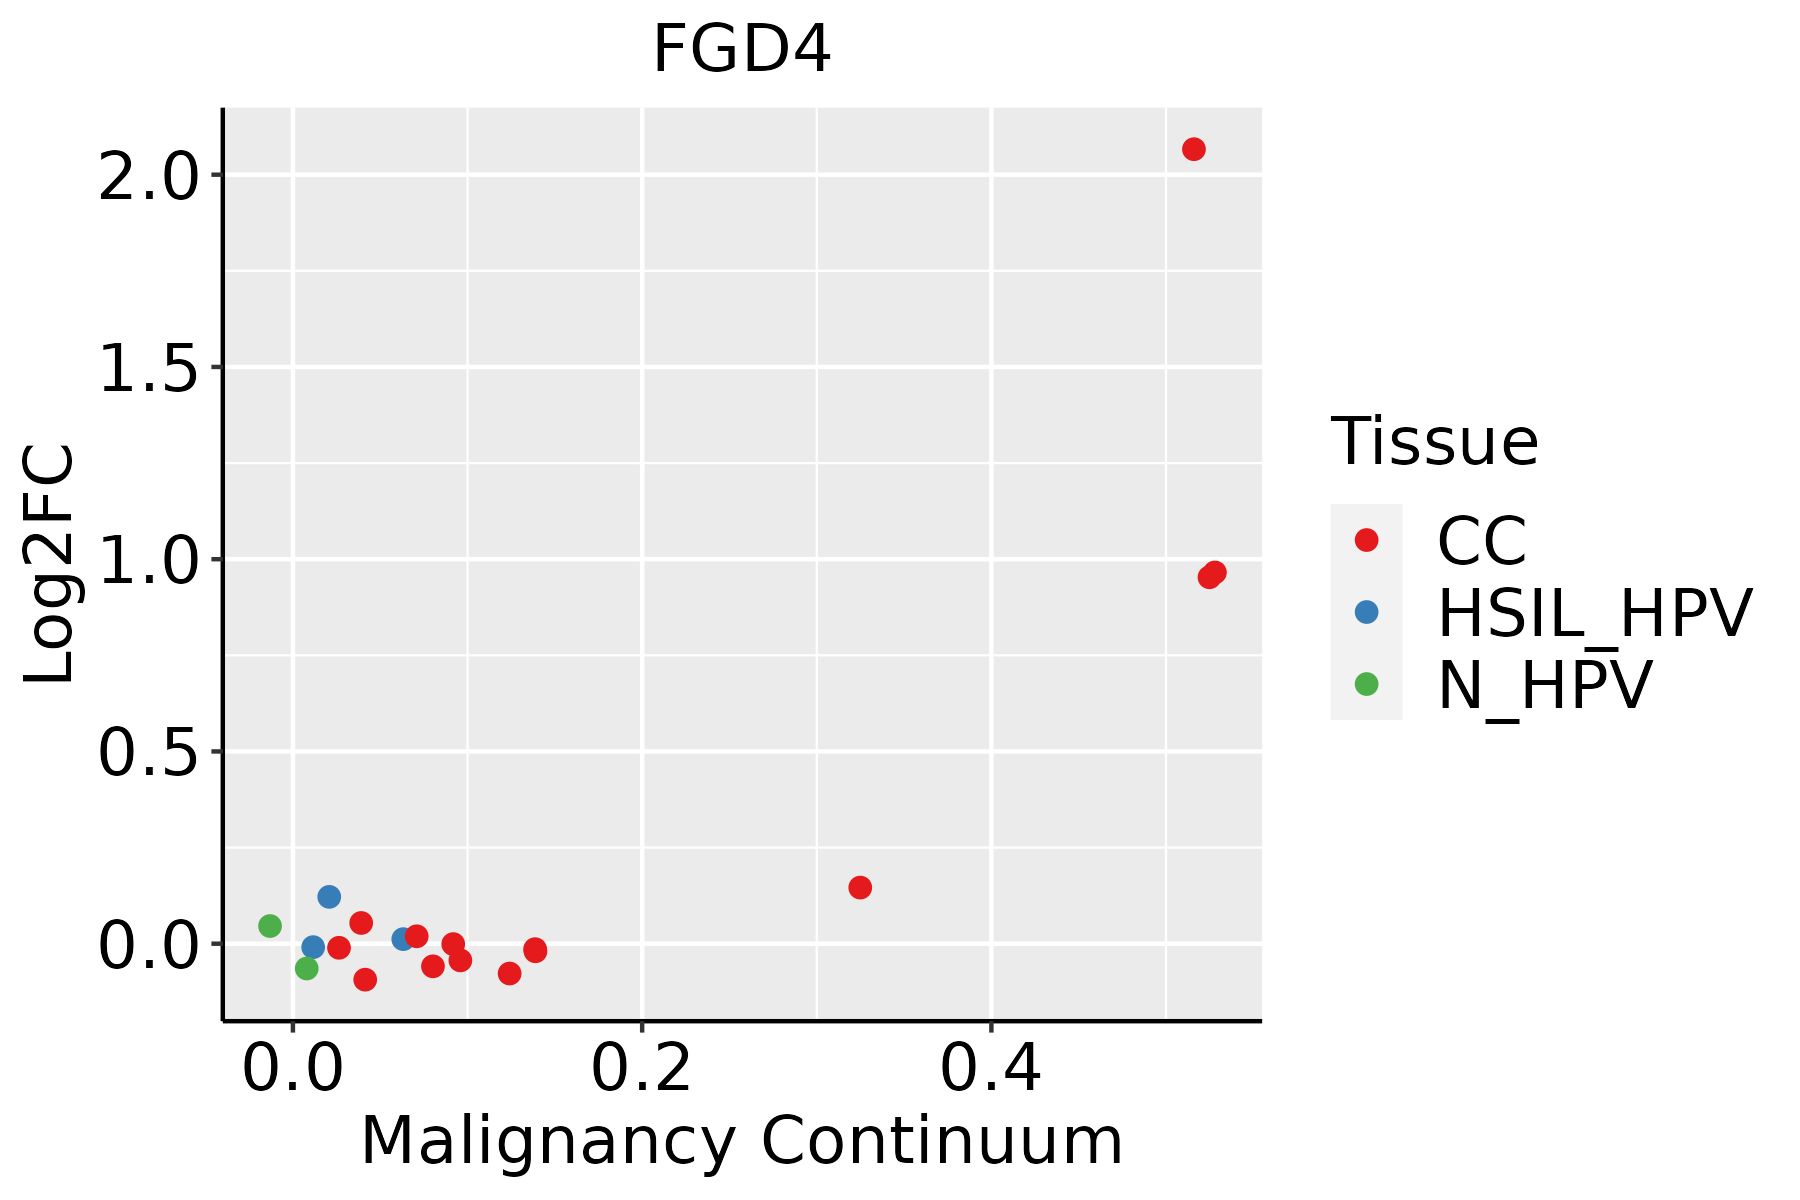 | CC: Cervix cancer |
| HSIL_HPV: HPV-infected high-grade squamous intraepithelial lesions | ||
| N_HPV: HPV-infected normal cervix | ||
| Colorectum (GSE201348) |  | FAP: Familial adenomatous polyposis |
| CRC: Colorectal cancer | ||
| Colorectum (HTA11) |  | AD: Adenomas |
| SER: Sessile serrated lesions | ||
| MSI-H: Microsatellite-high colorectal cancer | ||
| MSS: Microsatellite stable colorectal cancer | ||
| Endometrium | 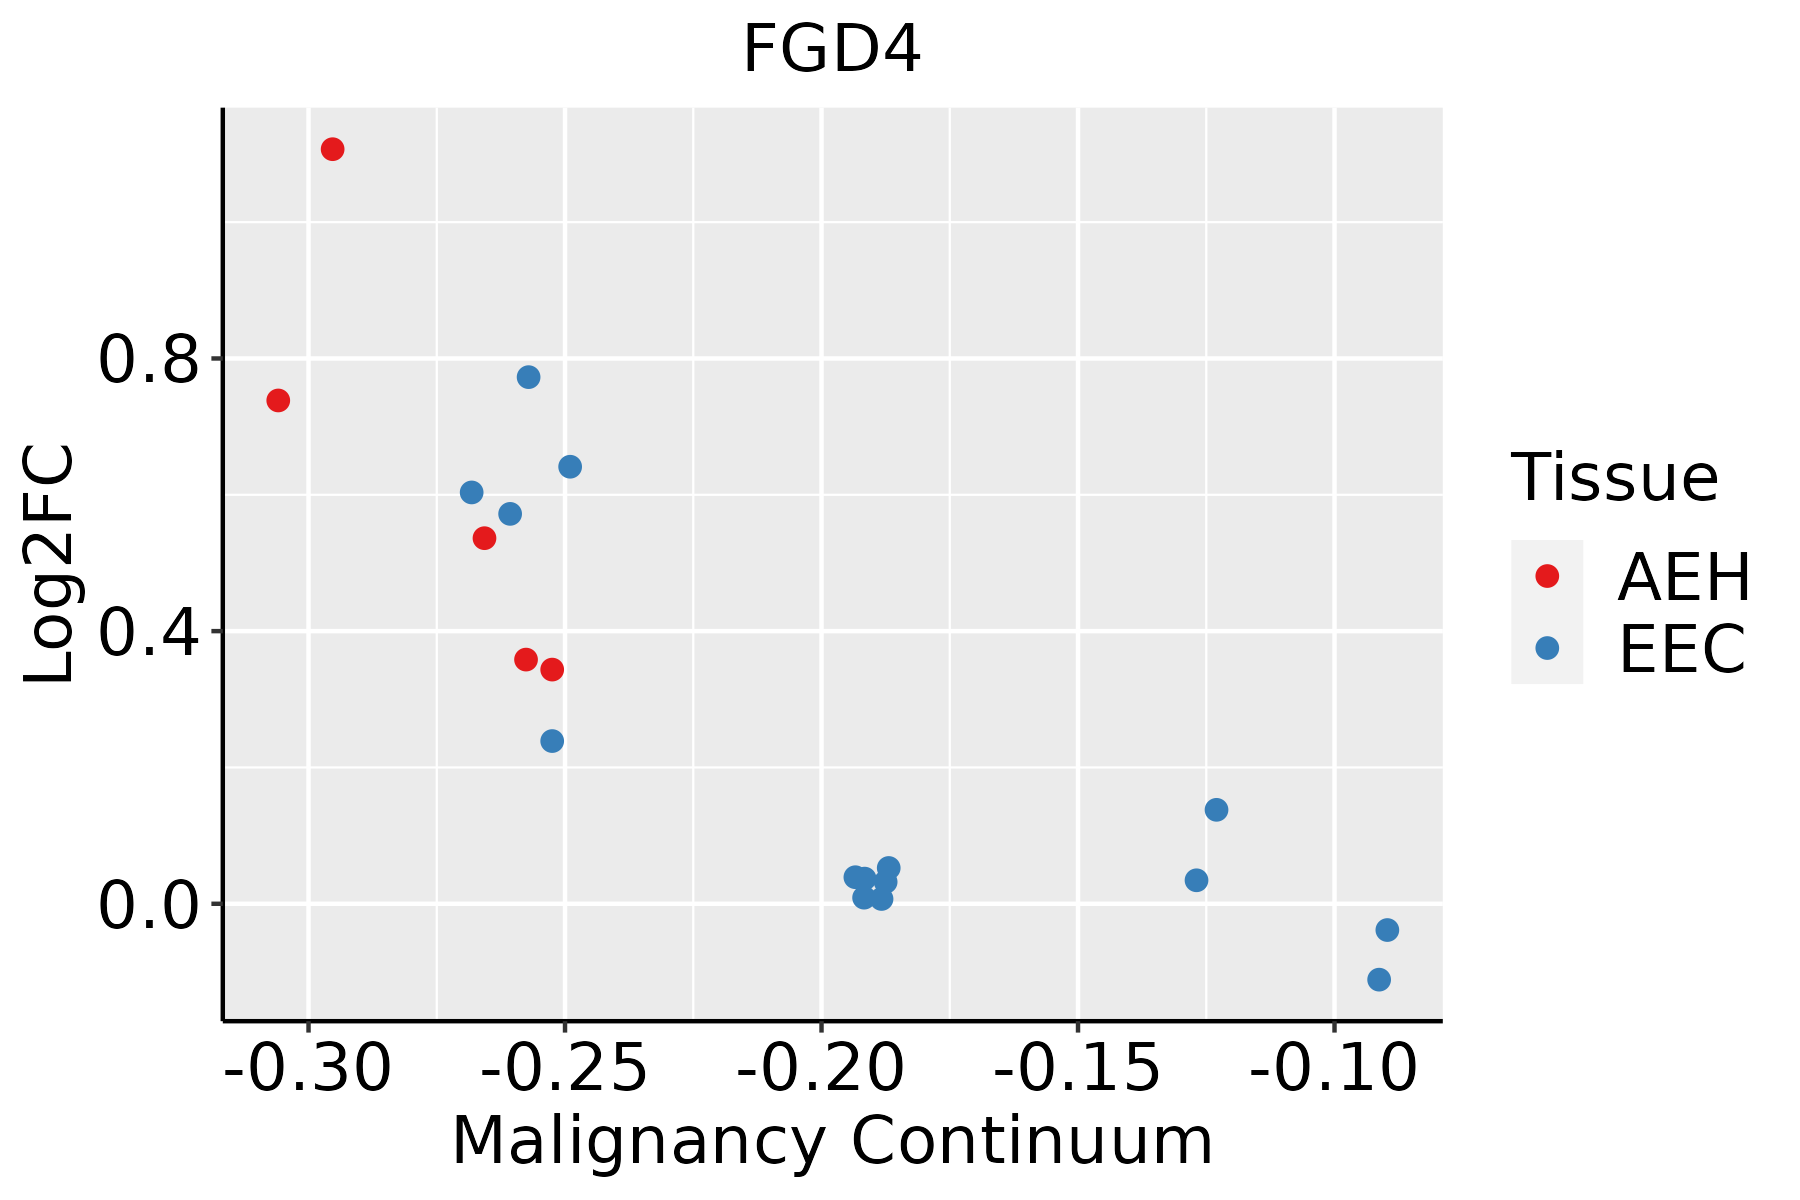 | AEH: Atypical endometrial hyperplasia |
| EEC: Endometrioid Cancer | ||
| Esophagus |  | ESCC: Esophageal squamous cell carcinoma |
| HGIN: High-grade intraepithelial neoplasias | ||
| LGIN: Low-grade intraepithelial neoplasias | ||
| GC |  | CAG: Chronic atrophic gastritis |
| CAG with IM: Chronic atrophic gastritis with intestinal metaplasia | ||
| CSG: Chronic superficial gastritis | ||
| GC: Gastric cancer | ||
| SIM: Severe intestinal metaplasia | ||
| WIM: Wild intestinal metaplasia | ||
| Liver |  | HCC: Hepatocellular carcinoma |
| NAFLD: Non-alcoholic fatty liver disease | ||
| Lung |  | AAH: Atypical adenomatous hyperplasia |
| AIS: Adenocarcinoma in situ | ||
| IAC: Invasive lung adenocarcinoma | ||
| MIA: Minimally invasive adenocarcinoma | ||
| Thyroid | 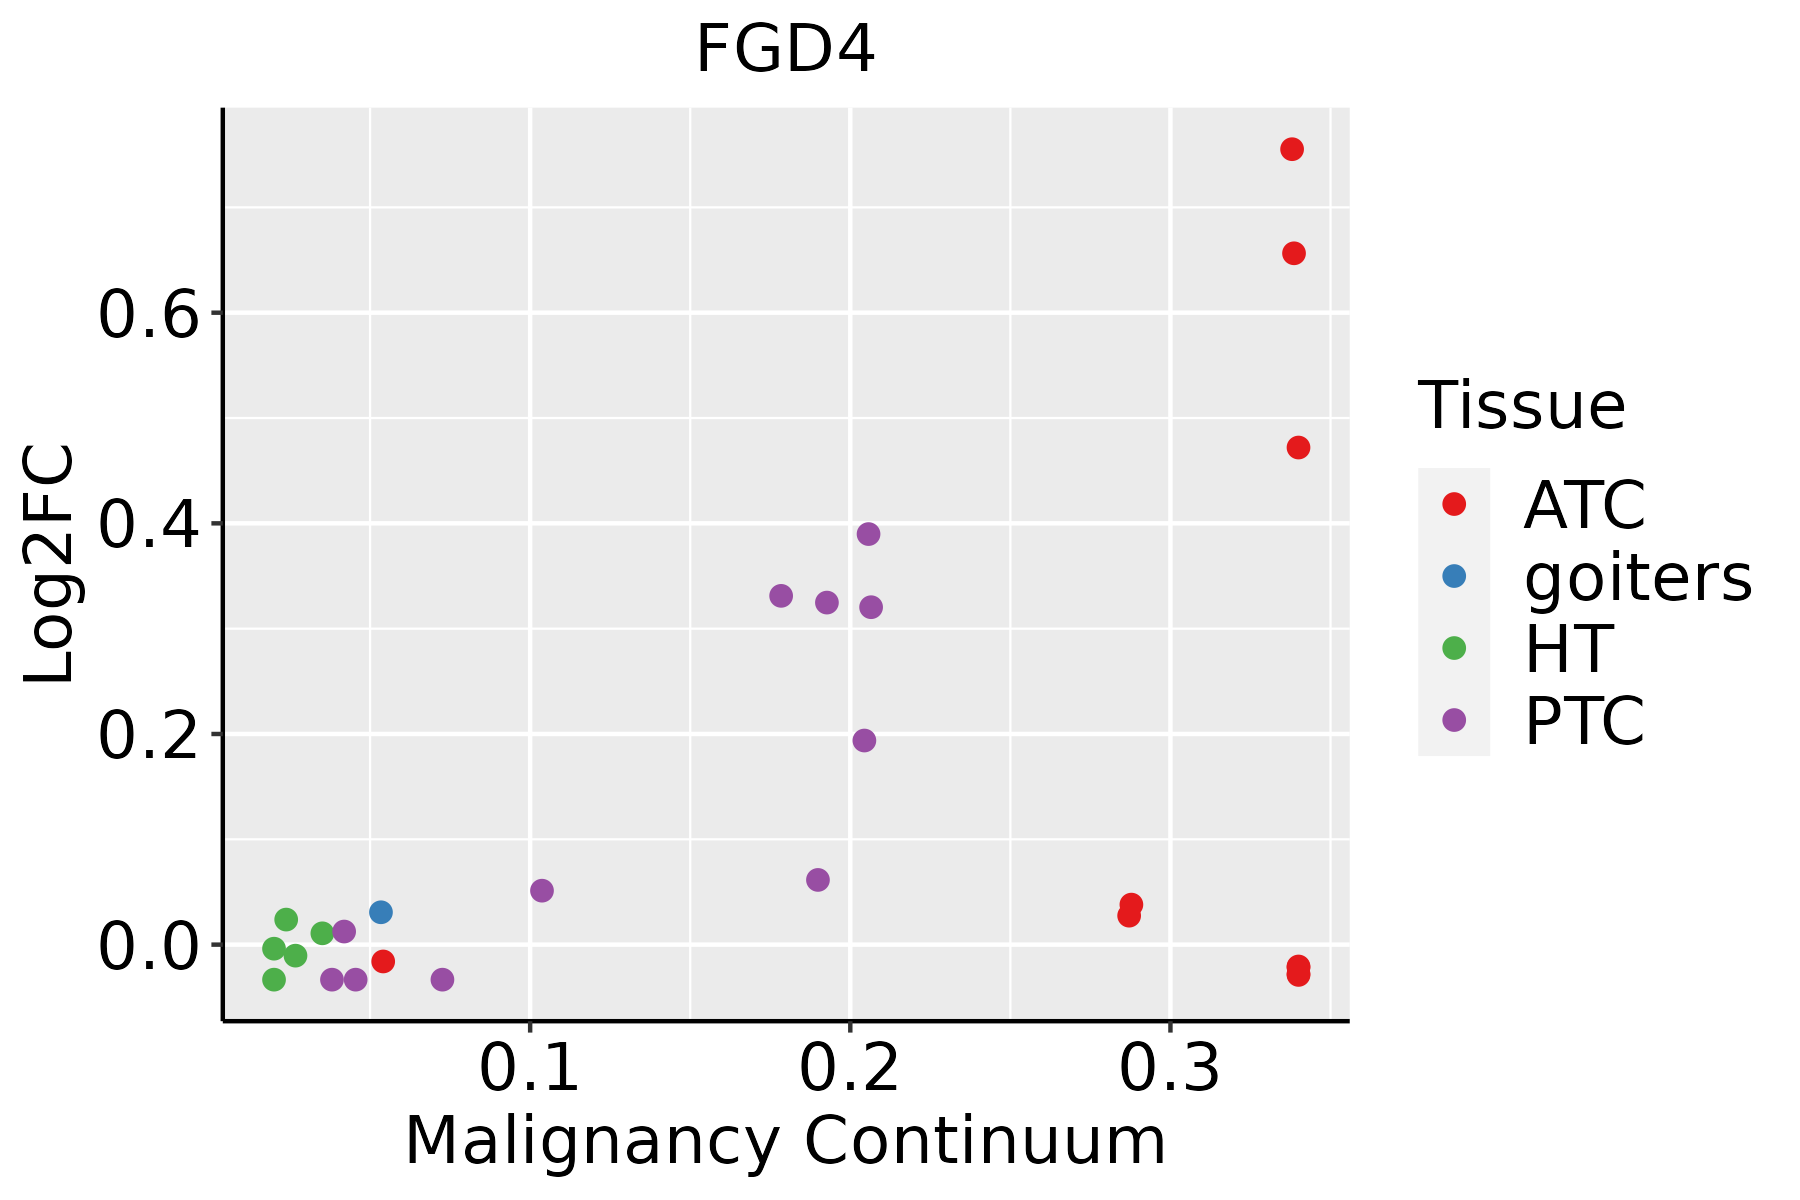 | ATC: Anaplastic thyroid cancer |
| HT: Hashimoto's thyroiditis | ||
| PTC: Papillary thyroid cancer |
| ∗log2FC in expression of this searched gene in stem-like cells from each diseased tissue sample relative to stem-like cells in normal samples in each tissue plotted against the malignancy continuum. Samples are colored based on if they are from different disease stage. |
Top |
Malignant transformation related pathway analysis |
| Find out the enriched GO biological processes and KEGG pathways involved in transition from healthy to precancer to cancer |
| Tissue | Disease Stage | Enriched GO biological Processes |
| Colorectum | AD |  |
| Colorectum | SER |  |
| Colorectum | MSS |  |
| Colorectum | MSI-H |  |
| Colorectum | FAP |  |
| ∗Top 15 enriched GO BP terms are showed in the bar plot of each disease state in each tissue. Each row represents a significant GO biological process which is colored according to the -log10(p.adjust). |
| Page: 1 2 3 4 5 6 7 8 9 |
| GO ID | Tissue | Disease Stage | Description | Gene Ratio | Bg Ratio | pvalue | p.adjust | Count |
| GO:002260410 | Cervix | CC | regulation of cell morphogenesis | 84/2311 | 309/18723 | 1.00e-12 | 4.29e-10 | 84 |
| GO:00510566 | Cervix | CC | regulation of small GTPase mediated signal transduction | 75/2311 | 302/18723 | 1.54e-09 | 1.74e-07 | 75 |
| GO:00430877 | Cervix | CC | regulation of GTPase activity | 79/2311 | 348/18723 | 4.21e-08 | 2.60e-06 | 79 |
| GO:00083608 | Cervix | CC | regulation of cell shape | 38/2311 | 154/18723 | 1.86e-05 | 3.46e-04 | 38 |
| GO:0022604 | Colorectum | AD | regulation of cell morphogenesis | 109/3918 | 309/18723 | 3.08e-09 | 2.07e-07 | 109 |
| GO:0043087 | Colorectum | AD | regulation of GTPase activity | 110/3918 | 348/18723 | 1.64e-06 | 5.03e-05 | 110 |
| GO:0008360 | Colorectum | AD | regulation of cell shape | 56/3918 | 154/18723 | 7.01e-06 | 1.73e-04 | 56 |
| GO:0051056 | Colorectum | AD | regulation of small GTPase mediated signal transduction | 94/3918 | 302/18723 | 1.81e-05 | 3.76e-04 | 94 |
| GO:00226041 | Colorectum | SER | regulation of cell morphogenesis | 89/2897 | 309/18723 | 1.51e-09 | 1.52e-07 | 89 |
| GO:00083601 | Colorectum | SER | regulation of cell shape | 43/2897 | 154/18723 | 5.47e-05 | 1.30e-03 | 43 |
| GO:00430871 | Colorectum | SER | regulation of GTPase activity | 77/2897 | 348/18723 | 5.90e-04 | 8.07e-03 | 77 |
| GO:00226042 | Colorectum | MSS | regulation of cell morphogenesis | 103/3467 | 309/18723 | 2.70e-10 | 2.56e-08 | 103 |
| GO:00430872 | Colorectum | MSS | regulation of GTPase activity | 101/3467 | 348/18723 | 1.00e-06 | 3.46e-05 | 101 |
| GO:00083602 | Colorectum | MSS | regulation of cell shape | 52/3467 | 154/18723 | 4.40e-06 | 1.24e-04 | 52 |
| GO:00510561 | Colorectum | MSS | regulation of small GTPase mediated signal transduction | 82/3467 | 302/18723 | 1.31e-04 | 1.99e-03 | 82 |
| GO:00226043 | Colorectum | MSI-H | regulation of cell morphogenesis | 45/1319 | 309/18723 | 2.70e-06 | 1.54e-04 | 45 |
| GO:00226044 | Colorectum | FAP | regulation of cell morphogenesis | 87/2622 | 309/18723 | 4.89e-11 | 1.87e-08 | 87 |
| GO:00510562 | Colorectum | FAP | regulation of small GTPase mediated signal transduction | 78/2622 | 302/18723 | 3.25e-08 | 2.85e-06 | 78 |
| GO:00430873 | Colorectum | FAP | regulation of GTPase activity | 85/2622 | 348/18723 | 1.20e-07 | 7.68e-06 | 85 |
| GO:00083603 | Colorectum | FAP | regulation of cell shape | 43/2622 | 154/18723 | 4.55e-06 | 1.52e-04 | 43 |
| Page: 1 2 3 4 |
| Pathway ID | Tissue | Disease Stage | Description | Gene Ratio | Bg Ratio | pvalue | p.adjust | qvalue | Count |
| Page: 1 |
Top |
Cell-cell communication analysis |
| Identification of potential cell-cell interactions between two cell types and their ligand-receptor pairs for different disease states |
| Ligand | Receptor | LRpair | Pathway | Tissue | Disease Stage |
| Page: 1 |
Top |
Single-cell gene regulatory network inference analysis |
| Find out the significant the regulons (TFs) and the target genes of each regulon across cell types for different disease states |
| TF | Cell Type | Tissue | Disease Stage | Target Gene | RSS | Regulon Activity |
| ∗The dot plots of a searched regulon are shown for all cell subpopulations in each disease state of each tissue based on the regulon specific score inferred using pySCENIC and by calculating the average expression. |
| Page: 1 |
Top |
Somatic mutation of malignant transformation related genes |
| Annotation of somatic variants for genes involved in malignant transformation |
| Hugo Symbol | Variant Class | Variant Classification | dbSNP RS | HGVSc | HGVSp | HGVSp Short | SWISSPROT | BIOTYPE | SIFT | PolyPhen | Tumor Sample Barcode | Tissue | Histology | Sex | Age | Stage | Therapy Types | Drugs | Outcome |
| FGD4 | SNV | Missense_Mutation | novel | c.946N>A | p.Glu316Lys | p.E316K | protein_coding | tolerated(0.05) | benign(0.082) | TCGA-A2-A0CX-01 | Breast | breast invasive carcinoma | Female | <65 | I/II | Chemotherapy | adriamycin | SD | |
| FGD4 | SNV | Missense_Mutation | novel | c.1366C>T | p.His456Tyr | p.H456Y | protein_coding | deleterious(0) | probably_damaging(0.993) | TCGA-AC-A3W5-01 | Breast | breast invasive carcinoma | Female | >=65 | I/II | Chemotherapy | docetaxel | CR | |
| FGD4 | SNV | Missense_Mutation | novel | c.778G>C | p.Asp260His | p.D260H | protein_coding | deleterious(0.04) | benign(0.001) | TCGA-AN-A0XW-01 | Breast | breast invasive carcinoma | Female | <65 | III/IV | Unknown | Unknown | SD | |
| FGD4 | SNV | Missense_Mutation | c.2389N>A | p.Ala797Thr | p.A797T | protein_coding | deleterious(0.01) | possibly_damaging(0.897) | TCGA-BH-A1F8-01 | Breast | breast invasive carcinoma | Female | >=65 | III/IV | Unknown | Unknown | PD | ||
| FGD4 | SNV | Missense_Mutation | c.755N>T | p.Ala252Val | p.A252V | protein_coding | tolerated(0.13) | benign(0.003) | TCGA-DS-A0VM-01 | Cervix | cervical & endocervical cancer | Female | <65 | I/II | Chemotherapy | cisplatin | PD | ||
| FGD4 | SNV | Missense_Mutation | novel | c.1366N>T | p.His456Tyr | p.H456Y | protein_coding | deleterious(0) | probably_damaging(0.993) | TCGA-HM-A4S6-01 | Cervix | cervical & endocervical cancer | Female | <65 | III/IV | Chemotherapy | cisplatin | CR | |
| FGD4 | SNV | Missense_Mutation | c.2372N>T | p.Ala791Val | p.A791V | protein_coding | deleterious(0.02) | possibly_damaging(0.824) | TCGA-AA-3984-01 | Colorectum | colon adenocarcinoma | Female | <65 | I/II | Unknown | Unknown | SD | ||
| FGD4 | SNV | Missense_Mutation | novel | c.506N>C | p.Gly169Ala | p.G169A | protein_coding | tolerated_low_confidence(0.07) | benign(0.437) | TCGA-AM-5820-01 | Colorectum | colon adenocarcinoma | Female | <65 | I/II | Unknown | Unknown | SD | |
| FGD4 | SNV | Missense_Mutation | c.973N>A | p.Glu325Lys | p.E325K | protein_coding | deleterious(0) | probably_damaging(1) | TCGA-D5-6533-01 | Colorectum | colon adenocarcinoma | Female | >=65 | I/II | Chemotherapy | oxaliplatin | CR | ||
| FGD4 | SNV | Missense_Mutation | rs886049255 | c.2150N>A | p.Gly717Asp | p.G717D | protein_coding | tolerated(0.06) | benign(0.292) | TCGA-F4-6570-01 | Colorectum | colon adenocarcinoma | Female | >=65 | I/II | Unknown | Unknown | SD |
| Page: 1 2 3 4 5 6 7 |
Top |
Related drugs of malignant transformation related genes |
| Identification of chemicals and drugs interact with genes involved in malignant transfromation |
| (DGIdb 4.0) |
| Entrez ID | Symbol | Category | Interaction Types | Drug Claim Name | Drug Name | PMIDs |
| 121512 | FGD4 | NA | paclitaxel | PACLITAXEL | 22843789 |
| Page: 1 |

Copyright 2023-Present -The University of Texas Health Science Center at Houston |