
|
|||||
|
 | |
| |
| |
| |
| |
| |
|
Gene: FGD2 |
Gene summary for FGD2 |
| Gene information | Species | Human | Gene symbol | FGD2 | Gene ID | 221472 |
| Gene name | FYVE, RhoGEF and PH domain containing 2 | |
| Gene Alias | ZFYVE4 | |
| Cytomap | 6p21.2 | |
| Gene Type | protein-coding | GO ID | GO:0000165 | UniProtAcc | Q7Z6J4 |
Top |
Malignant transformation analysis |
| Identification of the aberrant gene expression in precancerous and cancerous lesions by comparing the gene expression of stem-like cells in diseased tissues with normal stem cells |
| Entrez ID | Symbol | Replicates | Species | Organ | Tissue | Adj P-value | Log2FC | Malignancy |
| 221472 | FGD2 | HTA11_3410_2000001011 | Human | Colorectum | AD | 1.02e-149 | 2.65e+00 | 0.0155 |
| 221472 | FGD2 | HTA11_2487_2000001011 | Human | Colorectum | SER | 3.05e-72 | 2.21e+00 | -0.1808 |
| 221472 | FGD2 | HTA11_2951_2000001011 | Human | Colorectum | AD | 1.02e-44 | 2.59e+00 | 0.0216 |
| 221472 | FGD2 | HTA11_1938_2000001011 | Human | Colorectum | AD | 1.10e-80 | 2.73e+00 | -0.0811 |
| 221472 | FGD2 | HTA11_78_2000001011 | Human | Colorectum | AD | 2.61e-59 | 1.66e+00 | -0.1088 |
| 221472 | FGD2 | HTA11_347_2000001011 | Human | Colorectum | AD | 1.32e-164 | 4.08e+00 | -0.1954 |
| 221472 | FGD2 | HTA11_411_2000001011 | Human | Colorectum | SER | 8.14e-41 | 3.30e+00 | -0.2602 |
| 221472 | FGD2 | HTA11_2112_2000001011 | Human | Colorectum | SER | 7.77e-16 | 2.01e+00 | -0.2196 |
| 221472 | FGD2 | HTA11_3361_2000001011 | Human | Colorectum | AD | 1.70e-81 | 2.69e+00 | -0.1207 |
| 221472 | FGD2 | HTA11_83_2000001011 | Human | Colorectum | SER | 1.22e-53 | 2.50e+00 | -0.1526 |
| 221472 | FGD2 | HTA11_696_2000001011 | Human | Colorectum | AD | 3.65e-101 | 3.33e+00 | -0.1464 |
| 221472 | FGD2 | HTA11_866_2000001011 | Human | Colorectum | AD | 3.00e-71 | 1.54e+00 | -0.1001 |
| 221472 | FGD2 | HTA11_1391_2000001011 | Human | Colorectum | AD | 1.42e-65 | 2.22e+00 | -0.059 |
| 221472 | FGD2 | HTA11_2992_2000001011 | Human | Colorectum | SER | 1.74e-58 | 3.58e+00 | -0.1706 |
| 221472 | FGD2 | HTA11_5212_2000001011 | Human | Colorectum | AD | 1.97e-63 | 3.46e+00 | -0.2061 |
| 221472 | FGD2 | HTA11_5216_2000001011 | Human | Colorectum | SER | 1.84e-51 | 3.89e+00 | -0.1462 |
| 221472 | FGD2 | HTA11_546_2000001011 | Human | Colorectum | AD | 2.42e-71 | 3.43e+00 | -0.0842 |
| 221472 | FGD2 | HTA11_7862_2000001011 | Human | Colorectum | AD | 4.79e-05 | 2.34e-01 | -0.0179 |
| 221472 | FGD2 | HTA11_866_3004761011 | Human | Colorectum | AD | 3.84e-05 | 1.77e-01 | 0.096 |
| 221472 | FGD2 | HTA11_6801_2000001011 | Human | Colorectum | SER | 9.67e-09 | 4.69e-01 | 0.0171 |
| Page: 1 2 |
| Tissue | Expression Dynamics | Abbreviation |
| Colorectum (GSE201348) | 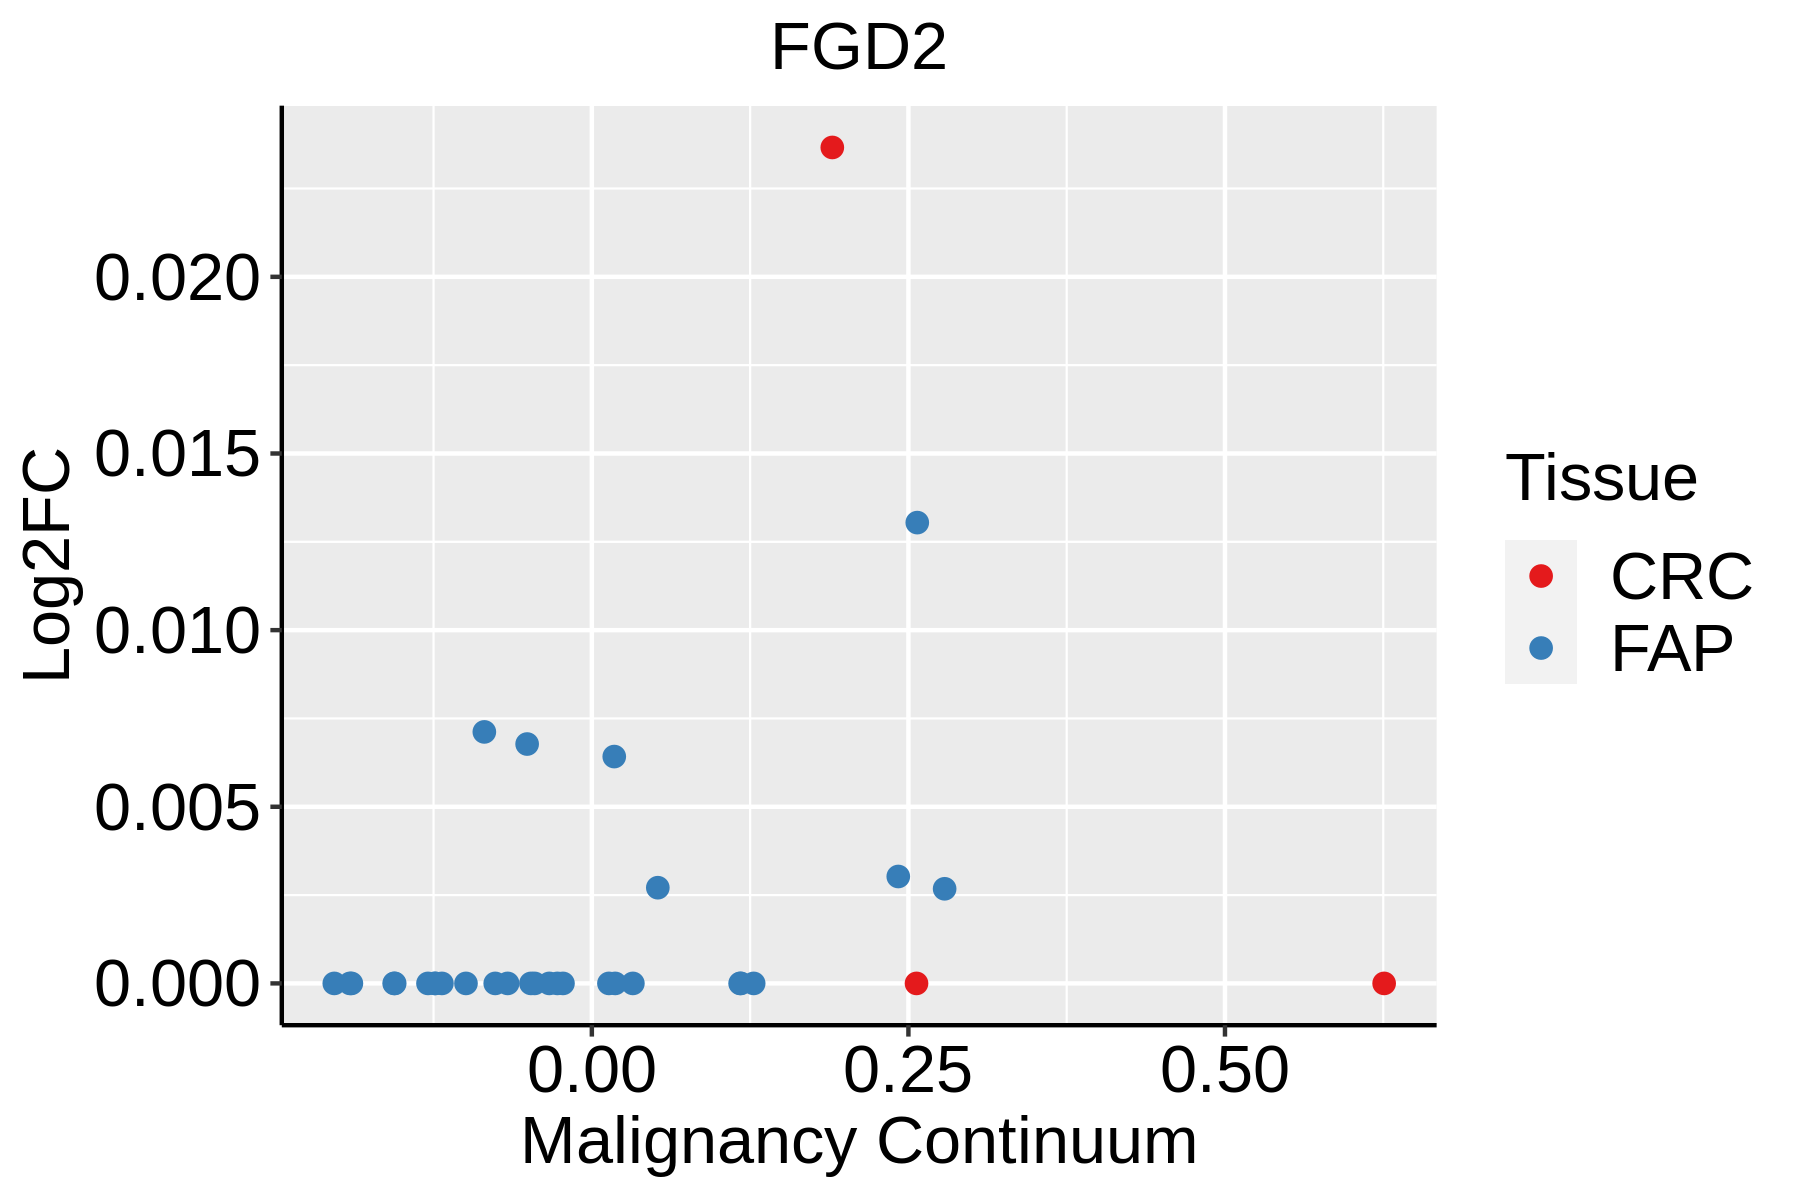 | FAP: Familial adenomatous polyposis |
| CRC: Colorectal cancer | ||
| Colorectum (HTA11) |  | AD: Adenomas |
| SER: Sessile serrated lesions | ||
| MSI-H: Microsatellite-high colorectal cancer | ||
| MSS: Microsatellite stable colorectal cancer |
| ∗log2FC in expression of this searched gene in stem-like cells from each diseased tissue sample relative to stem-like cells in normal samples in each tissue plotted against the malignancy continuum. Samples are colored based on if they are from different disease stage. |
Top |
Malignant transformation related pathway analysis |
| Find out the enriched GO biological processes and KEGG pathways involved in transition from healthy to precancer to cancer |
| Tissue | Disease Stage | Enriched GO biological Processes |
| Colorectum | AD |  |
| Colorectum | SER |  |
| Colorectum | MSS |  |
| Colorectum | MSI-H |  |
| Colorectum | FAP |  |
| ∗Top 15 enriched GO BP terms are showed in the bar plot of each disease state in each tissue. Each row represents a significant GO biological process which is colored according to the -log10(p.adjust). |
| Page: 1 2 3 4 5 6 7 8 9 |
| GO ID | Tissue | Disease Stage | Description | Gene Ratio | Bg Ratio | pvalue | p.adjust | Count |
| GO:0022604 | Colorectum | AD | regulation of cell morphogenesis | 109/3918 | 309/18723 | 3.08e-09 | 2.07e-07 | 109 |
| GO:0043087 | Colorectum | AD | regulation of GTPase activity | 110/3918 | 348/18723 | 1.64e-06 | 5.03e-05 | 110 |
| GO:0008360 | Colorectum | AD | regulation of cell shape | 56/3918 | 154/18723 | 7.01e-06 | 1.73e-04 | 56 |
| GO:0051056 | Colorectum | AD | regulation of small GTPase mediated signal transduction | 94/3918 | 302/18723 | 1.81e-05 | 3.76e-04 | 94 |
| GO:0033674 | Colorectum | AD | positive regulation of kinase activity | 131/3918 | 467/18723 | 1.28e-04 | 1.85e-03 | 131 |
| GO:0045860 | Colorectum | AD | positive regulation of protein kinase activity | 107/3918 | 386/18723 | 8.01e-04 | 7.92e-03 | 107 |
| GO:0071900 | Colorectum | AD | regulation of protein serine/threonine kinase activity | 98/3918 | 359/18723 | 2.18e-03 | 1.73e-02 | 98 |
| GO:0071902 | Colorectum | AD | positive regulation of protein serine/threonine kinase activity | 58/3918 | 200/18723 | 4.09e-03 | 2.84e-02 | 58 |
| GO:00226041 | Colorectum | SER | regulation of cell morphogenesis | 89/2897 | 309/18723 | 1.51e-09 | 1.52e-07 | 89 |
| GO:00083601 | Colorectum | SER | regulation of cell shape | 43/2897 | 154/18723 | 5.47e-05 | 1.30e-03 | 43 |
| GO:00430871 | Colorectum | SER | regulation of GTPase activity | 77/2897 | 348/18723 | 5.90e-04 | 8.07e-03 | 77 |
| GO:00336741 | Colorectum | SER | positive regulation of kinase activity | 95/2897 | 467/18723 | 2.62e-03 | 2.41e-02 | 95 |
| GO:00458601 | Colorectum | SER | positive regulation of protein kinase activity | 79/2897 | 386/18723 | 4.85e-03 | 3.79e-02 | 79 |
| GO:00719001 | Colorectum | SER | regulation of protein serine/threonine kinase activity | 74/2897 | 359/18723 | 5.22e-03 | 3.96e-02 | 74 |
| GO:00226042 | Colorectum | MSS | regulation of cell morphogenesis | 103/3467 | 309/18723 | 2.70e-10 | 2.56e-08 | 103 |
| GO:00430872 | Colorectum | MSS | regulation of GTPase activity | 101/3467 | 348/18723 | 1.00e-06 | 3.46e-05 | 101 |
| GO:00083602 | Colorectum | MSS | regulation of cell shape | 52/3467 | 154/18723 | 4.40e-06 | 1.24e-04 | 52 |
| GO:00336742 | Colorectum | MSS | positive regulation of kinase activity | 122/3467 | 467/18723 | 2.50e-05 | 5.21e-04 | 122 |
| GO:00458602 | Colorectum | MSS | positive regulation of protein kinase activity | 102/3467 | 386/18723 | 6.93e-05 | 1.20e-03 | 102 |
| GO:00510561 | Colorectum | MSS | regulation of small GTPase mediated signal transduction | 82/3467 | 302/18723 | 1.31e-04 | 1.99e-03 | 82 |
| Page: 1 2 |
| Pathway ID | Tissue | Disease Stage | Description | Gene Ratio | Bg Ratio | pvalue | p.adjust | qvalue | Count |
| Page: 1 |
Top |
Cell-cell communication analysis |
| Identification of potential cell-cell interactions between two cell types and their ligand-receptor pairs for different disease states |
| Ligand | Receptor | LRpair | Pathway | Tissue | Disease Stage |
| Page: 1 |
Top |
Single-cell gene regulatory network inference analysis |
| Find out the significant the regulons (TFs) and the target genes of each regulon across cell types for different disease states |
| TF | Cell Type | Tissue | Disease Stage | Target Gene | RSS | Regulon Activity |
| ∗The dot plots of a searched regulon are shown for all cell subpopulations in each disease state of each tissue based on the regulon specific score inferred using pySCENIC and by calculating the average expression. |
| Page: 1 |
Top |
Somatic mutation of malignant transformation related genes |
| Annotation of somatic variants for genes involved in malignant transformation |
| Hugo Symbol | Variant Class | Variant Classification | dbSNP RS | HGVSc | HGVSp | HGVSp Short | SWISSPROT | BIOTYPE | SIFT | PolyPhen | Tumor Sample Barcode | Tissue | Histology | Sex | Age | Stage | Therapy Types | Drugs | Outcome |
| FGD2 | SNV | Missense_Mutation | novel | c.1478C>T | p.Ser493Phe | p.S493F | Q7Z6J4 | protein_coding | deleterious(0) | probably_damaging(0.999) | TCGA-3C-AALI-01 | Breast | breast invasive carcinoma | Female | <65 | I/II | Unspecific | Poly E | Complete Response |
| FGD2 | SNV | Missense_Mutation | novel | c.10N>T | p.Ala4Ser | p.A4S | Q7Z6J4 | protein_coding | tolerated_low_confidence(0.19) | benign(0.011) | TCGA-A2-A25A-01 | Breast | breast invasive carcinoma | Female | <65 | I/II | Unspecific | Cytoxan | SD |
| FGD2 | SNV | Missense_Mutation | rs149007517 | c.1822C>T | p.Arg608Trp | p.R608W | Q7Z6J4 | protein_coding | deleterious(0.02) | probably_damaging(0.928) | TCGA-AC-A23H-01 | Breast | breast invasive carcinoma | Female | >=65 | I/II | Unknown | Unknown | PD |
| FGD2 | SNV | Missense_Mutation | rs779622760 | c.1105G>A | p.Asp369Asn | p.D369N | Q7Z6J4 | protein_coding | deleterious(0.04) | probably_damaging(0.926) | TCGA-AN-A046-01 | Breast | breast invasive carcinoma | Female | >=65 | I/II | Unknown | Unknown | SD |
| FGD2 | SNV | Missense_Mutation | c.1645N>G | p.Ser549Gly | p.S549G | Q7Z6J4 | protein_coding | tolerated(0.62) | benign(0.003) | TCGA-AO-A0JB-01 | Breast | breast invasive carcinoma | Female | <65 | III/IV | Chemotherapy | cyclophosphamide | SD | |
| FGD2 | SNV | Missense_Mutation | rs750198030 | c.139N>A | p.Glu47Lys | p.E47K | Q7Z6J4 | protein_coding | tolerated_low_confidence(0.88) | benign(0.001) | TCGA-BH-A0E0-01 | Breast | breast invasive carcinoma | Female | <65 | III/IV | Chemotherapy | docetaxel | SD |
| FGD2 | SNV | Missense_Mutation | rs371671447 | c.356C>T | p.Ala119Val | p.A119V | Q7Z6J4 | protein_coding | tolerated(0.07) | possibly_damaging(0.611) | TCGA-BH-A0HA-01 | Breast | breast invasive carcinoma | Female | <65 | I/II | Unknown | Unknown | SD |
| FGD2 | SNV | Missense_Mutation | rs746649633 | c.997C>T | p.Arg333Cys | p.R333C | Q7Z6J4 | protein_coding | deleterious(0.01) | possibly_damaging(0.877) | TCGA-C8-A1HJ-01 | Breast | breast invasive carcinoma | Female | <65 | I/II | Unknown | Unknown | SD |
| FGD2 | SNV | Missense_Mutation | c.1616N>T | p.Ser539Leu | p.S539L | Q7Z6J4 | protein_coding | tolerated(0.08) | benign(0) | TCGA-EW-A1J5-01 | Breast | breast invasive carcinoma | Female | <65 | I/II | Chemotherapy | adriamycin | SD | |
| FGD2 | insertion | Frame_Shift_Ins | novel | c.1685_1686insC | p.Arg564ProfsTer10 | p.R564Pfs*10 | Q7Z6J4 | protein_coding | TCGA-E2-A1LH-01 | Breast | breast invasive carcinoma | Female | <65 | I/II | Chemotherapy | adriamycin | SD |
| Page: 1 2 3 4 5 6 7 8 |
Top |
Related drugs of malignant transformation related genes |
| Identification of chemicals and drugs interact with genes involved in malignant transfromation |
| (DGIdb 4.0) |
| Entrez ID | Symbol | Category | Interaction Types | Drug Claim Name | Drug Name | PMIDs |
| Page: 1 |

Copyright 2023-Present -The University of Texas Health Science Center at Houston |