
|
|||||
|
 | |
| |
| |
| |
| |
| |
|
Gene: FFAR4 |
Gene summary for FFAR4 |
| Gene information | Species | Human | Gene symbol | FFAR4 | Gene ID | 338557 |
| Gene name | free fatty acid receptor 4 | |
| Gene Alias | BMIQ10 | |
| Cytomap | 10q23.33 | |
| Gene Type | protein-coding | GO ID | GO:0000165 | UniProtAcc | B4DWG6 |
Top |
Malignant transformation analysis |
| Identification of the aberrant gene expression in precancerous and cancerous lesions by comparing the gene expression of stem-like cells in diseased tissues with normal stem cells |
| Entrez ID | Symbol | Replicates | Species | Organ | Tissue | Adj P-value | Log2FC | Malignancy |
| 338557 | FFAR4 | HTA11_2487_2000001011 | Human | Colorectum | SER | 2.26e-09 | 4.11e-01 | -0.1808 |
| 338557 | FFAR4 | HTA11_1938_2000001011 | Human | Colorectum | AD | 2.66e-04 | 2.84e-01 | -0.0811 |
| 338557 | FFAR4 | HTA11_78_2000001011 | Human | Colorectum | AD | 5.02e-12 | 4.96e-01 | -0.1088 |
| 338557 | FFAR4 | HTA11_411_2000001011 | Human | Colorectum | SER | 2.99e-08 | 1.08e+00 | -0.2602 |
| 338557 | FFAR4 | HTA11_2112_2000001011 | Human | Colorectum | SER | 5.37e-15 | 1.80e+00 | -0.2196 |
| 338557 | FFAR4 | HTA11_3361_2000001011 | Human | Colorectum | AD | 8.30e-08 | 6.50e-01 | -0.1207 |
| 338557 | FFAR4 | HTA11_696_2000001011 | Human | Colorectum | AD | 1.49e-12 | 4.40e-01 | -0.1464 |
| 338557 | FFAR4 | HTA11_866_2000001011 | Human | Colorectum | AD | 4.30e-04 | 2.64e-01 | -0.1001 |
| 338557 | FFAR4 | HTA11_1391_2000001011 | Human | Colorectum | AD | 4.43e-13 | 5.40e-01 | -0.059 |
| 338557 | FFAR4 | HTA11_6818_2000001021 | Human | Colorectum | AD | 4.94e-04 | 2.51e-01 | 0.0588 |
| 338557 | FFAR4 | HCC1 | Human | Liver | HCC | 1.25e-06 | 8.39e-01 | 0.5336 |
| 338557 | FFAR4 | HCC2 | Human | Liver | HCC | 1.48e-17 | 1.05e+00 | 0.5341 |
| 338557 | FFAR4 | HCC5 | Human | Liver | HCC | 3.16e-17 | 8.12e-01 | 0.4932 |
| Page: 1 |
| Tissue | Expression Dynamics | Abbreviation |
| Colorectum (GSE201348) |  | FAP: Familial adenomatous polyposis |
| CRC: Colorectal cancer | ||
| Colorectum (HTA11) |  | AD: Adenomas |
| SER: Sessile serrated lesions | ||
| MSI-H: Microsatellite-high colorectal cancer | ||
| MSS: Microsatellite stable colorectal cancer | ||
| Liver | 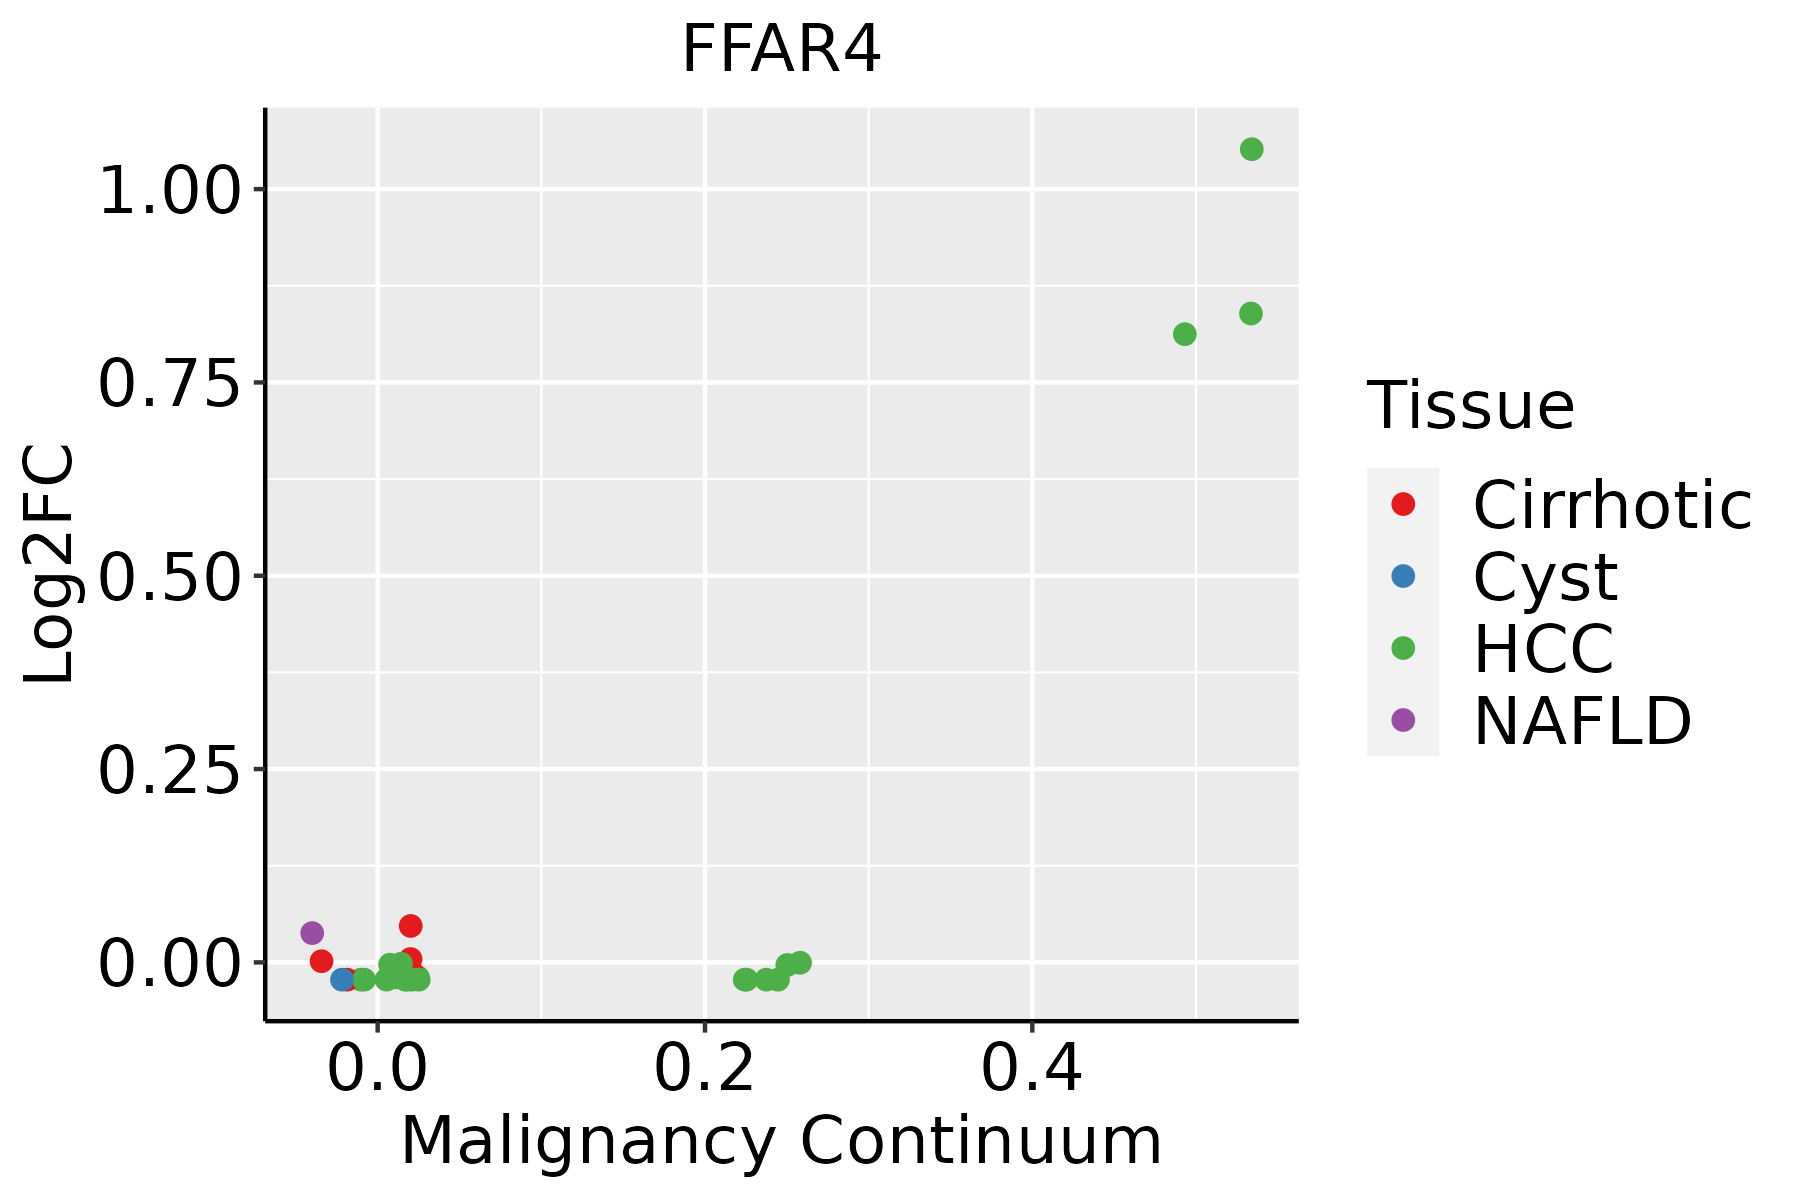 | HCC: Hepatocellular carcinoma |
| NAFLD: Non-alcoholic fatty liver disease |
| ∗log2FC in expression of this searched gene in stem-like cells from each diseased tissue sample relative to stem-like cells in normal samples in each tissue plotted against the malignancy continuum. Samples are colored based on if they are from different disease stage. |
Top |
Malignant transformation related pathway analysis |
| Find out the enriched GO biological processes and KEGG pathways involved in transition from healthy to precancer to cancer |
| Tissue | Disease Stage | Enriched GO biological Processes |
| Colorectum | AD |  |
| Colorectum | SER |  |
| Colorectum | MSS |  |
| Colorectum | MSI-H |  |
| Colorectum | FAP |  |
| ∗Top 15 enriched GO BP terms are showed in the bar plot of each disease state in each tissue. Each row represents a significant GO biological process which is colored according to the -log10(p.adjust). |
| Page: 1 2 3 4 5 6 7 8 9 |
| GO ID | Tissue | Disease Stage | Description | Gene Ratio | Bg Ratio | pvalue | p.adjust | Count |
| GO:0001649 | Colorectum | AD | osteoblast differentiation | 70/3918 | 229/18723 | 3.59e-04 | 4.18e-03 | 70 |
| GO:0051047 | Colorectum | AD | positive regulation of secretion | 90/3918 | 310/18723 | 4.11e-04 | 4.66e-03 | 90 |
| GO:1903532 | Colorectum | AD | positive regulation of secretion by cell | 82/3918 | 282/18723 | 6.85e-04 | 7.00e-03 | 82 |
| GO:0015833 | Colorectum | AD | peptide transport | 77/3918 | 264/18723 | 8.90e-04 | 8.60e-03 | 77 |
| GO:0090087 | Colorectum | AD | regulation of peptide transport | 60/3918 | 202/18723 | 1.94e-03 | 1.58e-02 | 60 |
| GO:0030072 | Colorectum | AD | peptide hormone secretion | 68/3918 | 236/18723 | 2.39e-03 | 1.85e-02 | 68 |
| GO:0002791 | Colorectum | AD | regulation of peptide secretion | 59/3918 | 200/18723 | 2.50e-03 | 1.92e-02 | 59 |
| GO:0090276 | Colorectum | AD | regulation of peptide hormone secretion | 58/3918 | 196/18723 | 2.51e-03 | 1.92e-02 | 58 |
| GO:0002790 | Colorectum | AD | peptide secretion | 69/3918 | 242/18723 | 2.97e-03 | 2.22e-02 | 69 |
| GO:0042886 | Colorectum | AD | amide transport | 83/3918 | 301/18723 | 3.37e-03 | 2.46e-02 | 83 |
| GO:0120162 | Colorectum | AD | positive regulation of cold-induced thermogenesis | 32/3918 | 97/18723 | 3.74e-03 | 2.63e-02 | 32 |
| GO:0002792 | Colorectum | AD | negative regulation of peptide secretion | 17/3918 | 44/18723 | 5.46e-03 | 3.56e-02 | 17 |
| GO:0106106 | Colorectum | AD | cold-induced thermogenesis | 43/3918 | 144/18723 | 7.05e-03 | 4.31e-02 | 43 |
| GO:0120161 | Colorectum | AD | regulation of cold-induced thermogenesis | 43/3918 | 144/18723 | 7.05e-03 | 4.31e-02 | 43 |
| GO:0001503 | Colorectum | AD | ossification | 106/3918 | 408/18723 | 7.68e-03 | 4.64e-02 | 106 |
| GO:1990845 | Colorectum | AD | adaptive thermogenesis | 46/3918 | 157/18723 | 7.97e-03 | 4.73e-02 | 46 |
| GO:00016491 | Colorectum | SER | osteoblast differentiation | 56/2897 | 229/18723 | 2.49e-04 | 4.21e-03 | 56 |
| GO:0051051 | Colorectum | SER | negative regulation of transport | 98/2897 | 470/18723 | 1.01e-03 | 1.19e-02 | 98 |
| GO:00158331 | Colorectum | SER | peptide transport | 58/2897 | 264/18723 | 3.08e-03 | 2.70e-02 | 58 |
| GO:00900871 | Colorectum | SER | regulation of peptide transport | 46/2897 | 202/18723 | 3.86e-03 | 3.18e-02 | 46 |
| Page: 1 2 |
| Pathway ID | Tissue | Disease Stage | Description | Gene Ratio | Bg Ratio | pvalue | p.adjust | qvalue | Count |
| Page: 1 |
Top |
Cell-cell communication analysis |
| Identification of potential cell-cell interactions between two cell types and their ligand-receptor pairs for different disease states |
| Ligand | Receptor | LRpair | Pathway | Tissue | Disease Stage |
| Page: 1 |
Top |
Single-cell gene regulatory network inference analysis |
| Find out the significant the regulons (TFs) and the target genes of each regulon across cell types for different disease states |
| TF | Cell Type | Tissue | Disease Stage | Target Gene | RSS | Regulon Activity |
| ∗The dot plots of a searched regulon are shown for all cell subpopulations in each disease state of each tissue based on the regulon specific score inferred using pySCENIC and by calculating the average expression. |
| Page: 1 |
Top |
Somatic mutation of malignant transformation related genes |
| Annotation of somatic variants for genes involved in malignant transformation |
| Hugo Symbol | Variant Class | Variant Classification | dbSNP RS | HGVSc | HGVSp | HGVSp Short | SWISSPROT | BIOTYPE | SIFT | PolyPhen | Tumor Sample Barcode | Tissue | Histology | Sex | Age | Stage | Therapy Types | Drugs | Outcome |
| FFAR4 | SNV | Missense_Mutation | novel | c.701C>G | p.Ser234Trp | p.S234W | Q5NUL3 | protein_coding | deleterious(0.05) | possibly_damaging(0.696) | TCGA-B6-A0RE-01 | Breast | breast invasive carcinoma | Female | <65 | I/II | Unknown | Unknown | SD |
| FFAR4 | SNV | Missense_Mutation | c.1057T>C | p.Phe353Leu | p.F353L | Q5NUL3 | protein_coding | tolerated(0.56) | benign(0.003) | TCGA-BH-A18G-01 | Breast | breast invasive carcinoma | Female | >=65 | I/II | Unknown | Unknown | SD | |
| FFAR4 | SNV | Missense_Mutation | rs138801183 | c.838C>T | p.Arg280Cys | p.R280C | Q5NUL3 | protein_coding | deleterious(0) | probably_damaging(0.989) | TCGA-C8-A1HK-01 | Breast | breast invasive carcinoma | Female | <65 | I/II | Unknown | Unknown | SD |
| FFAR4 | SNV | Missense_Mutation | novel | c.570A>C | p.Glu190Asp | p.E190D | Q5NUL3 | protein_coding | tolerated(0.15) | benign(0.085) | TCGA-2W-A8YY-01 | Cervix | cervical & endocervical cancer | Female | <65 | I/II | Chemotherapy | cisplatin | CR |
| FFAR4 | SNV | Missense_Mutation | c.350T>G | p.Val117Gly | p.V117G | Q5NUL3 | protein_coding | deleterious(0.02) | benign(0.147) | TCGA-DG-A2KH-01 | Cervix | cervical & endocervical cancer | Female | <65 | I/II | Unknown | Unknown | SD | |
| FFAR4 | SNV | Missense_Mutation | c.911N>C | p.Leu304Pro | p.L304P | Q5NUL3 | protein_coding | deleterious(0) | probably_damaging(0.99) | TCGA-A6-5665-01 | Colorectum | colon adenocarcinoma | Female | >=65 | I/II | Unknown | Unknown | PD | |
| FFAR4 | SNV | Missense_Mutation | c.1106N>T | p.Arg369Ile | p.R369I | Q5NUL3 | protein_coding | deleterious(0) | possibly_damaging(0.603) | TCGA-AA-3510-01 | Colorectum | colon adenocarcinoma | Male | >=65 | I/II | Unknown | Unknown | SD | |
| FFAR4 | SNV | Missense_Mutation | c.718N>A | p.Ala240Thr | p.A240T | Q5NUL3 | protein_coding | tolerated_low_confidence(1) | benign(0) | TCGA-AZ-6599-01 | Colorectum | colon adenocarcinoma | Male | >=65 | I/II | Unknown | Unknown | SD | |
| FFAR4 | SNV | Missense_Mutation | c.1106N>T | p.Arg369Ile | p.R369I | Q5NUL3 | protein_coding | deleterious(0) | possibly_damaging(0.603) | TCGA-CA-6717-01 | Colorectum | colon adenocarcinoma | Male | <65 | I/II | Chemotherapy | oxaliplatin | CR | |
| FFAR4 | SNV | Missense_Mutation | rs145259299 | c.730N>A | p.Val244Met | p.V244M | Q5NUL3 | protein_coding | tolerated(0.22) | benign(0.001) | TCGA-A5-A0G2-01 | Endometrium | uterine corpus endometrioid carcinoma | Female | <65 | III/IV | Unknown | Unknown | SD |
| Page: 1 2 3 4 5 |
Top |
Related drugs of malignant transformation related genes |
| Identification of chemicals and drugs interact with genes involved in malignant transfromation |
| (DGIdb 4.0) |
| Entrez ID | Symbol | Category | Interaction Types | Drug Claim Name | Drug Name | PMIDs |
| 338557 | FFAR4 | DRUGGABLE GENOME, G PROTEIN COUPLED RECEPTOR | agonist | 252166628 | ||
| 338557 | FFAR4 | DRUGGABLE GENOME, G PROTEIN COUPLED RECEPTOR | agonist | 178100239 | ||
| 338557 | FFAR4 | DRUGGABLE GENOME, G PROTEIN COUPLED RECEPTOR | agonist | 178102223 | ||
| 338557 | FFAR4 | DRUGGABLE GENOME, G PROTEIN COUPLED RECEPTOR | agonist | 178102222 | ||
| 338557 | FFAR4 | DRUGGABLE GENOME, G PROTEIN COUPLED RECEPTOR | agonist | 178102224 | ||
| 338557 | FFAR4 | DRUGGABLE GENOME, G PROTEIN COUPLED RECEPTOR | agonist | 135651531 | ||
| 338557 | FFAR4 | DRUGGABLE GENOME, G PROTEIN COUPLED RECEPTOR | agonist | 135650341 | GW9508 | |
| 338557 | FFAR4 | DRUGGABLE GENOME, G PROTEIN COUPLED RECEPTOR | agonist | 135651503 | ||
| 338557 | FFAR4 | DRUGGABLE GENOME, G PROTEIN COUPLED RECEPTOR | agonist | 135651436 |
| Page: 1 |

Copyright 2023-Present -The University of Texas Health Science Center at Houston |