
|
|||||
|
 | |
| |
| |
| |
| |
| |
|
Gene: FFAR2 |
Gene summary for FFAR2 |
| Gene information | Species | Human | Gene symbol | FFAR2 | Gene ID | 2867 |
| Gene name | free fatty acid receptor 2 | |
| Gene Alias | FFA2R | |
| Cytomap | 19q13.12 | |
| Gene Type | protein-coding | GO ID | GO:0001816 | UniProtAcc | C6KYL4 |
Top |
Malignant transformation analysis |
| Identification of the aberrant gene expression in precancerous and cancerous lesions by comparing the gene expression of stem-like cells in diseased tissues with normal stem cells |
| Entrez ID | Symbol | Replicates | Species | Organ | Tissue | Adj P-value | Log2FC | Malignancy |
| 2867 | FFAR2 | HCC1 | Human | Liver | HCC | 1.56e-03 | 5.71e-01 | 0.5336 |
| 2867 | FFAR2 | HCC2 | Human | Liver | HCC | 6.83e-09 | 5.60e-01 | 0.5341 |
| 2867 | FFAR2 | HCC5 | Human | Liver | HCC | 1.32e-05 | 8.79e-01 | 0.4932 |
| Page: 1 |
| Tissue | Expression Dynamics | Abbreviation |
| Liver | 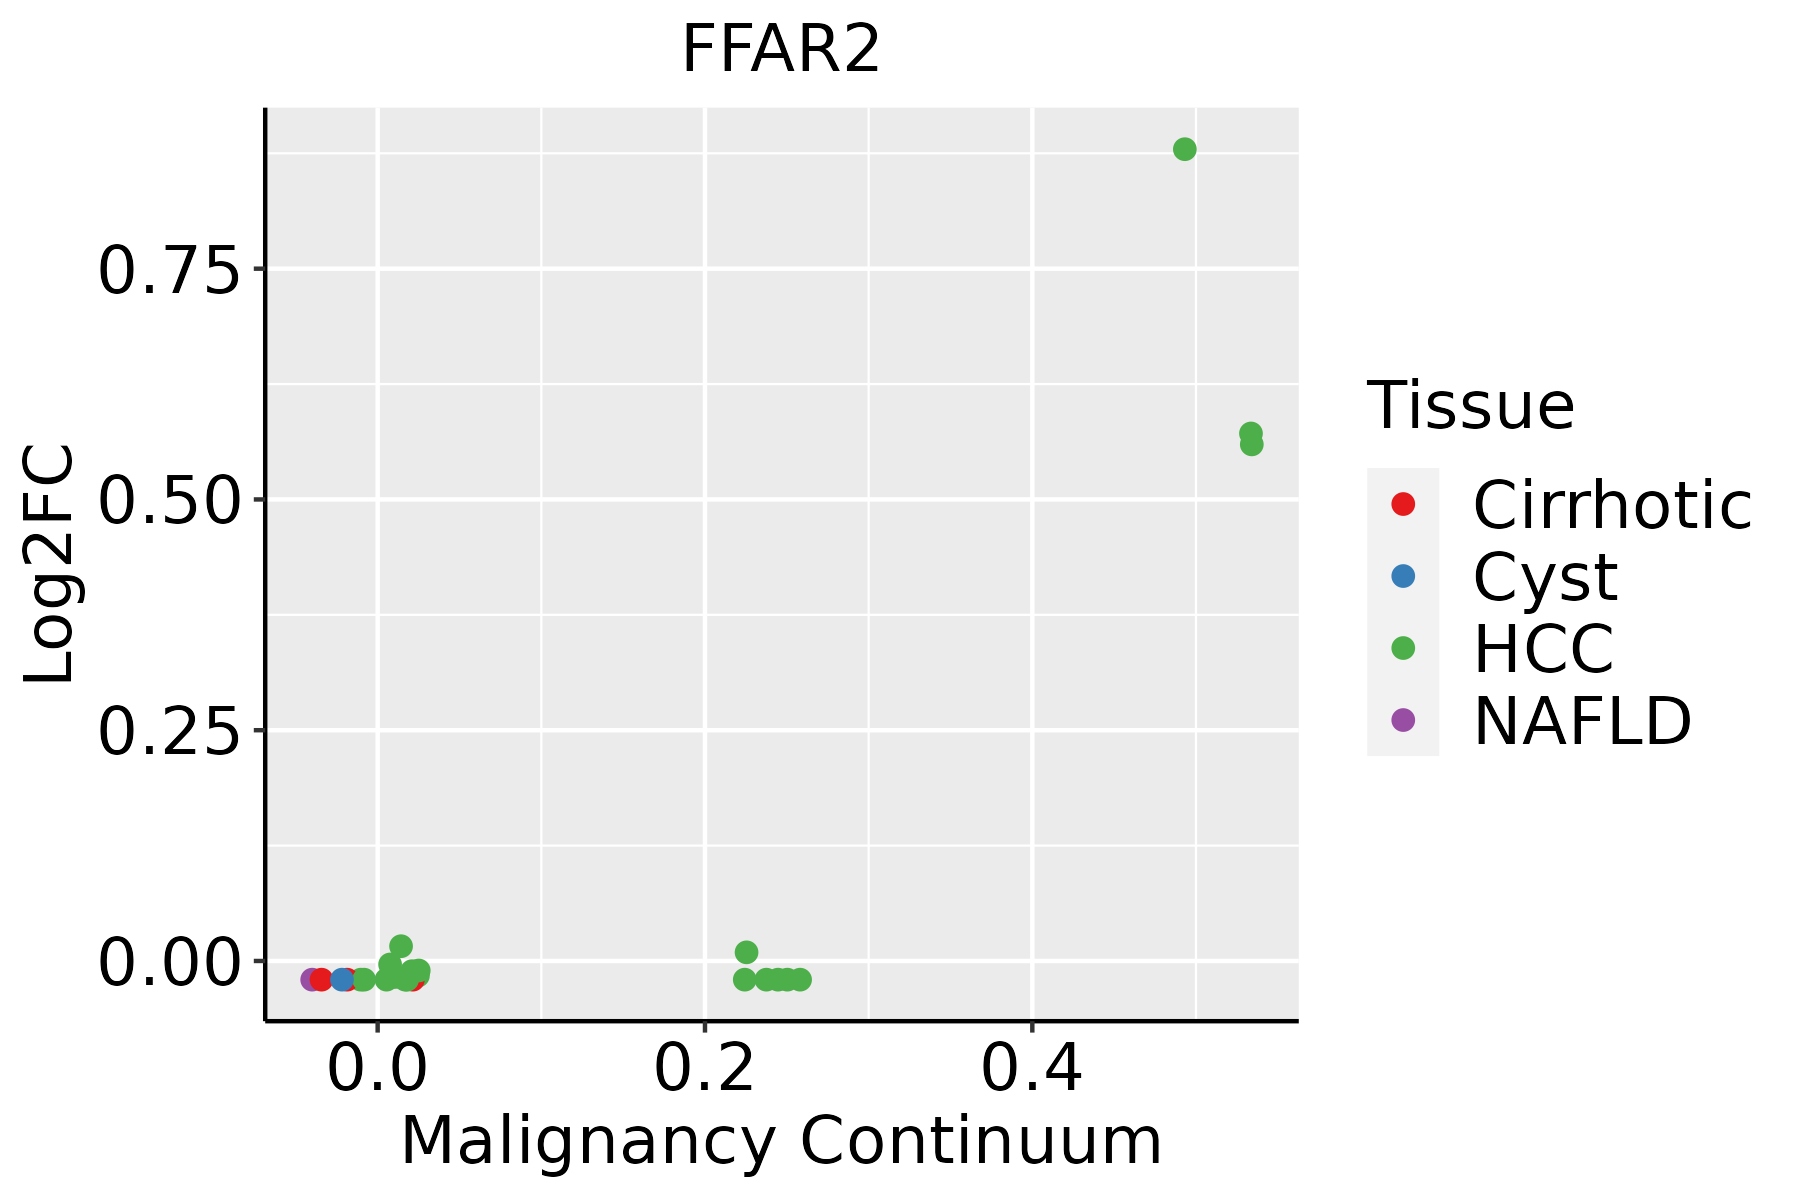 | HCC: Hepatocellular carcinoma |
| NAFLD: Non-alcoholic fatty liver disease |
| ∗log2FC in expression of this searched gene in stem-like cells from each diseased tissue sample relative to stem-like cells in normal samples in each tissue plotted against the malignancy continuum. Samples are colored based on if they are from different disease stage. |
Top |
Malignant transformation related pathway analysis |
| Find out the enriched GO biological processes and KEGG pathways involved in transition from healthy to precancer to cancer |
| Tissue | Disease Stage | Enriched GO biological Processes |
| Colorectum | AD |  |
| Colorectum | SER |  |
| Colorectum | MSS |  |
| Colorectum | MSI-H |  |
| Colorectum | FAP |  |
| ∗Top 15 enriched GO BP terms are showed in the bar plot of each disease state in each tissue. Each row represents a significant GO biological process which is colored according to the -log10(p.adjust). |
| Page: 1 2 3 4 5 6 7 8 9 |
| GO ID | Tissue | Disease Stage | Description | Gene Ratio | Bg Ratio | pvalue | p.adjust | Count |
| GO:00022211 | Liver | HCC | pattern recognition receptor signaling pathway | 107/7958 | 172/18723 | 1.37e-07 | 2.58e-06 | 107 |
| GO:005123521 | Liver | HCC | maintenance of location | 185/7958 | 327/18723 | 1.70e-07 | 3.12e-06 | 185 |
| GO:007054221 | Liver | HCC | response to fatty acid | 45/7958 | 64/18723 | 6.18e-06 | 7.56e-05 | 45 |
| GO:007139821 | Liver | HCC | cellular response to fatty acid | 29/7958 | 38/18723 | 2.35e-05 | 2.47e-04 | 29 |
| GO:00028312 | Liver | HCC | regulation of response to biotic stimulus | 173/7958 | 327/18723 | 8.55e-05 | 7.48e-04 | 173 |
| GO:001087621 | Liver | HCC | lipid localization | 228/7958 | 448/18723 | 1.80e-04 | 1.41e-03 | 228 |
| GO:004259322 | Liver | HCC | glucose homeostasis | 137/7958 | 258/18723 | 3.59e-04 | 2.49e-03 | 137 |
| GO:00199152 | Liver | HCC | lipid storage | 53/7958 | 87/18723 | 4.01e-04 | 2.71e-03 | 53 |
| GO:003350022 | Liver | HCC | carbohydrate homeostasis | 137/7958 | 259/18723 | 4.45e-04 | 2.98e-03 | 137 |
| GO:00454441 | Liver | HCC | fat cell differentiation | 120/7958 | 229/18723 | 1.52e-03 | 8.05e-03 | 120 |
| GO:00450881 | Liver | HCC | regulation of innate immune response | 113/7958 | 218/18723 | 3.27e-03 | 1.50e-02 | 113 |
| GO:00025262 | Liver | HCC | acute inflammatory response | 62/7958 | 112/18723 | 4.06e-03 | 1.77e-02 | 62 |
| GO:0002218 | Liver | HCC | activation of innate immune response | 32/7958 | 52/18723 | 4.35e-03 | 1.89e-02 | 32 |
| Page: 1 |
| Pathway ID | Tissue | Disease Stage | Description | Gene Ratio | Bg Ratio | pvalue | p.adjust | qvalue | Count |
| Page: 1 |
Top |
Cell-cell communication analysis |
| Identification of potential cell-cell interactions between two cell types and their ligand-receptor pairs for different disease states |
| Ligand | Receptor | LRpair | Pathway | Tissue | Disease Stage |
| Page: 1 |
Top |
Single-cell gene regulatory network inference analysis |
| Find out the significant the regulons (TFs) and the target genes of each regulon across cell types for different disease states |
| TF | Cell Type | Tissue | Disease Stage | Target Gene | RSS | Regulon Activity |
| ∗The dot plots of a searched regulon are shown for all cell subpopulations in each disease state of each tissue based on the regulon specific score inferred using pySCENIC and by calculating the average expression. |
| Page: 1 |
Top |
Somatic mutation of malignant transformation related genes |
| Annotation of somatic variants for genes involved in malignant transformation |
| Hugo Symbol | Variant Class | Variant Classification | dbSNP RS | HGVSc | HGVSp | HGVSp Short | SWISSPROT | BIOTYPE | SIFT | PolyPhen | Tumor Sample Barcode | Tissue | Histology | Sex | Age | Stage | Therapy Types | Drugs | Outcome |
| FFAR2 | SNV | Missense_Mutation | novel | c.44T>G | p.Ile15Ser | p.I15S | O15552 | protein_coding | deleterious(0.02) | possibly_damaging(0.543) | TCGA-EA-A3HU-01 | Cervix | cervical & endocervical cancer | Female | <65 | I/II | Unknown | Unknown | SD |
| FFAR2 | SNV | Missense_Mutation | rs200165905 | c.649C>T | p.Arg217Trp | p.R217W | O15552 | protein_coding | deleterious(0) | probably_damaging(0.986) | TCGA-AA-A004-01 | Colorectum | colon adenocarcinoma | Male | >=65 | I/II | Unknown | Unknown | SD |
| FFAR2 | SNV | Missense_Mutation | rs774217360 | c.343G>A | p.Val115Met | p.V115M | O15552 | protein_coding | deleterious(0) | possibly_damaging(0.686) | TCGA-AD-5900-01 | Colorectum | colon adenocarcinoma | Male | >=65 | I/II | Unknown | Unknown | SD |
| FFAR2 | SNV | Missense_Mutation | c.385N>A | p.Ala129Thr | p.A129T | O15552 | protein_coding | tolerated(0.06) | probably_damaging(0.945) | TCGA-CA-6718-01 | Colorectum | colon adenocarcinoma | Male | <65 | I/II | Unknown | Unknown | PD | |
| FFAR2 | SNV | Missense_Mutation | rs775045094 | c.209N>T | p.Ala70Val | p.A70V | O15552 | protein_coding | tolerated(0.21) | benign(0.313) | TCGA-EI-6507-01 | Colorectum | rectum adenocarcinoma | Male | <65 | I/II | Unknown | Unknown | SD |
| FFAR2 | SNV | Missense_Mutation | rs771781550 | c.439N>A | p.Val147Ile | p.V147I | O15552 | protein_coding | tolerated(0.18) | benign(0.056) | TCGA-EI-6882-01 | Colorectum | rectum adenocarcinoma | Male | <65 | I/II | Unknown | Unknown | SD |
| FFAR2 | insertion | Frame_Shift_Ins | novel | c.98_99insG | p.Arg35AlafsTer120 | p.R35Afs*120 | O15552 | protein_coding | TCGA-AA-3713-01 | Colorectum | colon adenocarcinoma | Male | >=65 | III/IV | Chemotherapy | 5-fluorouracil | PR | ||
| FFAR2 | SNV | Missense_Mutation | c.370C>A | p.Leu124Met | p.L124M | O15552 | protein_coding | tolerated(0.12) | benign(0.089) | TCGA-A5-A0G2-01 | Endometrium | uterine corpus endometrioid carcinoma | Female | <65 | III/IV | Unknown | Unknown | SD | |
| FFAR2 | SNV | Missense_Mutation | novel | c.627G>T | p.Gln209His | p.Q209H | O15552 | protein_coding | tolerated(0.05) | probably_damaging(0.971) | TCGA-A5-A0G2-01 | Endometrium | uterine corpus endometrioid carcinoma | Female | <65 | III/IV | Unknown | Unknown | SD |
| FFAR2 | SNV | Missense_Mutation | novel | c.401G>T | p.Trp134Leu | p.W134L | O15552 | protein_coding | deleterious(0.01) | possibly_damaging(0.903) | TCGA-AX-A06F-01 | Endometrium | uterine corpus endometrioid carcinoma | Female | <65 | III/IV | Chemotherapy | carboplatin | SD |
| Page: 1 2 3 4 5 |
Top |
Related drugs of malignant transformation related genes |
| Identification of chemicals and drugs interact with genes involved in malignant transfromation |
| (DGIdb 4.0) |
| Entrez ID | Symbol | Category | Interaction Types | Drug Claim Name | Drug Name | PMIDs |
| 2867 | FFAR2 | KINASE, G PROTEIN COUPLED RECEPTOR, DRUGGABLE GENOME | antagonist | 252166627 | GLPG-0974 | |
| 2867 | FFAR2 | KINASE, G PROTEIN COUPLED RECEPTOR, DRUGGABLE GENOME | agonist | 178100426 | ||
| 2867 | FFAR2 | KINASE, G PROTEIN COUPLED RECEPTOR, DRUGGABLE GENOME | agonist | 135651494 | ||
| 2867 | FFAR2 | KINASE, G PROTEIN COUPLED RECEPTOR, DRUGGABLE GENOME | GLPG0974 | GLPG-0974 | ||
| 2867 | FFAR2 | KINASE, G PROTEIN COUPLED RECEPTOR, DRUGGABLE GENOME | allosteric modulator | 178102428 | ||
| 2867 | FFAR2 | KINASE, G PROTEIN COUPLED RECEPTOR, DRUGGABLE GENOME | HL-018 | |||
| 2867 | FFAR2 | KINASE, G PROTEIN COUPLED RECEPTOR, DRUGGABLE GENOME | agonist | 135650039 | ||
| 2867 | FFAR2 | KINASE, G PROTEIN COUPLED RECEPTOR, DRUGGABLE GENOME | agonist | 178103113 | ||
| 2867 | FFAR2 | KINASE, G PROTEIN COUPLED RECEPTOR, DRUGGABLE GENOME | antagonist | 178103101 | ||
| 2867 | FFAR2 | KINASE, G PROTEIN COUPLED RECEPTOR, DRUGGABLE GENOME | agonist | 135651552 |
| Page: 1 2 |

Copyright 2023-Present -The University of Texas Health Science Center at Houston |