
|
|||||
|
 | |
| |
| |
| |
| |
| |
|
Gene: FEZ2 |
Gene summary for FEZ2 |
| Gene information | Species | Human | Gene symbol | FEZ2 | Gene ID | 9637 |
| Gene name | fasciculation and elongation protein zeta 2 | |
| Gene Alias | HUM3CL | |
| Cytomap | 2p22.2 | |
| Gene Type | protein-coding | GO ID | GO:0000045 | UniProtAcc | Q9UHY8 |
Top |
Malignant transformation analysis |
| Identification of the aberrant gene expression in precancerous and cancerous lesions by comparing the gene expression of stem-like cells in diseased tissues with normal stem cells |
| Entrez ID | Symbol | Replicates | Species | Organ | Tissue | Adj P-value | Log2FC | Malignancy |
| 9637 | FEZ2 | HTA11_3410_2000001011 | Human | Colorectum | AD | 7.06e-22 | -6.76e-01 | 0.0155 |
| 9637 | FEZ2 | HTA11_2487_2000001011 | Human | Colorectum | SER | 1.23e-07 | -5.65e-01 | -0.1808 |
| 9637 | FEZ2 | HTA11_3361_2000001011 | Human | Colorectum | AD | 6.41e-07 | -6.14e-01 | -0.1207 |
| 9637 | FEZ2 | HTA11_696_2000001011 | Human | Colorectum | AD | 7.10e-16 | -4.97e-01 | -0.1464 |
| 9637 | FEZ2 | HTA11_866_2000001011 | Human | Colorectum | AD | 1.95e-10 | -4.51e-01 | -0.1001 |
| 9637 | FEZ2 | HTA11_1391_2000001011 | Human | Colorectum | AD | 3.03e-10 | -5.48e-01 | -0.059 |
| 9637 | FEZ2 | HTA11_546_2000001011 | Human | Colorectum | AD | 2.22e-02 | -5.22e-01 | -0.0842 |
| 9637 | FEZ2 | HTA11_866_3004761011 | Human | Colorectum | AD | 1.78e-09 | -5.54e-01 | 0.096 |
| 9637 | FEZ2 | HTA11_8622_2000001021 | Human | Colorectum | SER | 3.41e-02 | -5.97e-01 | 0.0528 |
| 9637 | FEZ2 | HTA11_10711_2000001011 | Human | Colorectum | AD | 1.27e-06 | -5.53e-01 | 0.0338 |
| 9637 | FEZ2 | HTA11_7696_3000711011 | Human | Colorectum | AD | 7.37e-12 | -4.68e-01 | 0.0674 |
| 9637 | FEZ2 | HTA11_6818_2000001021 | Human | Colorectum | AD | 6.80e-03 | -5.18e-01 | 0.0588 |
| 9637 | FEZ2 | HTA11_99999970781_79442 | Human | Colorectum | MSS | 1.63e-12 | -4.60e-01 | 0.294 |
| 9637 | FEZ2 | HTA11_99999965104_69814 | Human | Colorectum | MSS | 1.26e-02 | -4.38e-01 | 0.281 |
| 9637 | FEZ2 | HTA11_99999971662_82457 | Human | Colorectum | MSS | 2.75e-14 | -5.06e-01 | 0.3859 |
| 9637 | FEZ2 | HTA11_99999973899_84307 | Human | Colorectum | MSS | 1.47e-05 | -6.26e-01 | 0.2585 |
| 9637 | FEZ2 | HTA11_99999974143_84620 | Human | Colorectum | MSS | 1.46e-21 | -6.03e-01 | 0.3005 |
| 9637 | FEZ2 | A001-C-207 | Human | Colorectum | FAP | 4.30e-02 | -1.52e-01 | 0.1278 |
| 9637 | FEZ2 | A015-C-203 | Human | Colorectum | FAP | 1.77e-26 | -3.95e-01 | -0.1294 |
| 9637 | FEZ2 | A015-C-204 | Human | Colorectum | FAP | 2.13e-03 | -1.81e-01 | -0.0228 |
| Page: 1 2 3 4 5 6 7 8 9 |
| Tissue | Expression Dynamics | Abbreviation |
| Colorectum (GSE201348) |  | FAP: Familial adenomatous polyposis |
| CRC: Colorectal cancer | ||
| Colorectum (HTA11) |  | AD: Adenomas |
| SER: Sessile serrated lesions | ||
| MSI-H: Microsatellite-high colorectal cancer | ||
| MSS: Microsatellite stable colorectal cancer | ||
| Esophagus | 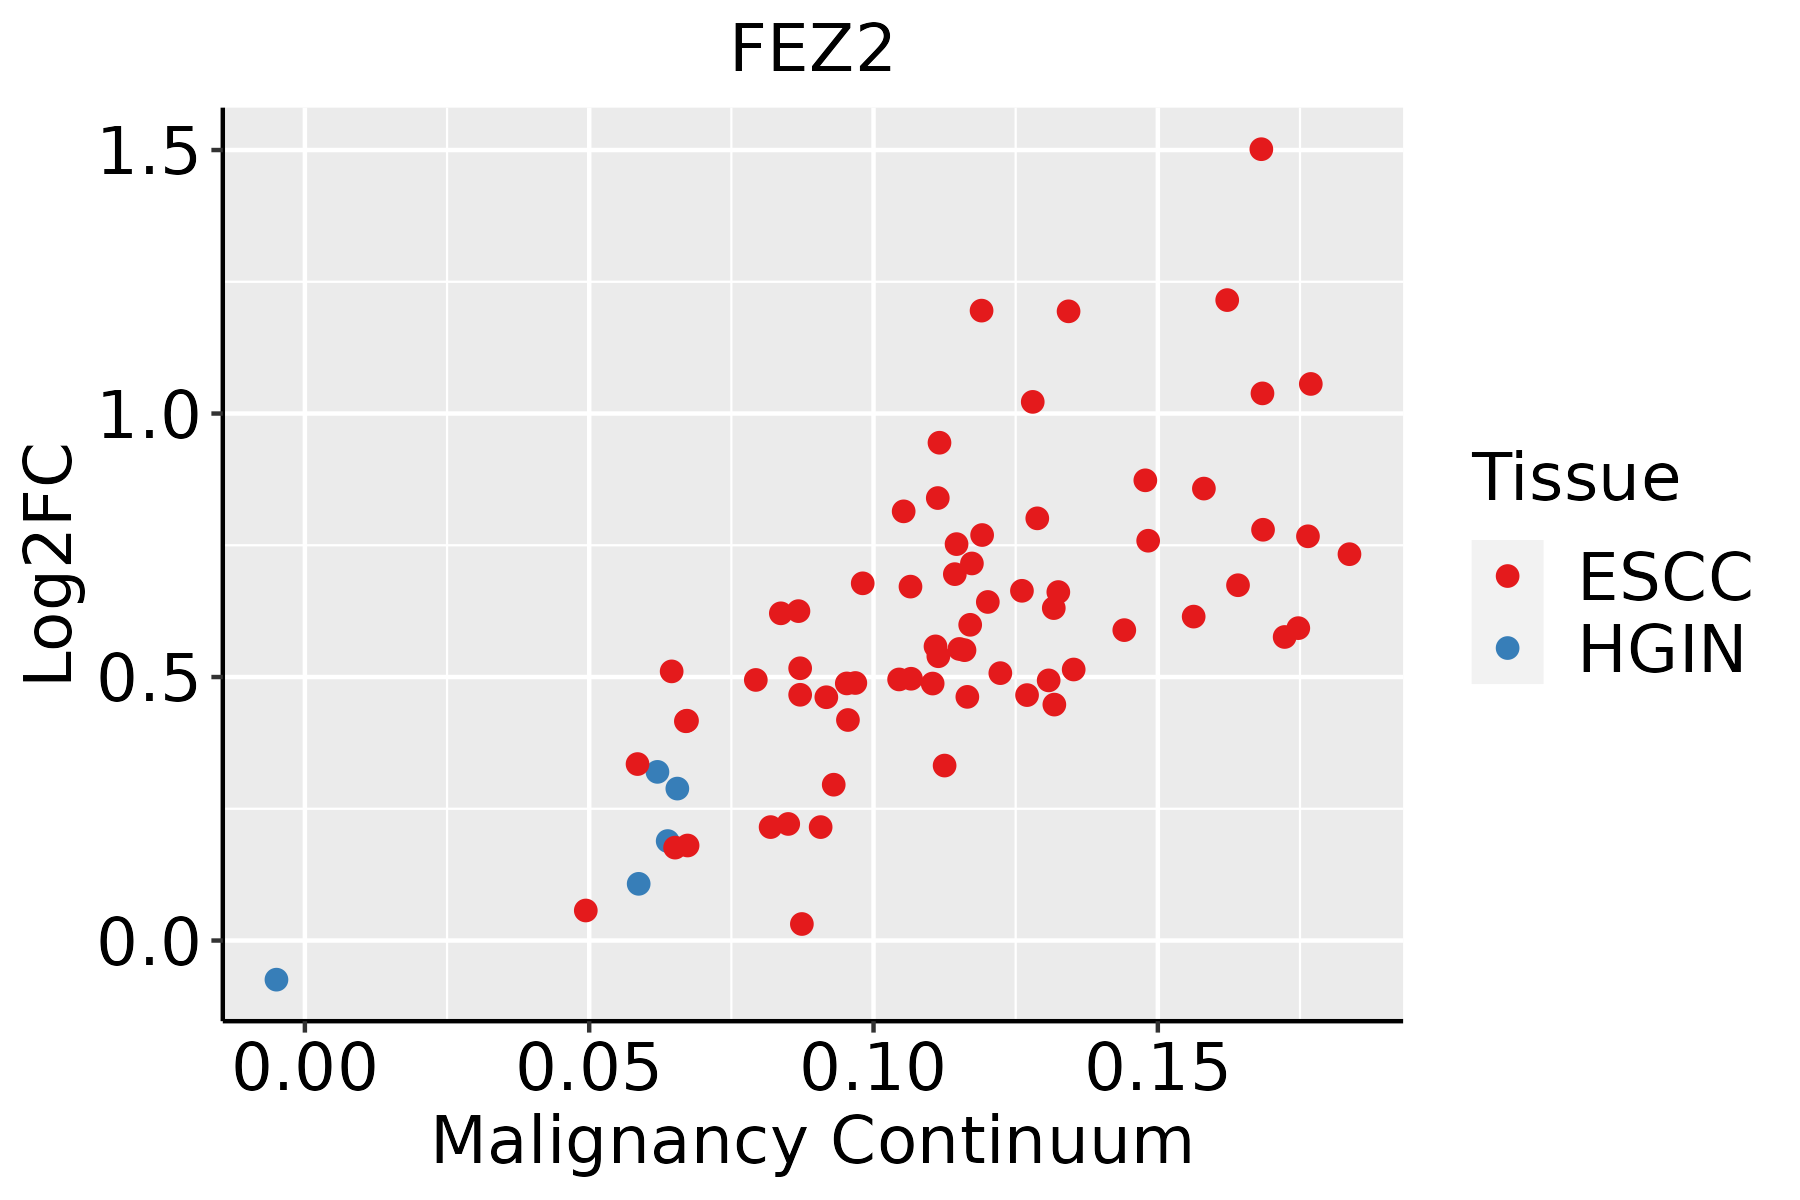 | ESCC: Esophageal squamous cell carcinoma |
| HGIN: High-grade intraepithelial neoplasias | ||
| LGIN: Low-grade intraepithelial neoplasias | ||
| Liver |  | HCC: Hepatocellular carcinoma |
| NAFLD: Non-alcoholic fatty liver disease | ||
| Lung | 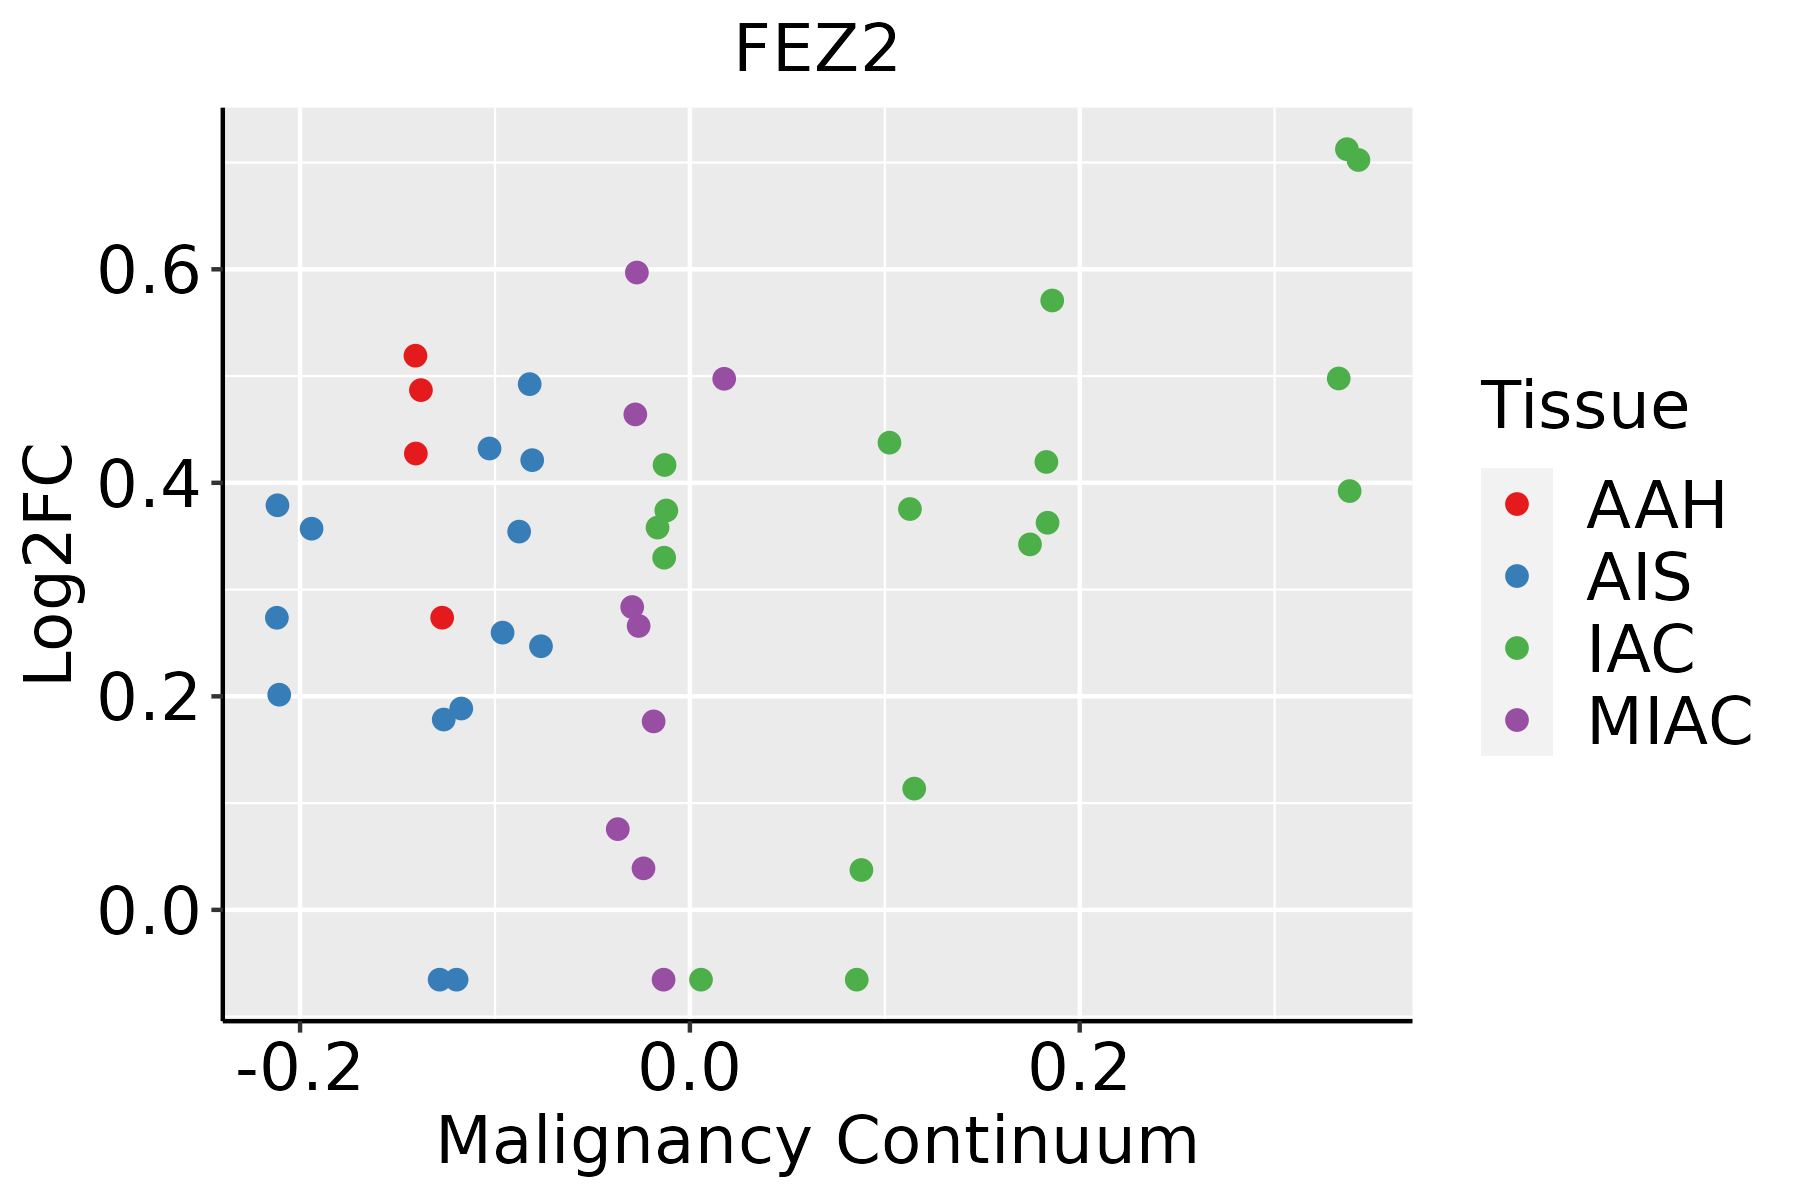 | AAH: Atypical adenomatous hyperplasia |
| AIS: Adenocarcinoma in situ | ||
| IAC: Invasive lung adenocarcinoma | ||
| MIA: Minimally invasive adenocarcinoma | ||
| Oral Cavity | 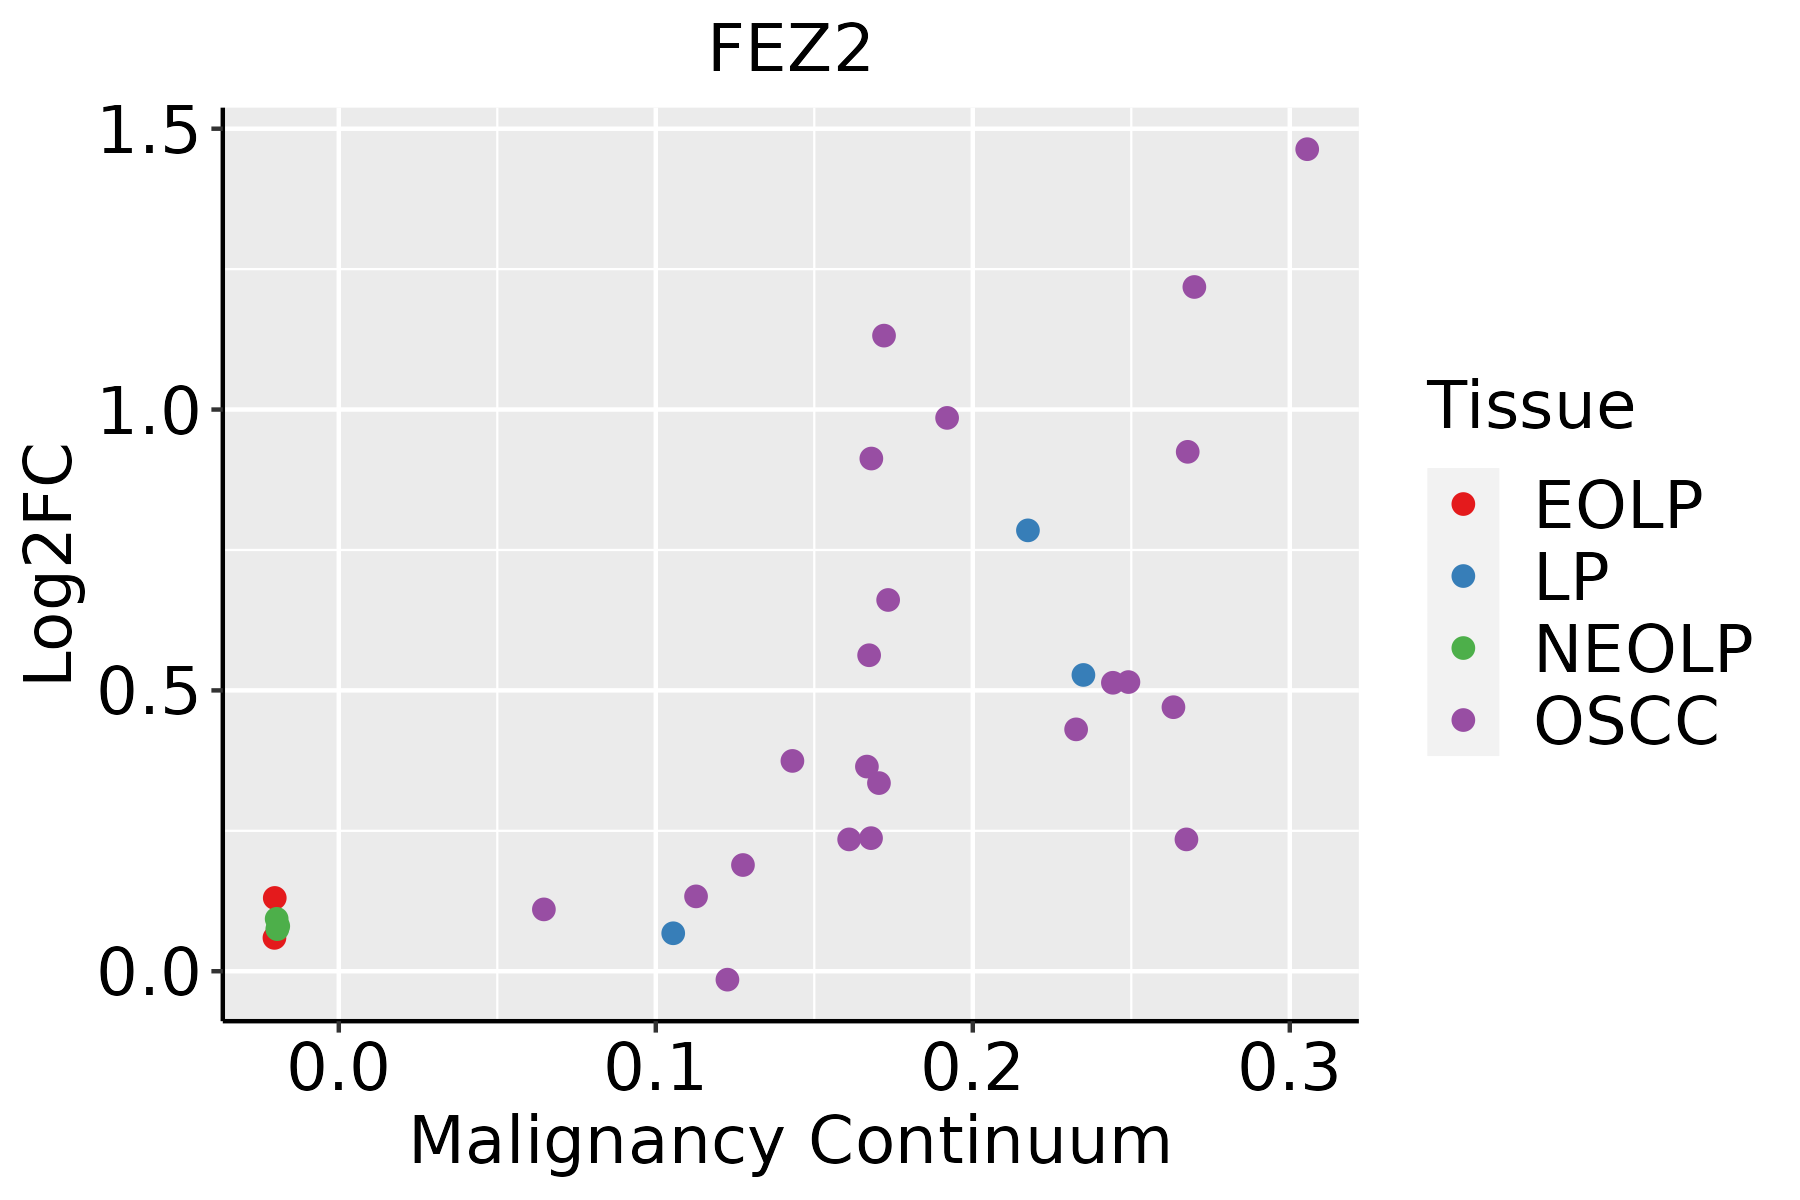 | EOLP: Erosive Oral lichen planus |
| LP: leukoplakia | ||
| NEOLP: Non-erosive oral lichen planus | ||
| OSCC: Oral squamous cell carcinoma | ||
| Skin | 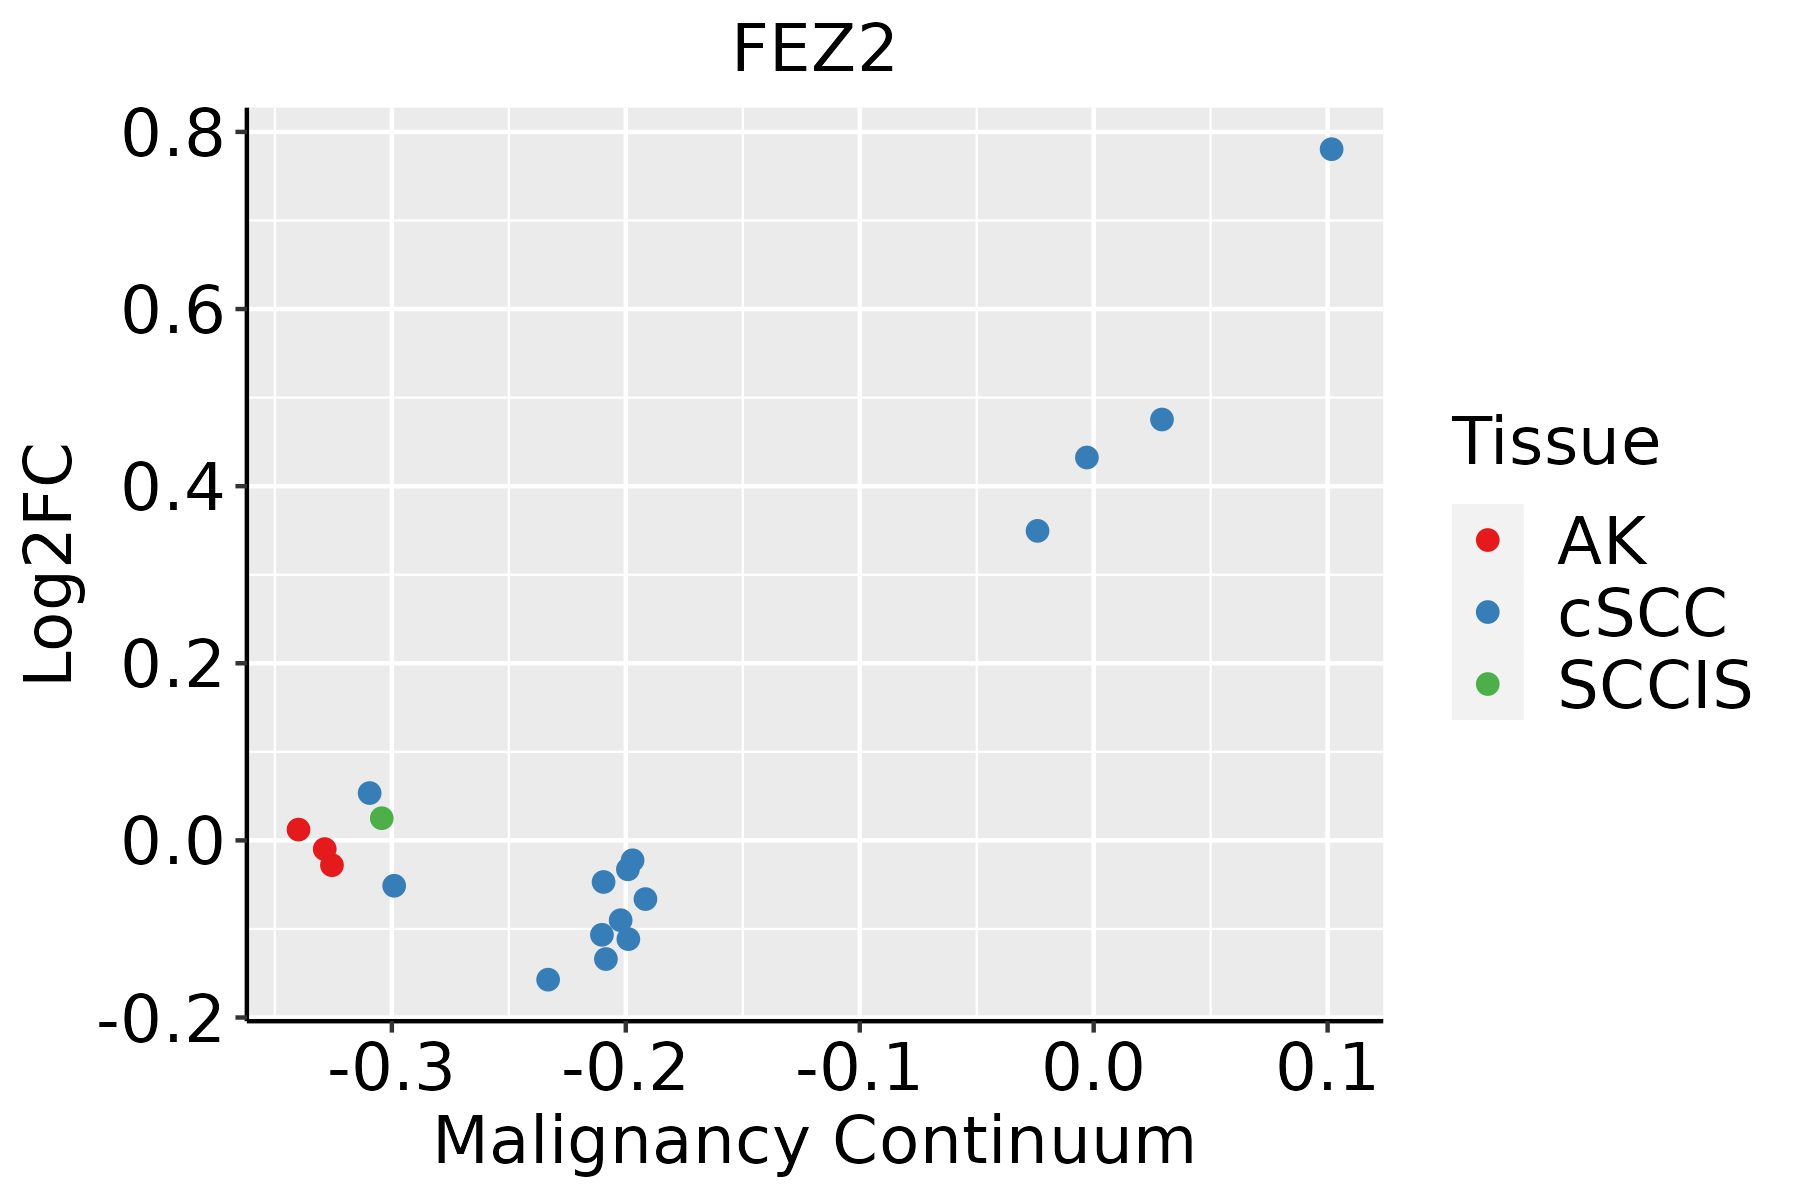 | AK: Actinic keratosis |
| cSCC: Cutaneous squamous cell carcinoma | ||
| SCCIS:squamous cell carcinoma in situ | ||
| Thyroid |  | ATC: Anaplastic thyroid cancer |
| HT: Hashimoto's thyroiditis | ||
| PTC: Papillary thyroid cancer |
| ∗log2FC in expression of this searched gene in stem-like cells from each diseased tissue sample relative to stem-like cells in normal samples in each tissue plotted against the malignancy continuum. Samples are colored based on if they are from different disease stage. |
Top |
Malignant transformation related pathway analysis |
| Find out the enriched GO biological processes and KEGG pathways involved in transition from healthy to precancer to cancer |
| Tissue | Disease Stage | Enriched GO biological Processes |
| Colorectum | AD |  |
| Colorectum | SER |  |
| Colorectum | MSS |  |
| Colorectum | MSI-H |  |
| Colorectum | FAP |  |
| ∗Top 15 enriched GO BP terms are showed in the bar plot of each disease state in each tissue. Each row represents a significant GO biological process which is colored according to the -log10(p.adjust). |
| Page: 1 2 3 4 5 6 7 8 9 |
| GO ID | Tissue | Disease Stage | Description | Gene Ratio | Bg Ratio | pvalue | p.adjust | Count |
| GO:0009895 | Colorectum | AD | negative regulation of catabolic process | 124/3918 | 320/18723 | 1.66e-13 | 3.35e-11 | 124 |
| GO:0031330 | Colorectum | AD | negative regulation of cellular catabolic process | 104/3918 | 262/18723 | 2.66e-12 | 3.96e-10 | 104 |
| GO:0010506 | Colorectum | AD | regulation of autophagy | 111/3918 | 317/18723 | 3.57e-09 | 2.35e-07 | 111 |
| GO:0016236 | Colorectum | AD | macroautophagy | 103/3918 | 291/18723 | 6.76e-09 | 4.15e-07 | 103 |
| GO:0010639 | Colorectum | AD | negative regulation of organelle organization | 114/3918 | 348/18723 | 1.41e-07 | 6.49e-06 | 114 |
| GO:0007409 | Colorectum | AD | axonogenesis | 122/3918 | 418/18723 | 3.36e-05 | 6.15e-04 | 122 |
| GO:0016241 | Colorectum | AD | regulation of macroautophagy | 50/3918 | 141/18723 | 4.55e-05 | 7.92e-04 | 50 |
| GO:0061564 | Colorectum | AD | axon development | 132/3918 | 467/18723 | 8.40e-05 | 1.31e-03 | 132 |
| GO:0010507 | Colorectum | AD | negative regulation of autophagy | 31/3918 | 85/18723 | 6.91e-04 | 7.05e-03 | 31 |
| GO:0007033 | Colorectum | AD | vacuole organization | 53/3918 | 180/18723 | 4.18e-03 | 2.89e-02 | 53 |
| GO:0007411 | Colorectum | AD | axon guidance | 64/3918 | 227/18723 | 5.41e-03 | 3.55e-02 | 64 |
| GO:0097485 | Colorectum | AD | neuron projection guidance | 64/3918 | 228/18723 | 6.02e-03 | 3.78e-02 | 64 |
| GO:00162361 | Colorectum | SER | macroautophagy | 79/2897 | 291/18723 | 1.97e-07 | 1.10e-05 | 79 |
| GO:00106391 | Colorectum | SER | negative regulation of organelle organization | 90/2897 | 348/18723 | 3.14e-07 | 1.69e-05 | 90 |
| GO:00098951 | Colorectum | SER | negative regulation of catabolic process | 84/2897 | 320/18723 | 3.93e-07 | 2.06e-05 | 84 |
| GO:00313301 | Colorectum | SER | negative regulation of cellular catabolic process | 70/2897 | 262/18723 | 1.79e-06 | 7.70e-05 | 70 |
| GO:00105061 | Colorectum | SER | regulation of autophagy | 74/2897 | 317/18723 | 1.39e-04 | 2.77e-03 | 74 |
| GO:00074111 | Colorectum | SER | axon guidance | 51/2897 | 227/18723 | 3.29e-03 | 2.82e-02 | 51 |
| GO:00974851 | Colorectum | SER | neuron projection guidance | 51/2897 | 228/18723 | 3.61e-03 | 3.03e-02 | 51 |
| GO:00615641 | Colorectum | SER | axon development | 94/2897 | 467/18723 | 3.78e-03 | 3.13e-02 | 94 |
| Page: 1 2 3 4 5 6 7 8 9 10 |
| Pathway ID | Tissue | Disease Stage | Description | Gene Ratio | Bg Ratio | pvalue | p.adjust | qvalue | Count |
| Page: 1 |
Top |
Cell-cell communication analysis |
| Identification of potential cell-cell interactions between two cell types and their ligand-receptor pairs for different disease states |
| Ligand | Receptor | LRpair | Pathway | Tissue | Disease Stage |
| Page: 1 |
Top |
Single-cell gene regulatory network inference analysis |
| Find out the significant the regulons (TFs) and the target genes of each regulon across cell types for different disease states |
| TF | Cell Type | Tissue | Disease Stage | Target Gene | RSS | Regulon Activity |
| ∗The dot plots of a searched regulon are shown for all cell subpopulations in each disease state of each tissue based on the regulon specific score inferred using pySCENIC and by calculating the average expression. |
| Page: 1 |
Top |
Somatic mutation of malignant transformation related genes |
| Annotation of somatic variants for genes involved in malignant transformation |
| Hugo Symbol | Variant Class | Variant Classification | dbSNP RS | HGVSc | HGVSp | HGVSp Short | SWISSPROT | BIOTYPE | SIFT | PolyPhen | Tumor Sample Barcode | Tissue | Histology | Sex | Age | Stage | Therapy Types | Drugs | Outcome |
| FEZ2 | deletion | Frame_Shift_Del | novel | c.389delT | p.Leu130CysfsTer11 | p.L130Cfs*11 | Q9UHY8 | protein_coding | TCGA-D8-A27V-01 | Breast | breast invasive carcinoma | Female | <65 | I/II | Hormone Therapy | tamoxiphen | SD | ||
| FEZ2 | SNV | Missense_Mutation | novel | c.737N>A | p.Arg246Gln | p.R246Q | Q9UHY8 | protein_coding | deleterious(0) | probably_damaging(0.996) | TCGA-EK-A2RM-01 | Cervix | cervical & endocervical cancer | Female | <65 | I/II | Unknown | Unknown | SD |
| FEZ2 | deletion | In_Frame_Del | novel | c.837_839delGAA | p.Lys282del | p.K282del | Q9UHY8 | protein_coding | TCGA-EK-A3GK-01 | Cervix | cervical & endocervical cancer | Female | <65 | I/II | Unknown | Unknown | SD | ||
| FEZ2 | SNV | Missense_Mutation | c.633G>T | p.Glu211Asp | p.E211D | Q9UHY8 | protein_coding | tolerated(0.33) | benign(0.02) | TCGA-AA-A00N-01 | Colorectum | colon adenocarcinoma | Male | >=65 | I/II | Unknown | Unknown | PD | |
| FEZ2 | SNV | Missense_Mutation | rs781733221 | c.899N>A | p.Gly300Asp | p.G300D | Q9UHY8 | protein_coding | tolerated(0.34) | probably_damaging(1) | TCGA-CA-6717-01 | Colorectum | colon adenocarcinoma | Male | <65 | I/II | Chemotherapy | oxaliplatin | CR |
| FEZ2 | SNV | Missense_Mutation | c.894N>A | p.Met298Ile | p.M298I | Q9UHY8 | protein_coding | tolerated(0.12) | benign(0.169) | TCGA-CK-4951-01 | Colorectum | colon adenocarcinoma | Female | >=65 | I/II | Unknown | Unknown | PD | |
| FEZ2 | SNV | Missense_Mutation | c.853N>C | p.Asn285His | p.N285H | Q9UHY8 | protein_coding | deleterious(0.03) | possibly_damaging(0.632) | TCGA-AG-A002-01 | Colorectum | rectum adenocarcinoma | Male | <65 | I/II | Unknown | Unknown | SD | |
| FEZ2 | SNV | Missense_Mutation | c.516G>A | p.Met172Ile | p.M172I | Q9UHY8 | protein_coding | tolerated(0.05) | benign(0.058) | TCGA-EI-6917-01 | Colorectum | rectum adenocarcinoma | Male | <65 | III/IV | Chemotherapy | 5fluorouracil+oxaciplatina+l-folinian | SD | |
| FEZ2 | insertion | In_Frame_Ins | novel | c.514_515insCTATACATT | p.Met172delinsThrIleHisLeu | p.M172delinsTIHL | Q9UHY8 | protein_coding | TCGA-AM-5820-01 | Colorectum | colon adenocarcinoma | Female | <65 | I/II | Unknown | Unknown | SD | ||
| FEZ2 | deletion | Frame_Shift_Del | c.1019delN | p.Asn340ThrfsTer12 | p.N340Tfs*12 | Q9UHY8 | protein_coding | TCGA-G4-6628-01 | Colorectum | colon adenocarcinoma | Male | >=65 | I/II | Unknown | Unknown | SD |
| Page: 1 2 3 |
Top |
Related drugs of malignant transformation related genes |
| Identification of chemicals and drugs interact with genes involved in malignant transfromation |
| (DGIdb 4.0) |
| Entrez ID | Symbol | Category | Interaction Types | Drug Claim Name | Drug Name | PMIDs |
| Page: 1 |

Copyright 2023-Present -The University of Texas Health Science Center at Houston |