
|
|||||
|
 | |
| |
| |
| |
| |
| |
|
Gene: FEZ1 |
Gene summary for FEZ1 |
| Gene information | Species | Human | Gene symbol | FEZ1 | Gene ID | 9638 |
| Gene name | fasciculation and elongation protein zeta 1 | |
| Gene Alias | UNC-76 | |
| Cytomap | 11q24.2 | |
| Gene Type | protein-coding | GO ID | GO:0000045 | UniProtAcc | Q99689 |
Top |
Malignant transformation analysis |
| Identification of the aberrant gene expression in precancerous and cancerous lesions by comparing the gene expression of stem-like cells in diseased tissues with normal stem cells |
| Entrez ID | Symbol | Replicates | Species | Organ | Tissue | Adj P-value | Log2FC | Malignancy |
| 9638 | FEZ1 | LZE4T | Human | Esophagus | ESCC | 9.41e-03 | 2.21e-01 | 0.0811 |
| 9638 | FEZ1 | LZE24T | Human | Esophagus | ESCC | 3.11e-03 | 1.64e-01 | 0.0596 |
| 9638 | FEZ1 | P1T-E | Human | Esophagus | ESCC | 5.14e-04 | 2.39e-01 | 0.0875 |
| 9638 | FEZ1 | P2T-E | Human | Esophagus | ESCC | 9.02e-27 | 4.72e-01 | 0.1177 |
| 9638 | FEZ1 | P4T-E | Human | Esophagus | ESCC | 3.06e-04 | 2.21e-01 | 0.1323 |
| 9638 | FEZ1 | P5T-E | Human | Esophagus | ESCC | 5.08e-10 | 1.95e-01 | 0.1327 |
| 9638 | FEZ1 | P8T-E | Human | Esophagus | ESCC | 8.91e-12 | 3.29e-01 | 0.0889 |
| 9638 | FEZ1 | P9T-E | Human | Esophagus | ESCC | 6.10e-04 | 2.57e-01 | 0.1131 |
| 9638 | FEZ1 | P10T-E | Human | Esophagus | ESCC | 8.44e-03 | 1.26e-01 | 0.116 |
| 9638 | FEZ1 | P11T-E | Human | Esophagus | ESCC | 3.42e-32 | 1.25e+00 | 0.1426 |
| 9638 | FEZ1 | P12T-E | Human | Esophagus | ESCC | 1.58e-02 | 1.16e-01 | 0.1122 |
| 9638 | FEZ1 | P16T-E | Human | Esophagus | ESCC | 5.82e-12 | 2.90e-01 | 0.1153 |
| 9638 | FEZ1 | P17T-E | Human | Esophagus | ESCC | 2.25e-02 | 2.64e-01 | 0.1278 |
| 9638 | FEZ1 | P19T-E | Human | Esophagus | ESCC | 5.87e-20 | 1.52e+00 | 0.1662 |
| 9638 | FEZ1 | P20T-E | Human | Esophagus | ESCC | 1.35e-03 | 1.57e-01 | 0.1124 |
| 9638 | FEZ1 | P21T-E | Human | Esophagus | ESCC | 6.41e-81 | 2.07e+00 | 0.1617 |
| 9638 | FEZ1 | P22T-E | Human | Esophagus | ESCC | 6.83e-07 | 1.24e-01 | 0.1236 |
| 9638 | FEZ1 | P23T-E | Human | Esophagus | ESCC | 1.09e-07 | 3.67e-01 | 0.108 |
| 9638 | FEZ1 | P24T-E | Human | Esophagus | ESCC | 7.60e-09 | 3.37e-01 | 0.1287 |
| 9638 | FEZ1 | P26T-E | Human | Esophagus | ESCC | 7.17e-25 | 5.68e-01 | 0.1276 |
| Page: 1 2 3 4 |
| Tissue | Expression Dynamics | Abbreviation |
| Esophagus | 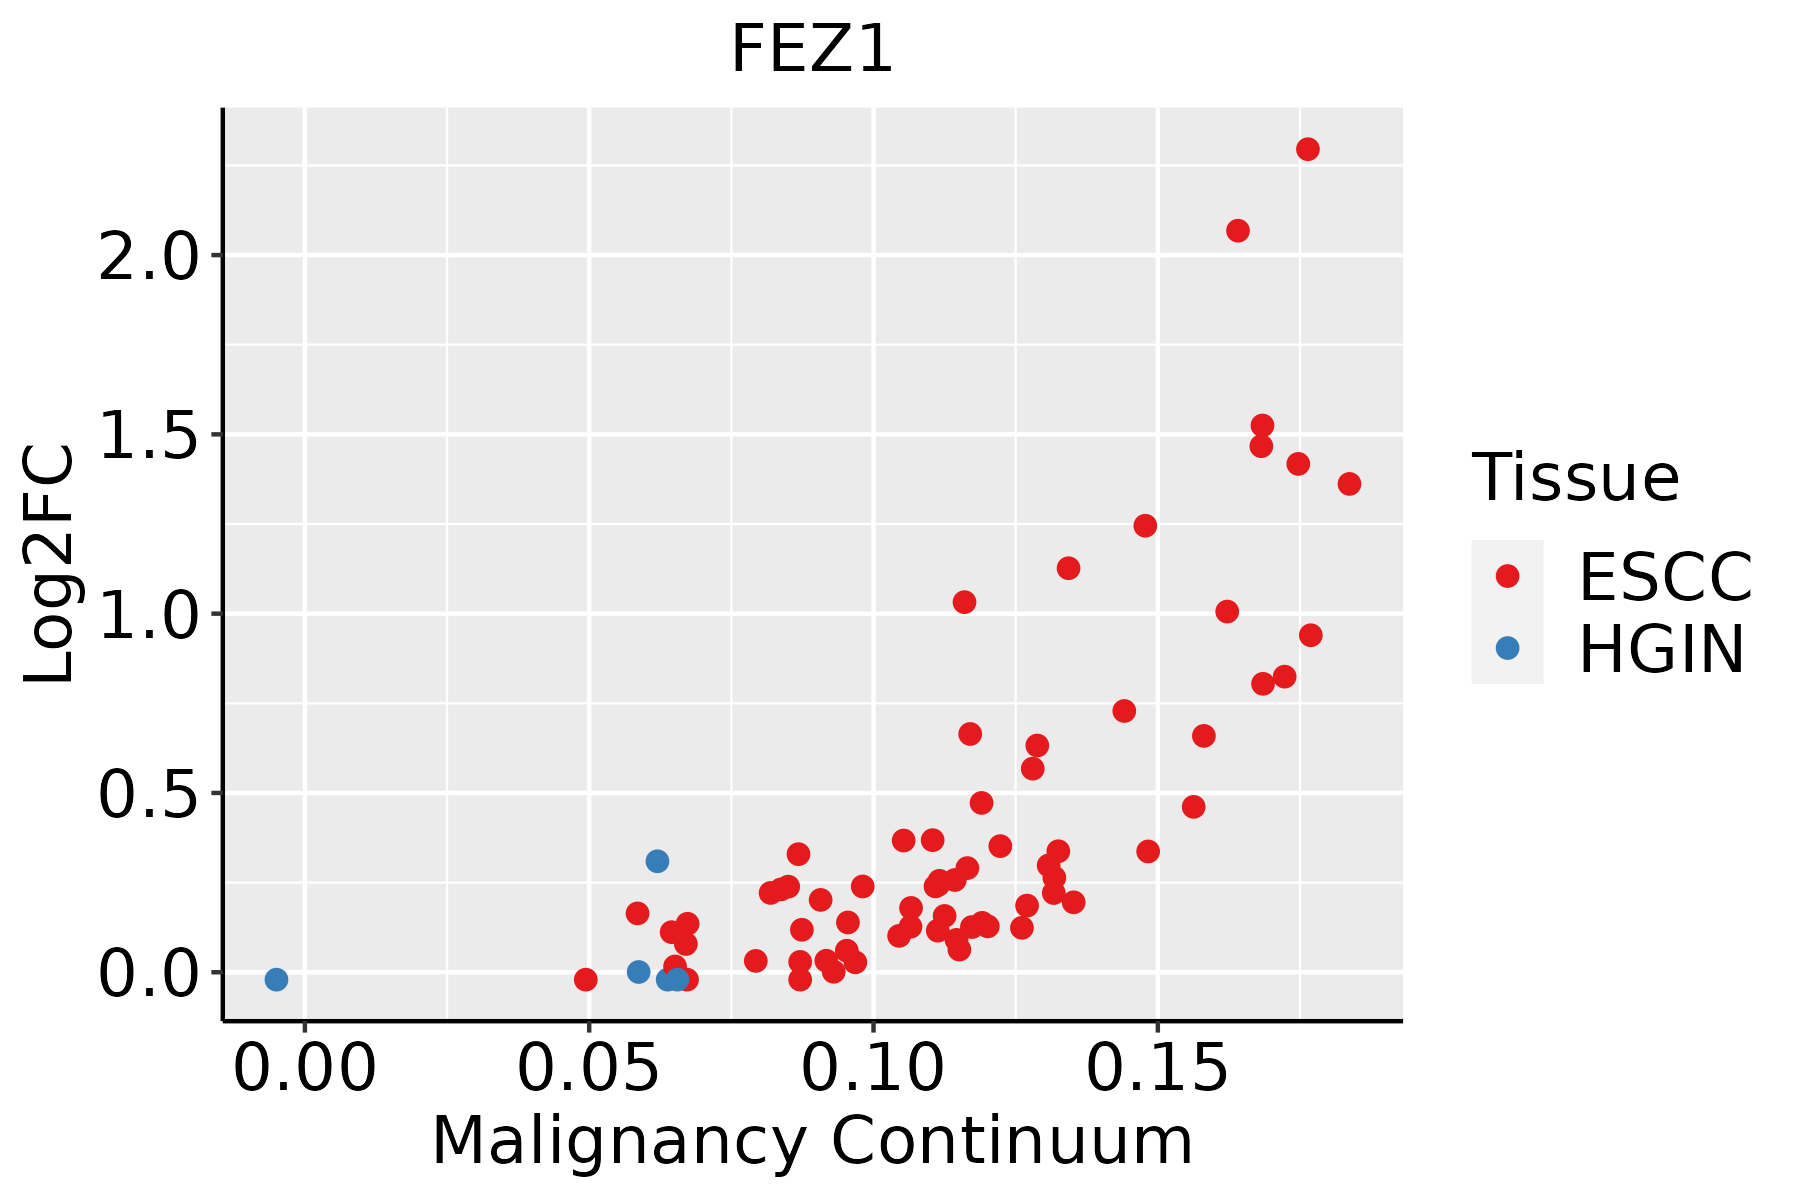 | ESCC: Esophageal squamous cell carcinoma |
| HGIN: High-grade intraepithelial neoplasias | ||
| LGIN: Low-grade intraepithelial neoplasias | ||
| Oral Cavity | 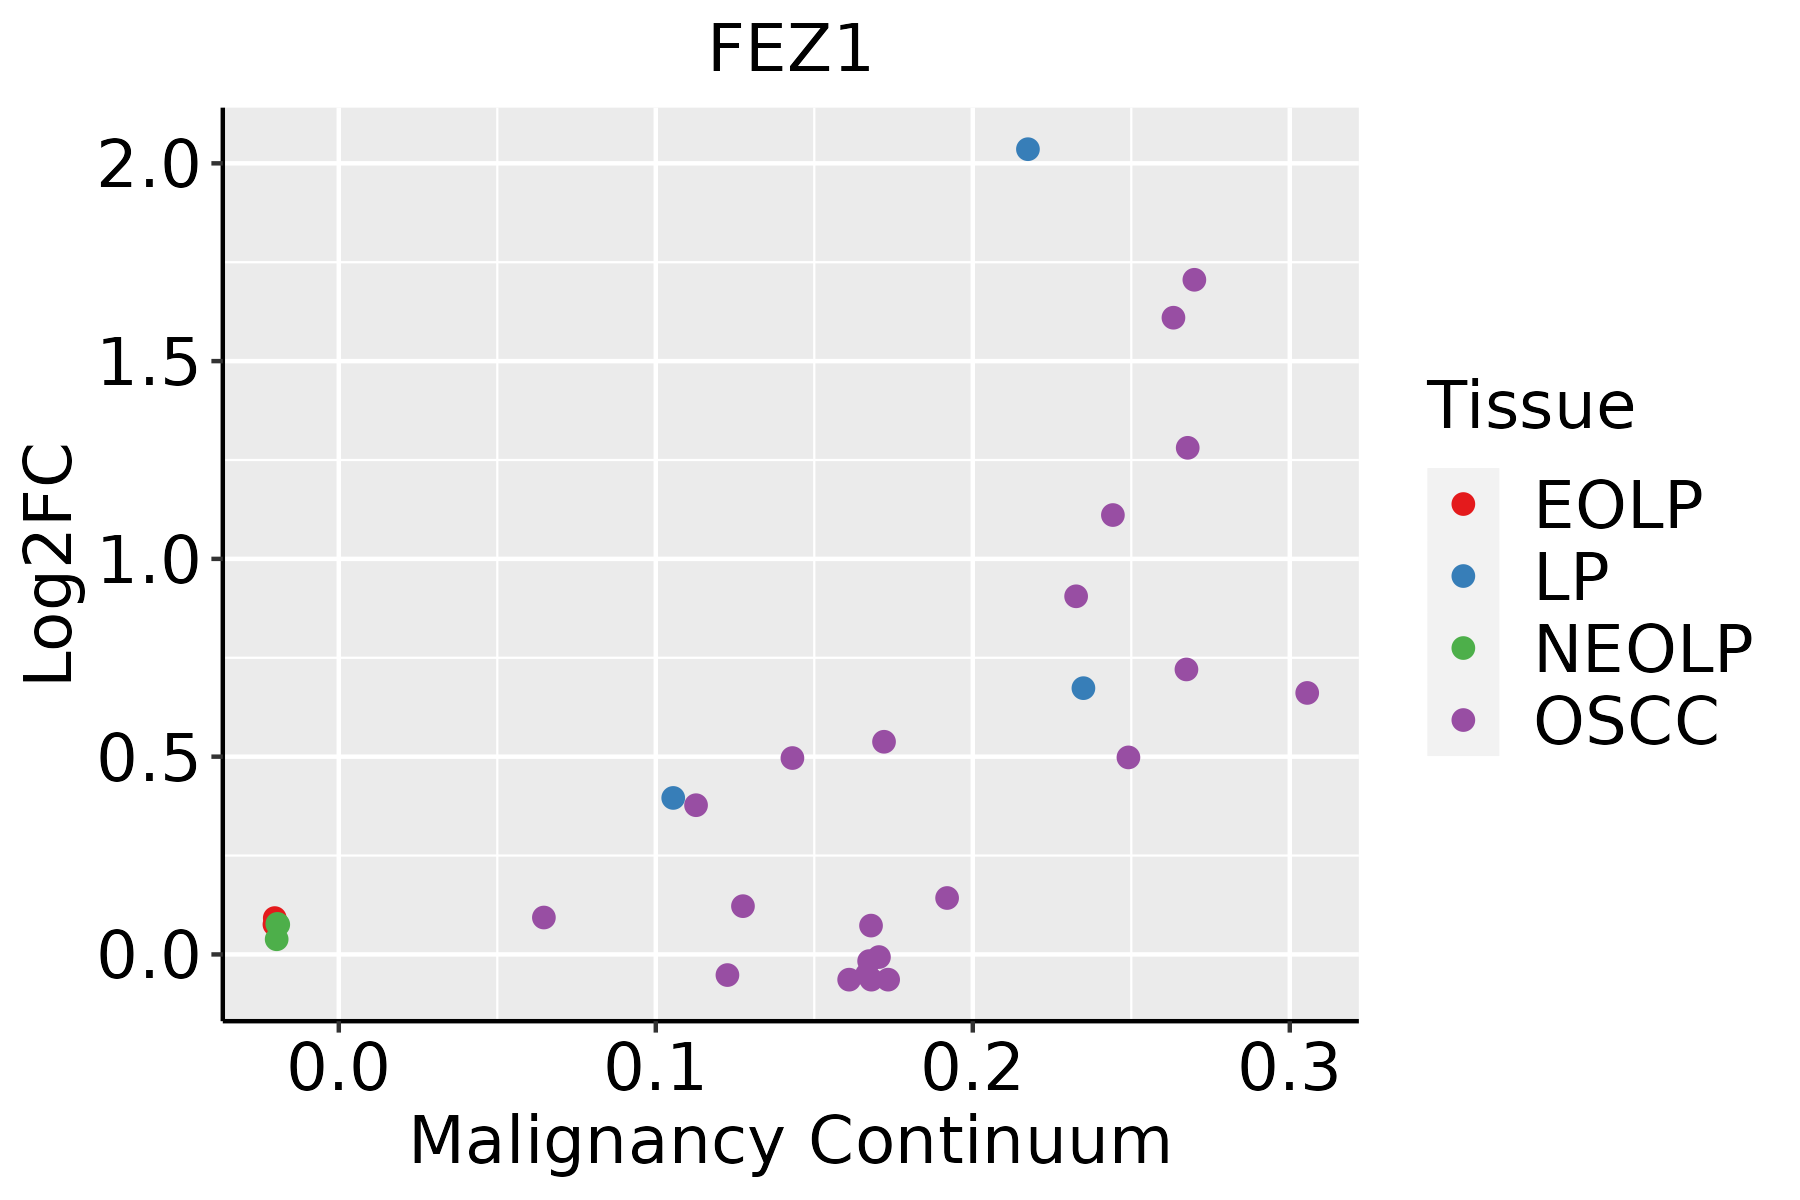 | EOLP: Erosive Oral lichen planus |
| LP: leukoplakia | ||
| NEOLP: Non-erosive oral lichen planus | ||
| OSCC: Oral squamous cell carcinoma | ||
| Skin | 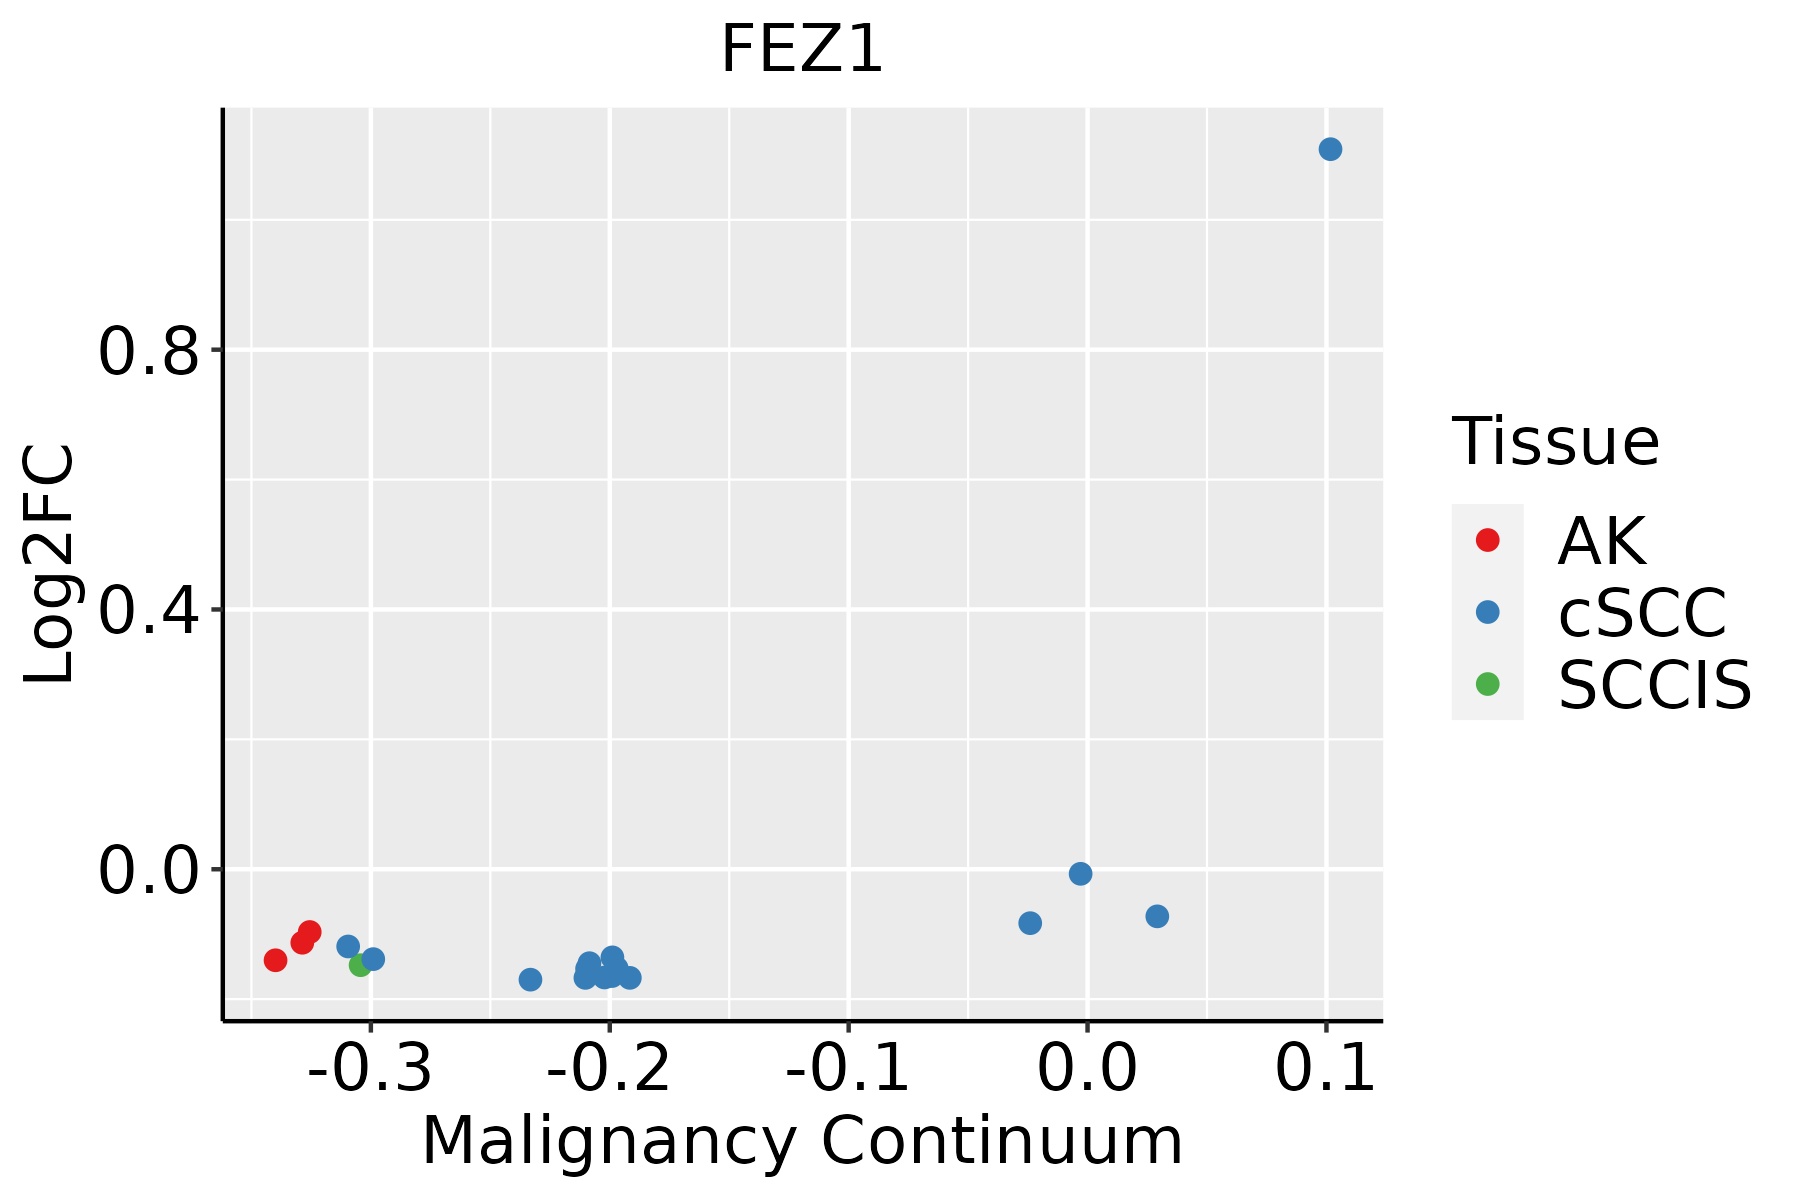 | AK: Actinic keratosis |
| cSCC: Cutaneous squamous cell carcinoma | ||
| SCCIS:squamous cell carcinoma in situ | ||
| Thyroid | 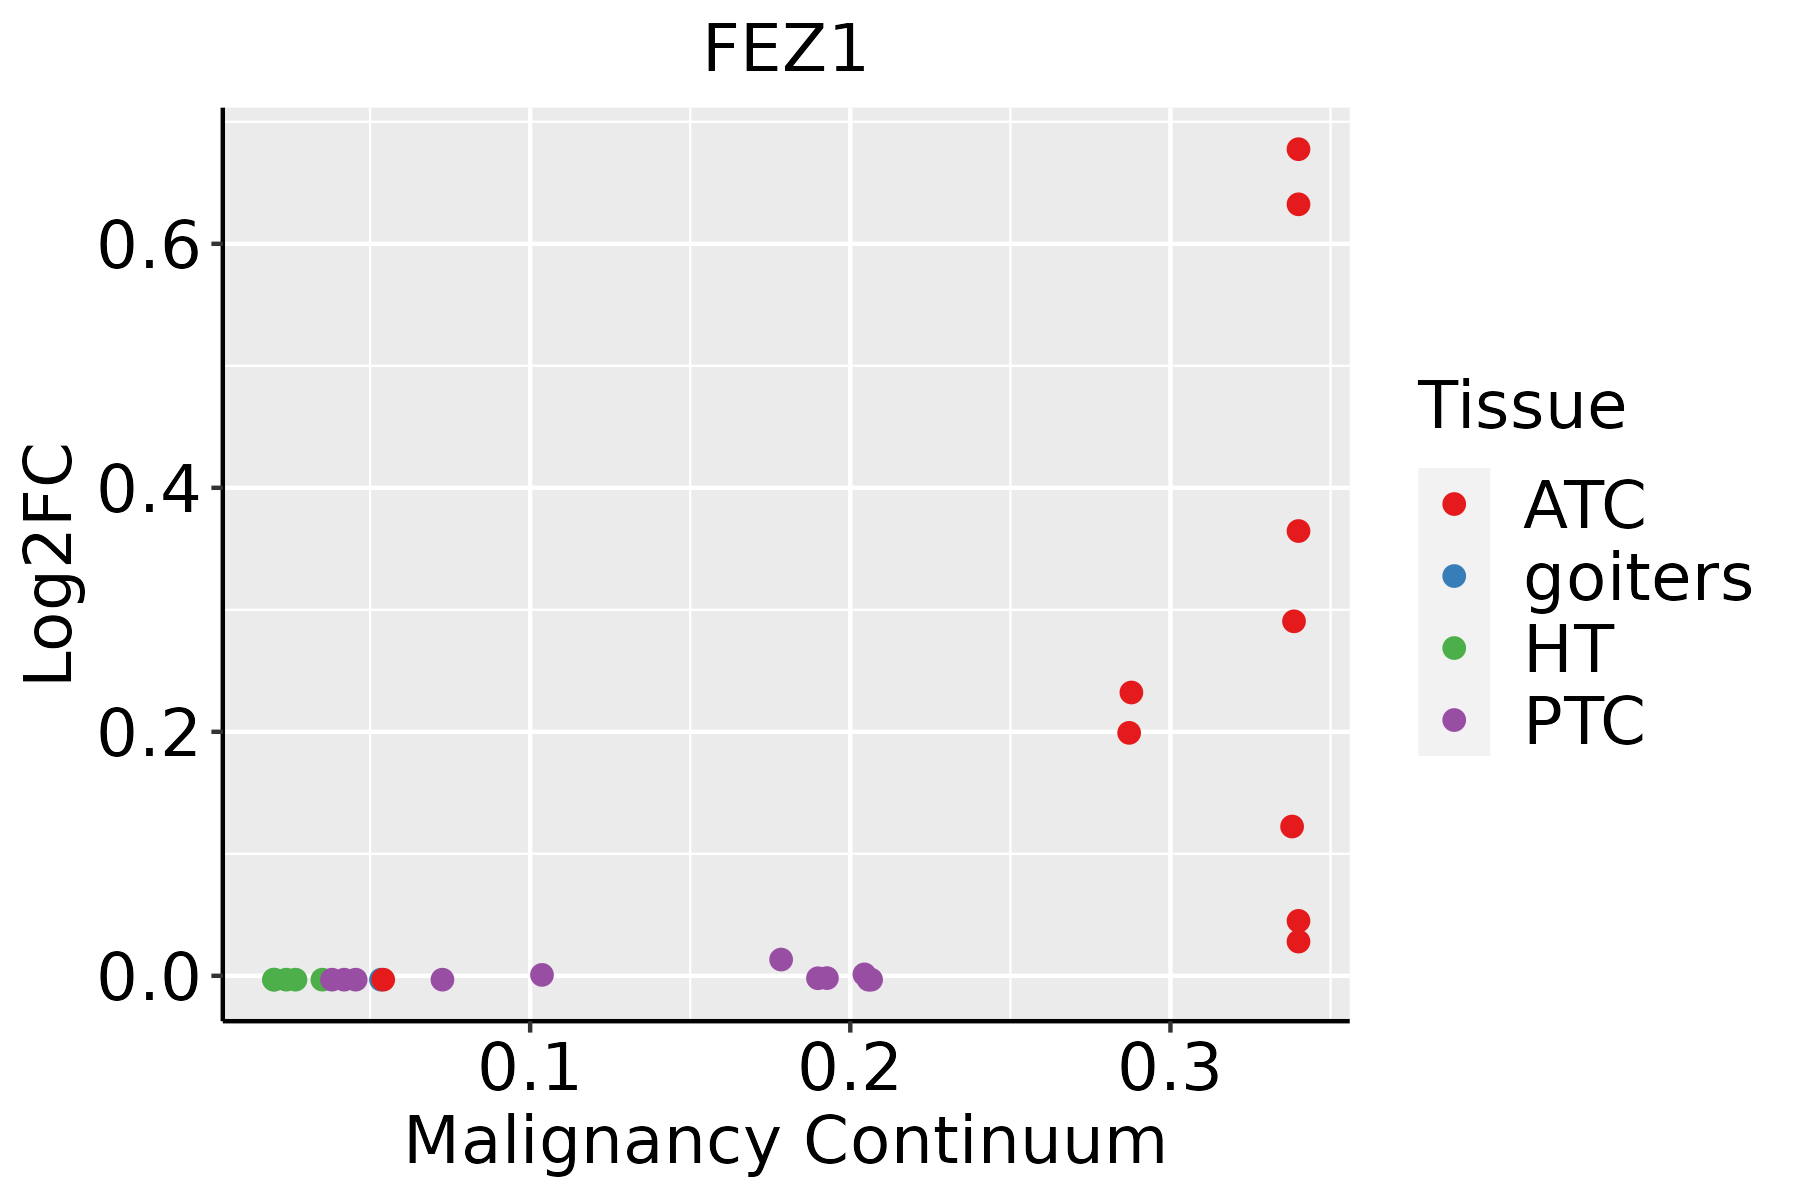 | ATC: Anaplastic thyroid cancer |
| HT: Hashimoto's thyroiditis | ||
| PTC: Papillary thyroid cancer |
| ∗log2FC in expression of this searched gene in stem-like cells from each diseased tissue sample relative to stem-like cells in normal samples in each tissue plotted against the malignancy continuum. Samples are colored based on if they are from different disease stage. |
Top |
Malignant transformation related pathway analysis |
| Find out the enriched GO biological processes and KEGG pathways involved in transition from healthy to precancer to cancer |
| Tissue | Disease Stage | Enriched GO biological Processes |
| Colorectum | AD |  |
| Colorectum | SER |  |
| Colorectum | MSS |  |
| Colorectum | MSI-H |  |
| Colorectum | FAP |  |
| ∗Top 15 enriched GO BP terms are showed in the bar plot of each disease state in each tissue. Each row represents a significant GO biological process which is colored according to the -log10(p.adjust). |
| Page: 1 2 3 4 5 6 7 8 9 |
| GO ID | Tissue | Disease Stage | Description | Gene Ratio | Bg Ratio | pvalue | p.adjust | Count |
| GO:001623617 | Esophagus | ESCC | macroautophagy | 216/8552 | 291/18723 | 1.94e-23 | 4.57e-21 | 216 |
| GO:003238618 | Esophagus | ESCC | regulation of intracellular transport | 243/8552 | 337/18723 | 3.20e-23 | 7.25e-21 | 243 |
| GO:005165617 | Esophagus | ESCC | establishment of organelle localization | 273/8552 | 390/18723 | 9.13e-23 | 1.81e-20 | 273 |
| GO:001050617 | Esophagus | ESCC | regulation of autophagy | 220/8552 | 317/18723 | 6.72e-18 | 6.36e-16 | 220 |
| GO:0032388110 | Esophagus | ESCC | positive regulation of intracellular transport | 152/8552 | 202/18723 | 7.89e-18 | 7.36e-16 | 152 |
| GO:000703314 | Esophagus | ESCC | vacuole organization | 127/8552 | 180/18723 | 1.04e-11 | 3.85e-10 | 127 |
| GO:001624114 | Esophagus | ESCC | regulation of macroautophagy | 102/8552 | 141/18723 | 1.09e-10 | 3.27e-09 | 102 |
| GO:003070518 | Esophagus | ESCC | cytoskeleton-dependent intracellular transport | 133/8552 | 195/18723 | 1.48e-10 | 4.27e-09 | 133 |
| GO:0009895111 | Esophagus | ESCC | negative regulation of catabolic process | 201/8552 | 320/18723 | 3.88e-10 | 1.05e-08 | 201 |
| GO:0010639110 | Esophagus | ESCC | negative regulation of organelle organization | 215/8552 | 348/18723 | 8.20e-10 | 2.01e-08 | 215 |
| GO:000716320 | Esophagus | ESCC | establishment or maintenance of cell polarity | 143/8552 | 218/18723 | 2.05e-09 | 4.65e-08 | 143 |
| GO:001097013 | Esophagus | ESCC | transport along microtubule | 107/8552 | 155/18723 | 3.17e-09 | 6.80e-08 | 107 |
| GO:0031330111 | Esophagus | ESCC | negative regulation of cellular catabolic process | 166/8552 | 262/18723 | 5.17e-09 | 1.08e-07 | 166 |
| GO:00723846 | Esophagus | ESCC | organelle transport along microtubule | 65/8552 | 85/18723 | 6.61e-09 | 1.35e-07 | 65 |
| GO:000808810 | Esophagus | ESCC | axo-dendritic transport | 58/8552 | 75/18723 | 2.09e-08 | 4.02e-07 | 58 |
| GO:003001018 | Esophagus | ESCC | establishment of cell polarity | 96/8552 | 143/18723 | 1.69e-07 | 2.67e-06 | 96 |
| GO:190503712 | Esophagus | ESCC | autophagosome organization | 73/8552 | 103/18723 | 1.88e-07 | 2.93e-06 | 73 |
| GO:00989304 | Esophagus | ESCC | axonal transport | 49/8552 | 64/18723 | 4.54e-07 | 6.15e-06 | 49 |
| GO:000004513 | Esophagus | ESCC | autophagosome assembly | 69/8552 | 99/18723 | 1.10e-06 | 1.38e-05 | 69 |
| GO:190211514 | Esophagus | ESCC | regulation of organelle assembly | 116/8552 | 186/18723 | 3.15e-06 | 3.53e-05 | 116 |
| Page: 1 2 3 4 5 6 7 8 9 |
| Pathway ID | Tissue | Disease Stage | Description | Gene Ratio | Bg Ratio | pvalue | p.adjust | qvalue | Count |
| hsa032509 | Esophagus | ESCC | Viral life cycle - HIV-1 | 54/4205 | 63/8465 | 2.01e-09 | 2.17e-08 | 1.11e-08 | 54 |
| hsa0325014 | Esophagus | ESCC | Viral life cycle - HIV-1 | 54/4205 | 63/8465 | 2.01e-09 | 2.17e-08 | 1.11e-08 | 54 |
| hsa032508 | Oral cavity | OSCC | Viral life cycle - HIV-1 | 45/3704 | 63/8465 | 7.62e-06 | 3.59e-05 | 1.83e-05 | 45 |
| hsa0325013 | Oral cavity | OSCC | Viral life cycle - HIV-1 | 45/3704 | 63/8465 | 7.62e-06 | 3.59e-05 | 1.83e-05 | 45 |
| hsa0325022 | Oral cavity | LP | Viral life cycle - HIV-1 | 32/2418 | 63/8465 | 1.55e-04 | 9.08e-04 | 5.86e-04 | 32 |
| hsa0325031 | Oral cavity | LP | Viral life cycle - HIV-1 | 32/2418 | 63/8465 | 1.55e-04 | 9.08e-04 | 5.86e-04 | 32 |
| Page: 1 |
Top |
Cell-cell communication analysis |
| Identification of potential cell-cell interactions between two cell types and their ligand-receptor pairs for different disease states |
| Ligand | Receptor | LRpair | Pathway | Tissue | Disease Stage |
| Page: 1 |
Top |
Single-cell gene regulatory network inference analysis |
| Find out the significant the regulons (TFs) and the target genes of each regulon across cell types for different disease states |
| TF | Cell Type | Tissue | Disease Stage | Target Gene | RSS | Regulon Activity |
| ∗The dot plots of a searched regulon are shown for all cell subpopulations in each disease state of each tissue based on the regulon specific score inferred using pySCENIC and by calculating the average expression. |
| Page: 1 |
Top |
Somatic mutation of malignant transformation related genes |
| Annotation of somatic variants for genes involved in malignant transformation |
| Hugo Symbol | Variant Class | Variant Classification | dbSNP RS | HGVSc | HGVSp | HGVSp Short | SWISSPROT | BIOTYPE | SIFT | PolyPhen | Tumor Sample Barcode | Tissue | Histology | Sex | Age | Stage | Therapy Types | Drugs | Outcome |
| FEZ1 | SNV | Missense_Mutation | c.353N>T | p.Ser118Leu | p.S118L | Q99689 | protein_coding | deleterious(0) | benign(0.042) | TCGA-A2-A0YK-01 | Breast | breast invasive carcinoma | Female | <65 | I/II | Chemotherapy | cytoxan | SD | |
| FEZ1 | SNV | Missense_Mutation | c.447G>C | p.Lys149Asn | p.K149N | Q99689 | protein_coding | deleterious(0.05) | possibly_damaging(0.834) | TCGA-AC-A23H-01 | Breast | breast invasive carcinoma | Female | >=65 | I/II | Unknown | Unknown | PD | |
| FEZ1 | SNV | Missense_Mutation | novel | c.970C>G | p.Leu324Val | p.L324V | Q99689 | protein_coding | tolerated(0.08) | benign(0.151) | TCGA-AC-A3W6-01 | Breast | breast invasive carcinoma | Female | >=65 | III/IV | Unknown | Unknown | SD |
| FEZ1 | SNV | Missense_Mutation | c.452N>C | p.Glu151Ala | p.E151A | Q99689 | protein_coding | deleterious(0.04) | possibly_damaging(0.554) | TCGA-BH-A1FU-01 | Breast | breast invasive carcinoma | Female | <65 | I/II | Unknown | Unknown | PD | |
| FEZ1 | SNV | Missense_Mutation | c.787N>C | p.Glu263Gln | p.E263Q | Q99689 | protein_coding | deleterious(0) | probably_damaging(0.998) | TCGA-DR-A0ZM-01 | Cervix | cervical & endocervical cancer | Female | <65 | III/IV | Unspecific | Cisplatin | SD | |
| FEZ1 | SNV | Missense_Mutation | rs770703429 | c.468N>G | p.Ile156Met | p.I156M | Q99689 | protein_coding | deleterious(0) | possibly_damaging(0.627) | TCGA-Q1-A5R2-01 | Cervix | cervical & endocervical cancer | Female | <65 | I/II | Chemotherapy | cisplatin | PR |
| FEZ1 | SNV | Missense_Mutation | c.365G>T | p.Arg122Met | p.R122M | Q99689 | protein_coding | tolerated(0.06) | benign(0.015) | TCGA-AA-3710-01 | Colorectum | colon adenocarcinoma | Female | >=65 | I/II | Unknown | Unknown | SD | |
| FEZ1 | SNV | Missense_Mutation | rs745432120 | c.655N>C | p.Trp219Arg | p.W219R | Q99689 | protein_coding | tolerated(0.25) | possibly_damaging(0.77) | TCGA-AA-3815-01 | Colorectum | colon adenocarcinoma | Female | >=65 | I/II | Unknown | Unknown | SD |
| FEZ1 | SNV | Missense_Mutation | c.1147G>A | p.Asp383Asn | p.D383N | Q99689 | protein_coding | deleterious(0.02) | probably_damaging(0.984) | TCGA-AA-A00N-01 | Colorectum | colon adenocarcinoma | Male | >=65 | I/II | Unknown | Unknown | PD | |
| FEZ1 | SNV | Missense_Mutation | c.510G>T | p.Glu170Asp | p.E170D | Q99689 | protein_coding | deleterious(0) | probably_damaging(0.992) | TCGA-AA-A00N-01 | Colorectum | colon adenocarcinoma | Male | >=65 | I/II | Unknown | Unknown | PD |
| Page: 1 2 3 4 5 6 |
Top |
Related drugs of malignant transformation related genes |
| Identification of chemicals and drugs interact with genes involved in malignant transfromation |
| (DGIdb 4.0) |
| Entrez ID | Symbol | Category | Interaction Types | Drug Claim Name | Drug Name | PMIDs |
| Page: 1 |

Copyright 2023-Present -The University of Texas Health Science Center at Houston |