
|
|||||
|
 | |
| |
| |
| |
| |
| |
|
Gene: FES |
Gene summary for FES |
| Gene information | Species | Human | Gene symbol | FES | Gene ID | 2242 |
| Gene name | FES proto-oncogene, tyrosine kinase | |
| Gene Alias | FPS | |
| Cytomap | 15q26.1 | |
| Gene Type | protein-coding | GO ID | GO:0000226 | UniProtAcc | P07332 |
Top |
Malignant transformation analysis |
| Identification of the aberrant gene expression in precancerous and cancerous lesions by comparing the gene expression of stem-like cells in diseased tissues with normal stem cells |
| Entrez ID | Symbol | Replicates | Species | Organ | Tissue | Adj P-value | Log2FC | Malignancy |
| 2242 | FES | LZE4T | Human | Esophagus | ESCC | 8.89e-07 | 1.48e-01 | 0.0811 |
| 2242 | FES | P2T-E | Human | Esophagus | ESCC | 5.23e-09 | 8.03e-02 | 0.1177 |
| 2242 | FES | P4T-E | Human | Esophagus | ESCC | 1.22e-40 | 9.00e-01 | 0.1323 |
| 2242 | FES | P8T-E | Human | Esophagus | ESCC | 2.34e-08 | 6.24e-02 | 0.0889 |
| 2242 | FES | P9T-E | Human | Esophagus | ESCC | 2.03e-04 | 1.48e-01 | 0.1131 |
| 2242 | FES | P10T-E | Human | Esophagus | ESCC | 1.45e-21 | 1.98e-01 | 0.116 |
| 2242 | FES | P12T-E | Human | Esophagus | ESCC | 3.94e-51 | 8.36e-01 | 0.1122 |
| 2242 | FES | P16T-E | Human | Esophagus | ESCC | 5.24e-08 | 1.54e-01 | 0.1153 |
| 2242 | FES | P26T-E | Human | Esophagus | ESCC | 7.31e-21 | 5.06e-01 | 0.1276 |
| 2242 | FES | P27T-E | Human | Esophagus | ESCC | 1.05e-32 | 5.26e-01 | 0.1055 |
| 2242 | FES | P28T-E | Human | Esophagus | ESCC | 2.34e-47 | 9.01e-01 | 0.1149 |
| 2242 | FES | P32T-E | Human | Esophagus | ESCC | 1.36e-02 | -6.87e-04 | 0.1666 |
| 2242 | FES | P37T-E | Human | Esophagus | ESCC | 1.06e-06 | 1.30e-01 | 0.1371 |
| 2242 | FES | P38T-E | Human | Esophagus | ESCC | 1.17e-03 | 1.41e-01 | 0.127 |
| 2242 | FES | P39T-E | Human | Esophagus | ESCC | 3.65e-12 | 1.09e-01 | 0.0894 |
| 2242 | FES | P44T-E | Human | Esophagus | ESCC | 1.85e-05 | 1.30e-01 | 0.1096 |
| 2242 | FES | P52T-E | Human | Esophagus | ESCC | 1.61e-06 | 2.52e-02 | 0.1555 |
| 2242 | FES | P57T-E | Human | Esophagus | ESCC | 8.71e-10 | 1.26e-01 | 0.0926 |
| 2242 | FES | P65T-E | Human | Esophagus | ESCC | 2.29e-04 | 5.55e-02 | 0.0978 |
| 2242 | FES | P74T-E | Human | Esophagus | ESCC | 2.00e-09 | 2.13e-01 | 0.1479 |
| Page: 1 2 |
| Tissue | Expression Dynamics | Abbreviation |
| Esophagus | 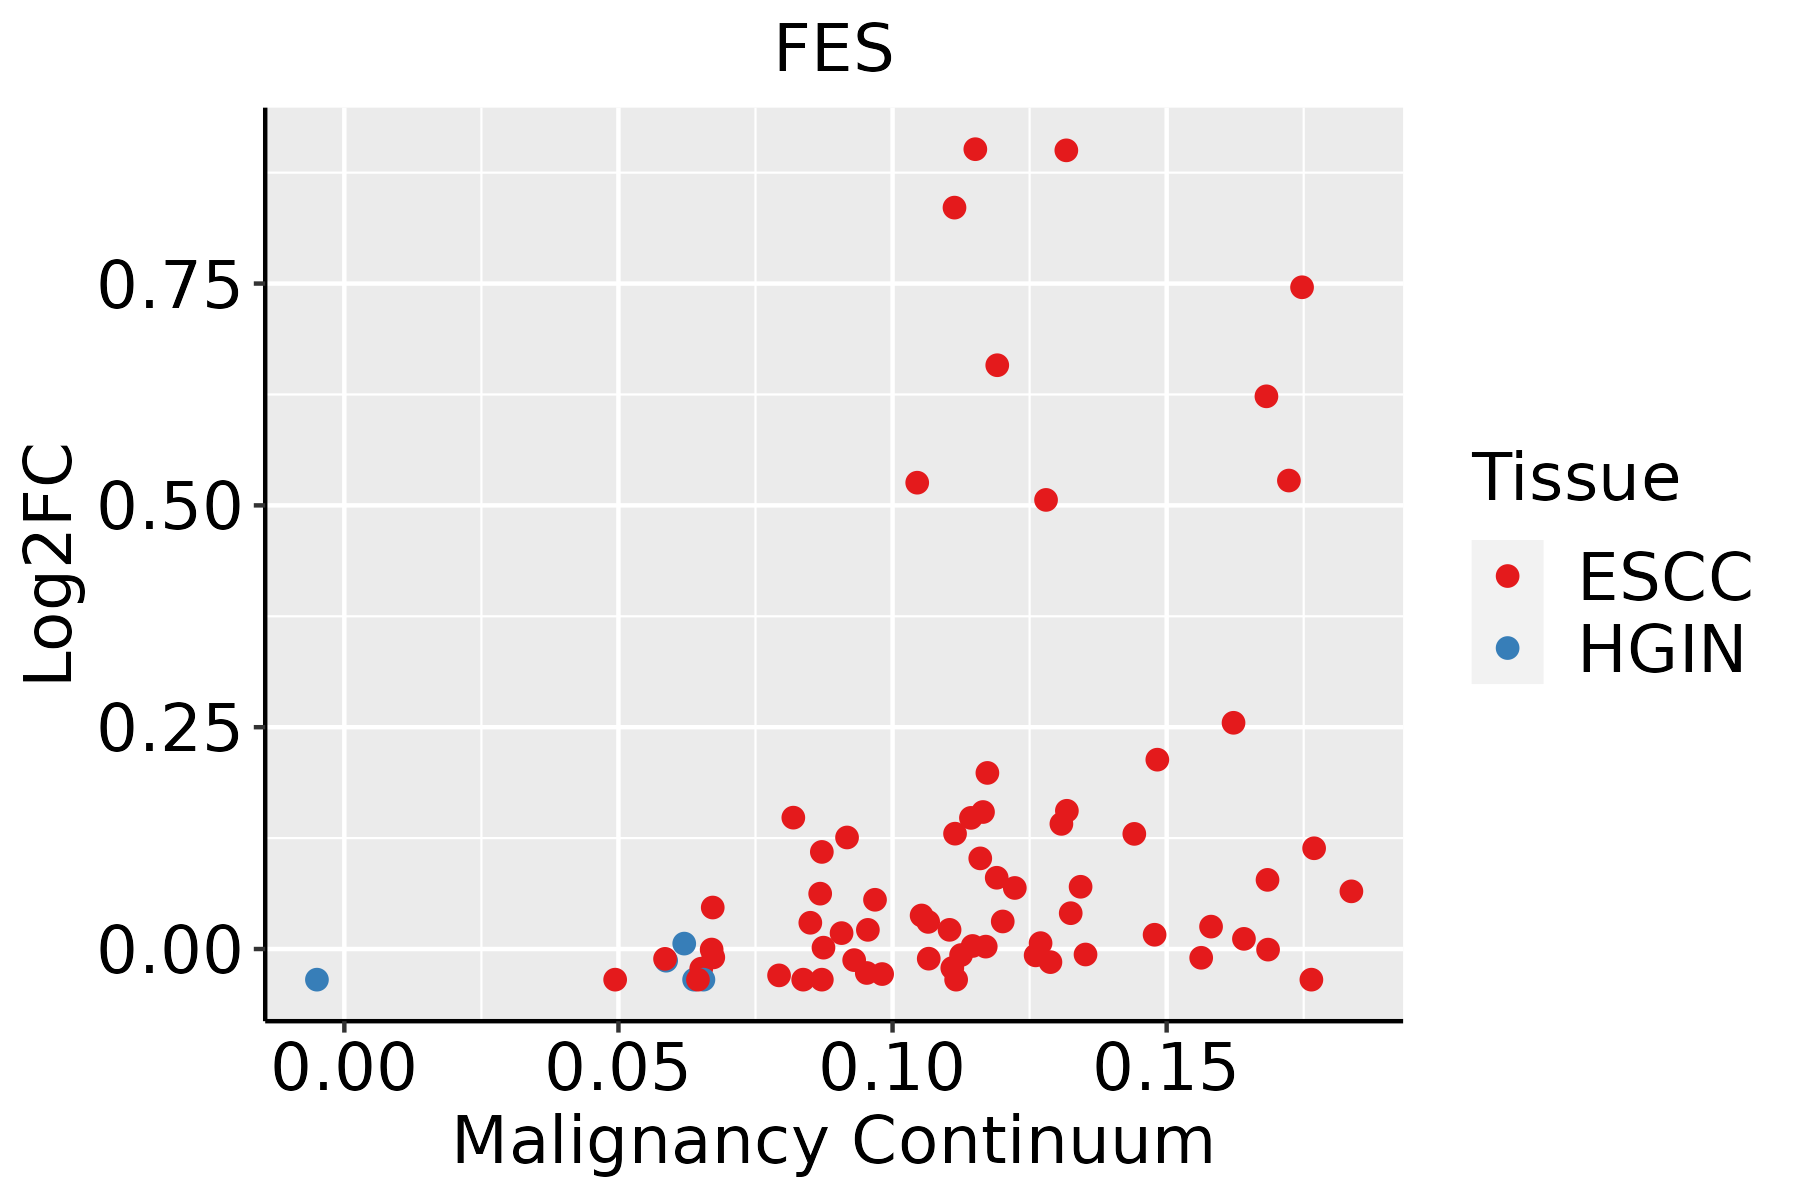 | ESCC: Esophageal squamous cell carcinoma |
| HGIN: High-grade intraepithelial neoplasias | ||
| LGIN: Low-grade intraepithelial neoplasias |
| ∗log2FC in expression of this searched gene in stem-like cells from each diseased tissue sample relative to stem-like cells in normal samples in each tissue plotted against the malignancy continuum. Samples are colored based on if they are from different disease stage. |
Top |
Malignant transformation related pathway analysis |
| Find out the enriched GO biological processes and KEGG pathways involved in transition from healthy to precancer to cancer |
| Tissue | Disease Stage | Enriched GO biological Processes |
| Colorectum | AD |  |
| Colorectum | SER |  |
| Colorectum | MSS |  |
| Colorectum | MSI-H |  |
| Colorectum | FAP |  |
| ∗Top 15 enriched GO BP terms are showed in the bar plot of each disease state in each tissue. Each row represents a significant GO biological process which is colored according to the -log10(p.adjust). |
| Page: 1 2 3 4 5 6 7 8 9 |
| GO ID | Tissue | Disease Stage | Description | Gene Ratio | Bg Ratio | pvalue | p.adjust | Count |
| GO:005165617 | Esophagus | ESCC | establishment of organelle localization | 273/8552 | 390/18723 | 9.13e-23 | 1.81e-20 | 273 |
| GO:0043254111 | Esophagus | ESCC | regulation of protein-containing complex assembly | 278/8552 | 428/18723 | 3.81e-16 | 2.77e-14 | 278 |
| GO:0071496111 | Esophagus | ESCC | cellular response to external stimulus | 215/8552 | 320/18723 | 4.29e-15 | 2.43e-13 | 215 |
| GO:0031334111 | Esophagus | ESCC | positive regulation of protein-containing complex assembly | 166/8552 | 237/18723 | 2.06e-14 | 1.07e-12 | 166 |
| GO:0031668111 | Esophagus | ESCC | cellular response to extracellular stimulus | 168/8552 | 246/18723 | 4.93e-13 | 2.23e-11 | 168 |
| GO:0031669110 | Esophagus | ESCC | cellular response to nutrient levels | 148/8552 | 215/18723 | 4.58e-12 | 1.76e-10 | 148 |
| GO:0031667111 | Esophagus | ESCC | response to nutrient levels | 289/8552 | 474/18723 | 9.25e-12 | 3.47e-10 | 289 |
| GO:1902905111 | Esophagus | ESCC | positive regulation of supramolecular fiber organization | 142/8552 | 209/18723 | 5.51e-11 | 1.76e-09 | 142 |
| GO:1902903111 | Esophagus | ESCC | regulation of supramolecular fiber organization | 237/8552 | 383/18723 | 9.06e-11 | 2.75e-09 | 237 |
| GO:0030099111 | Esophagus | ESCC | myeloid cell differentiation | 232/8552 | 381/18723 | 1.22e-09 | 2.90e-08 | 232 |
| GO:005149520 | Esophagus | ESCC | positive regulation of cytoskeleton organization | 147/8552 | 226/18723 | 2.93e-09 | 6.38e-08 | 147 |
| GO:0051258111 | Esophagus | ESCC | protein polymerization | 183/8552 | 297/18723 | 1.94e-08 | 3.75e-07 | 183 |
| GO:0032273111 | Esophagus | ESCC | positive regulation of protein polymerization | 95/8552 | 138/18723 | 2.97e-08 | 5.57e-07 | 95 |
| GO:000758410 | Esophagus | ESCC | response to nutrient | 114/8552 | 174/18723 | 9.43e-08 | 1.56e-06 | 114 |
| GO:00705078 | Esophagus | ESCC | regulation of microtubule cytoskeleton organization | 99/8552 | 148/18723 | 1.43e-07 | 2.29e-06 | 99 |
| GO:0032970111 | Esophagus | ESCC | regulation of actin filament-based process | 231/8552 | 397/18723 | 2.91e-07 | 4.20e-06 | 231 |
| GO:0032956111 | Esophagus | ESCC | regulation of actin cytoskeleton organization | 210/8552 | 358/18723 | 4.40e-07 | 6.00e-06 | 210 |
| GO:0032271111 | Esophagus | ESCC | regulation of protein polymerization | 143/8552 | 233/18723 | 9.21e-07 | 1.17e-05 | 143 |
| GO:000257317 | Esophagus | ESCC | myeloid leukocyte differentiation | 128/8552 | 208/18723 | 2.75e-06 | 3.15e-05 | 128 |
| GO:004677710 | Esophagus | ESCC | protein autophosphorylation | 138/8552 | 227/18723 | 2.98e-06 | 3.38e-05 | 138 |
| Page: 1 2 3 |
| Pathway ID | Tissue | Disease Stage | Description | Gene Ratio | Bg Ratio | pvalue | p.adjust | qvalue | Count |
| hsa0436016 | Esophagus | ESCC | Axon guidance | 108/4205 | 182/8465 | 5.13e-03 | 1.30e-02 | 6.67e-03 | 108 |
| hsa0436017 | Esophagus | ESCC | Axon guidance | 108/4205 | 182/8465 | 5.13e-03 | 1.30e-02 | 6.67e-03 | 108 |
| Page: 1 |
Top |
Cell-cell communication analysis |
| Identification of potential cell-cell interactions between two cell types and their ligand-receptor pairs for different disease states |
| Ligand | Receptor | LRpair | Pathway | Tissue | Disease Stage |
| Page: 1 |
Top |
Single-cell gene regulatory network inference analysis |
| Find out the significant the regulons (TFs) and the target genes of each regulon across cell types for different disease states |
| TF | Cell Type | Tissue | Disease Stage | Target Gene | RSS | Regulon Activity |
| ∗The dot plots of a searched regulon are shown for all cell subpopulations in each disease state of each tissue based on the regulon specific score inferred using pySCENIC and by calculating the average expression. |
| Page: 1 |
Top |
Somatic mutation of malignant transformation related genes |
| Annotation of somatic variants for genes involved in malignant transformation |
| Hugo Symbol | Variant Class | Variant Classification | dbSNP RS | HGVSc | HGVSp | HGVSp Short | SWISSPROT | BIOTYPE | SIFT | PolyPhen | Tumor Sample Barcode | Tissue | Histology | Sex | Age | Stage | Therapy Types | Drugs | Outcome |
| FES | SNV | Missense_Mutation | novel | c.914N>T | p.Ser305Ile | p.S305I | P07332 | protein_coding | deleterious(0.01) | benign(0.255) | TCGA-A2-A0CK-01 | Breast | breast invasive carcinoma | Female | <65 | III/IV | Chemotherapy | taxotere | CR |
| FES | SNV | Missense_Mutation | c.1873G>T | p.Val625Phe | p.V625F | P07332 | protein_coding | deleterious(0) | probably_damaging(0.996) | TCGA-B6-A0RM-01 | Breast | breast invasive carcinoma | Female | <65 | I/II | Unknown | Unknown | SD | |
| FES | SNV | Missense_Mutation | c.2159N>T | p.Arg720Ile | p.R720I | P07332 | protein_coding | deleterious(0) | possibly_damaging(0.86) | TCGA-BH-A18G-01 | Breast | breast invasive carcinoma | Female | >=65 | I/II | Unknown | Unknown | SD | |
| FES | SNV | Missense_Mutation | c.2040N>G | p.Ile680Met | p.I680M | P07332 | protein_coding | deleterious(0) | probably_damaging(1) | TCGA-C8-A12K-01 | Breast | breast invasive carcinoma | Female | >=65 | I/II | Unknown | Unknown | SD | |
| FES | SNV | Missense_Mutation | c.2049N>A | p.Asp683Glu | p.D683E | P07332 | protein_coding | deleterious(0) | probably_damaging(0.998) | TCGA-E2-A15G-01 | Breast | breast invasive carcinoma | Female | >=65 | I/II | Hormone Therapy | arimidex | SD | |
| FES | SNV | Missense_Mutation | rs765947794 | c.811G>A | p.Ala271Thr | p.A271T | P07332 | protein_coding | tolerated(0.6) | benign(0) | TCGA-GM-A2D9-01 | Breast | breast invasive carcinoma | Female | >=65 | I/II | Hormone Therapy | arimidex | SD |
| FES | SNV | Missense_Mutation | rs575070040 | c.1256N>A | p.Gly419Glu | p.G419E | P07332 | protein_coding | tolerated(0.18) | possibly_damaging(0.482) | TCGA-EK-A2RC-01 | Cervix | cervical & endocervical cancer | Female | <65 | I/II | Unknown | Unknown | SD |
| FES | deletion | Frame_Shift_Del | novel | c.2038delN | p.Ile680SerfsTer12 | p.I680Sfs*12 | P07332 | protein_coding | TCGA-DS-A1OB-01 | Cervix | cervical & endocervical cancer | Female | <65 | I/II | Chemotherapy | carboplatin | PD | ||
| FES | SNV | Missense_Mutation | rs201771040 | c.520N>T | p.Arg174Cys | p.R174C | P07332 | protein_coding | deleterious(0) | possibly_damaging(0.518) | TCGA-AA-3492-01 | Colorectum | colon adenocarcinoma | Female | >=65 | I/II | Unknown | Unknown | SD |
| FES | SNV | Missense_Mutation | c.1933N>A | p.Leu645Met | p.L645M | P07332 | protein_coding | deleterious(0) | probably_damaging(0.993) | TCGA-AD-6889-01 | Colorectum | colon adenocarcinoma | Male | >=65 | I/II | Chemotherapy | xeloda | PD |
| Page: 1 2 3 4 5 6 7 |
Top |
Related drugs of malignant transformation related genes |
| Identification of chemicals and drugs interact with genes involved in malignant transfromation |
| (DGIdb 4.0) |
| Entrez ID | Symbol | Category | Interaction Types | Drug Claim Name | Drug Name | PMIDs |
| 2242 | FES | ENZYME, DRUGGABLE GENOME, KINASE, TYROSINE KINASE | inhibitor | 249565819 | ||
| 2242 | FES | ENZYME, DRUGGABLE GENOME, KINASE, TYROSINE KINASE | inhibitor | 249565817 | ||
| 2242 | FES | ENZYME, DRUGGABLE GENOME, KINASE, TYROSINE KINASE | inhibitor | HESPERADIN | HESPERADIN | 19035792 |
| 2242 | FES | ENZYME, DRUGGABLE GENOME, KINASE, TYROSINE KINASE | inhibitor | 187051779 | LORLATINIB | |
| 2242 | FES | ENZYME, DRUGGABLE GENOME, KINASE, TYROSINE KINASE | LINIFANIB | LINIFANIB | ||
| 2242 | FES | ENZYME, DRUGGABLE GENOME, KINASE, TYROSINE KINASE | SP-600125 | SP-600125 | ||
| 2242 | FES | ENZYME, DRUGGABLE GENOME, KINASE, TYROSINE KINASE | DASATINIB | DASATINIB |
| Page: 1 |

Copyright 2023-Present -The University of Texas Health Science Center at Houston |