
|
|||||
|
 | |
| |
| |
| |
| |
| |
|
Gene: FERMT1 |
Gene summary for FERMT1 |
| Gene information | Species | Human | Gene symbol | FERMT1 | Gene ID | 55612 |
| Gene name | FERM domain containing kindlin 1 | |
| Gene Alias | C20orf42 | |
| Cytomap | 20p12.3 | |
| Gene Type | protein-coding | GO ID | GO:0001667 | UniProtAcc | Q49AC8 |
Top |
Malignant transformation analysis |
| Identification of the aberrant gene expression in precancerous and cancerous lesions by comparing the gene expression of stem-like cells in diseased tissues with normal stem cells |
| Entrez ID | Symbol | Replicates | Species | Organ | Tissue | Adj P-value | Log2FC | Malignancy |
| 55612 | FERMT1 | CA_HPV_1 | Human | Cervix | CC | 5.04e-03 | -1.92e-01 | 0.0264 |
| 55612 | FERMT1 | CA_HPV_3 | Human | Cervix | CC | 1.01e-09 | 2.31e-01 | 0.0414 |
| 55612 | FERMT1 | CCI_3 | Human | Cervix | CC | 4.32e-02 | 4.23e-01 | 0.516 |
| 55612 | FERMT1 | Tumor | Human | Cervix | CC | 1.52e-11 | 3.64e-01 | 0.1241 |
| 55612 | FERMT1 | sample3 | Human | Cervix | CC | 2.91e-24 | 5.17e-01 | 0.1387 |
| 55612 | FERMT1 | T3 | Human | Cervix | CC | 1.55e-20 | 5.01e-01 | 0.1389 |
| 55612 | FERMT1 | HTA11_1938_2000001011 | Human | Colorectum | AD | 2.33e-12 | 9.55e-01 | -0.0811 |
| 55612 | FERMT1 | HTA11_78_2000001011 | Human | Colorectum | AD | 9.53e-03 | 4.89e-01 | -0.1088 |
| 55612 | FERMT1 | HTA11_347_2000001011 | Human | Colorectum | AD | 9.58e-06 | 5.02e-01 | -0.1954 |
| 55612 | FERMT1 | HTA11_411_2000001011 | Human | Colorectum | SER | 4.03e-02 | 7.19e-01 | -0.2602 |
| 55612 | FERMT1 | HTA11_1391_2000001011 | Human | Colorectum | AD | 2.11e-11 | 1.03e+00 | -0.059 |
| 55612 | FERMT1 | HTA11_866_3004761011 | Human | Colorectum | AD | 8.29e-31 | 1.39e+00 | 0.096 |
| 55612 | FERMT1 | HTA11_7663_2000001011 | Human | Colorectum | SER | 1.02e-08 | 9.33e-01 | 0.0131 |
| 55612 | FERMT1 | HTA11_10711_2000001011 | Human | Colorectum | AD | 3.45e-06 | 7.31e-01 | 0.0338 |
| 55612 | FERMT1 | HTA11_7696_3000711011 | Human | Colorectum | AD | 8.08e-15 | 8.15e-01 | 0.0674 |
| 55612 | FERMT1 | HTA11_6818_2000001021 | Human | Colorectum | AD | 4.34e-25 | 1.38e+00 | 0.0588 |
| 55612 | FERMT1 | HTA11_99999970781_79442 | Human | Colorectum | MSS | 3.22e-10 | 6.88e-01 | 0.294 |
| 55612 | FERMT1 | HTA11_99999965104_69814 | Human | Colorectum | MSS | 5.30e-07 | 6.89e-01 | 0.281 |
| 55612 | FERMT1 | HTA11_99999971662_82457 | Human | Colorectum | MSS | 9.70e-06 | 6.70e-01 | 0.3859 |
| 55612 | FERMT1 | A002-C-010 | Human | Colorectum | FAP | 8.13e-04 | 2.75e-01 | 0.242 |
| Page: 1 2 3 4 5 6 7 8 9 |
| Tissue | Expression Dynamics | Abbreviation |
| Cervix | 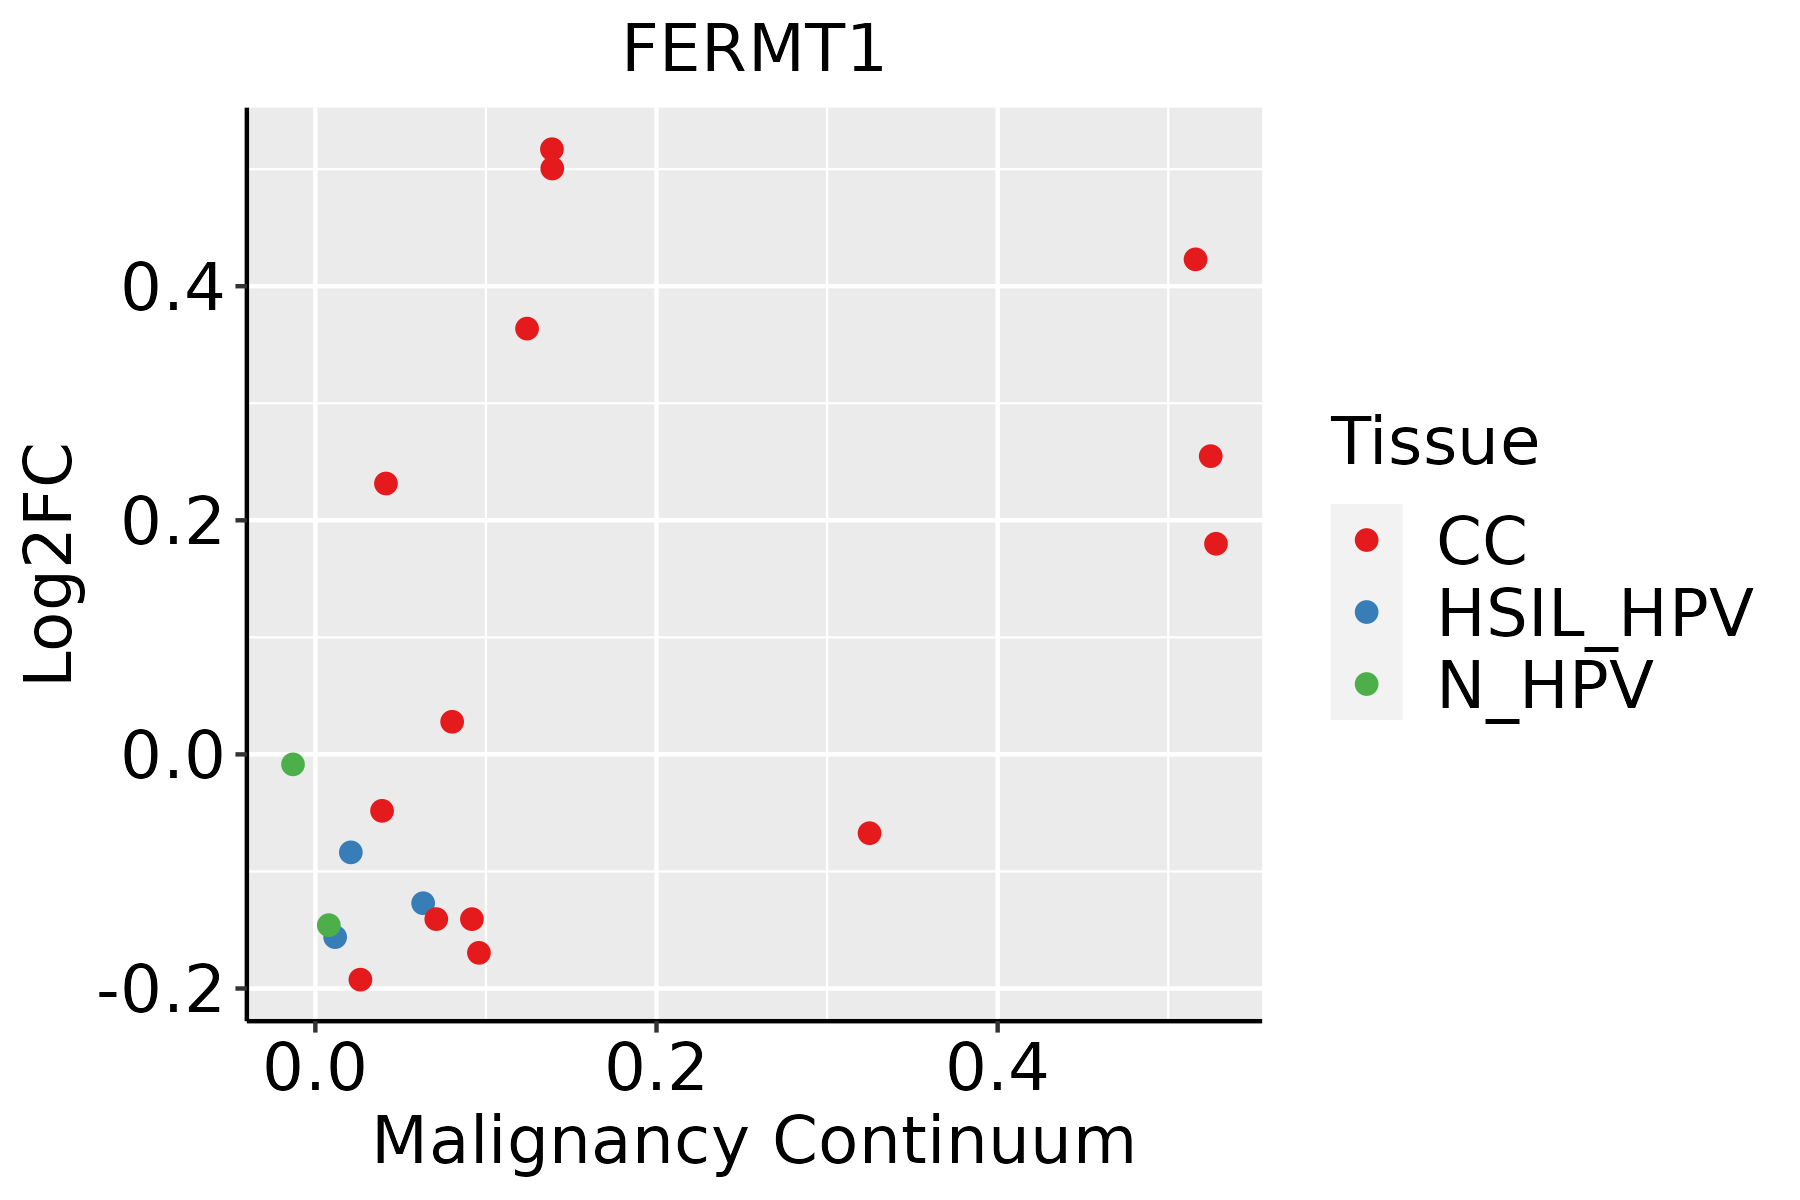 | CC: Cervix cancer |
| HSIL_HPV: HPV-infected high-grade squamous intraepithelial lesions | ||
| N_HPV: HPV-infected normal cervix | ||
| Colorectum (GSE201348) | 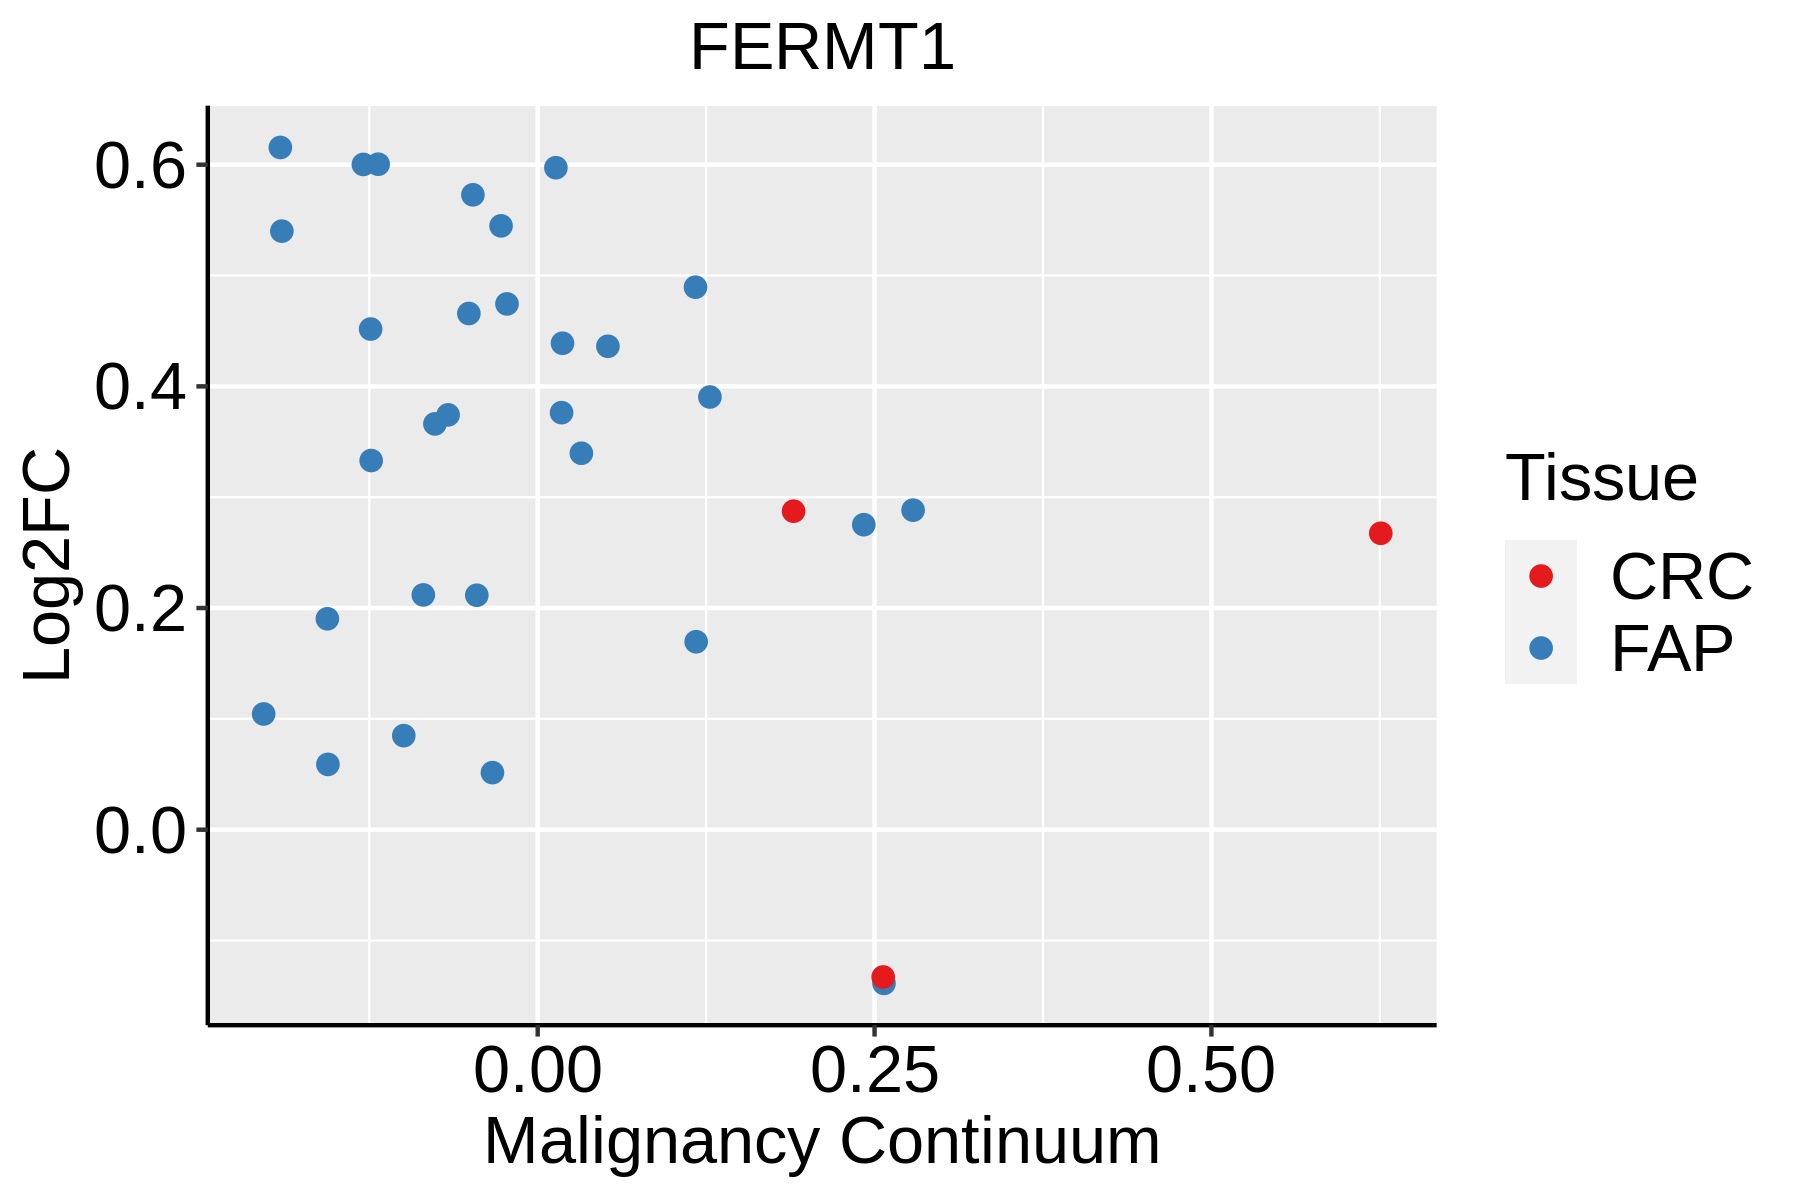 | FAP: Familial adenomatous polyposis |
| CRC: Colorectal cancer | ||
| Colorectum (HTA11) | 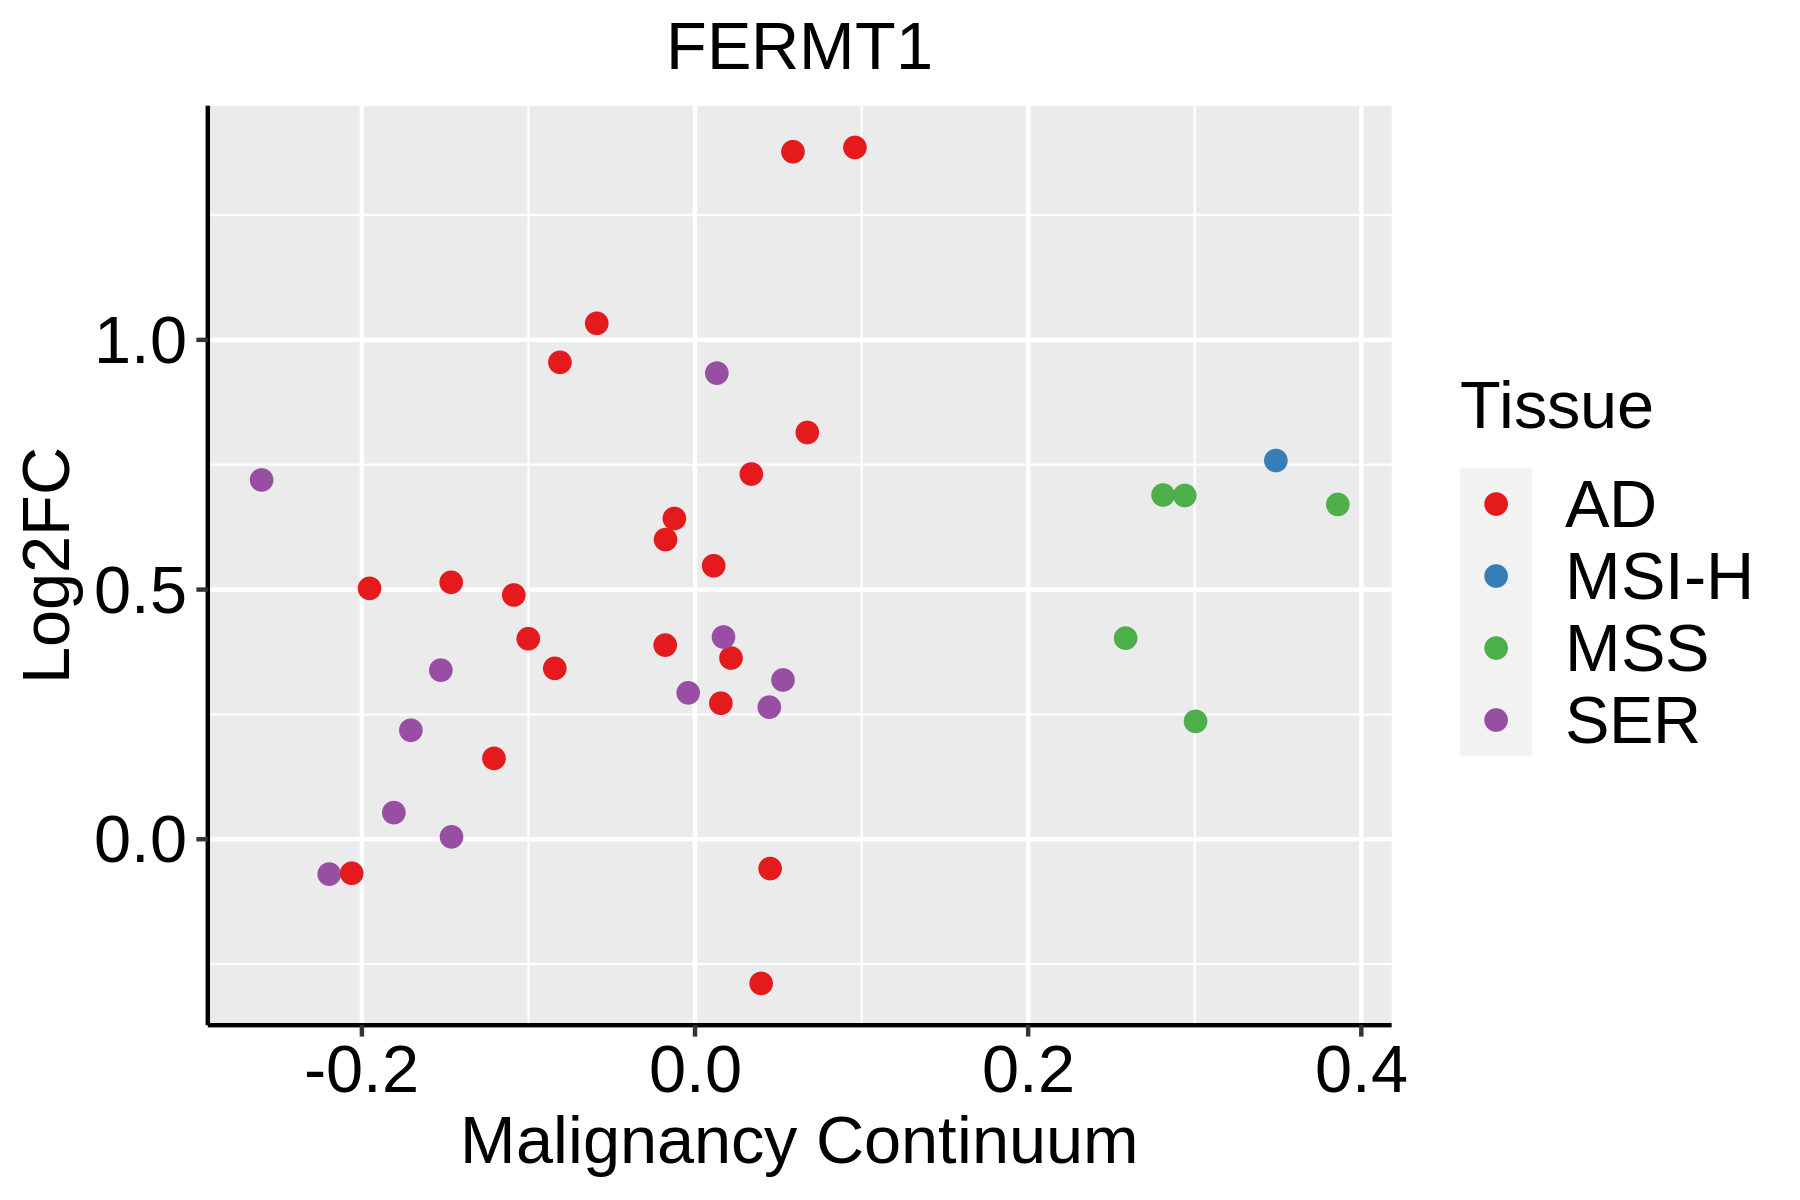 | AD: Adenomas |
| SER: Sessile serrated lesions | ||
| MSI-H: Microsatellite-high colorectal cancer | ||
| MSS: Microsatellite stable colorectal cancer | ||
| Esophagus | 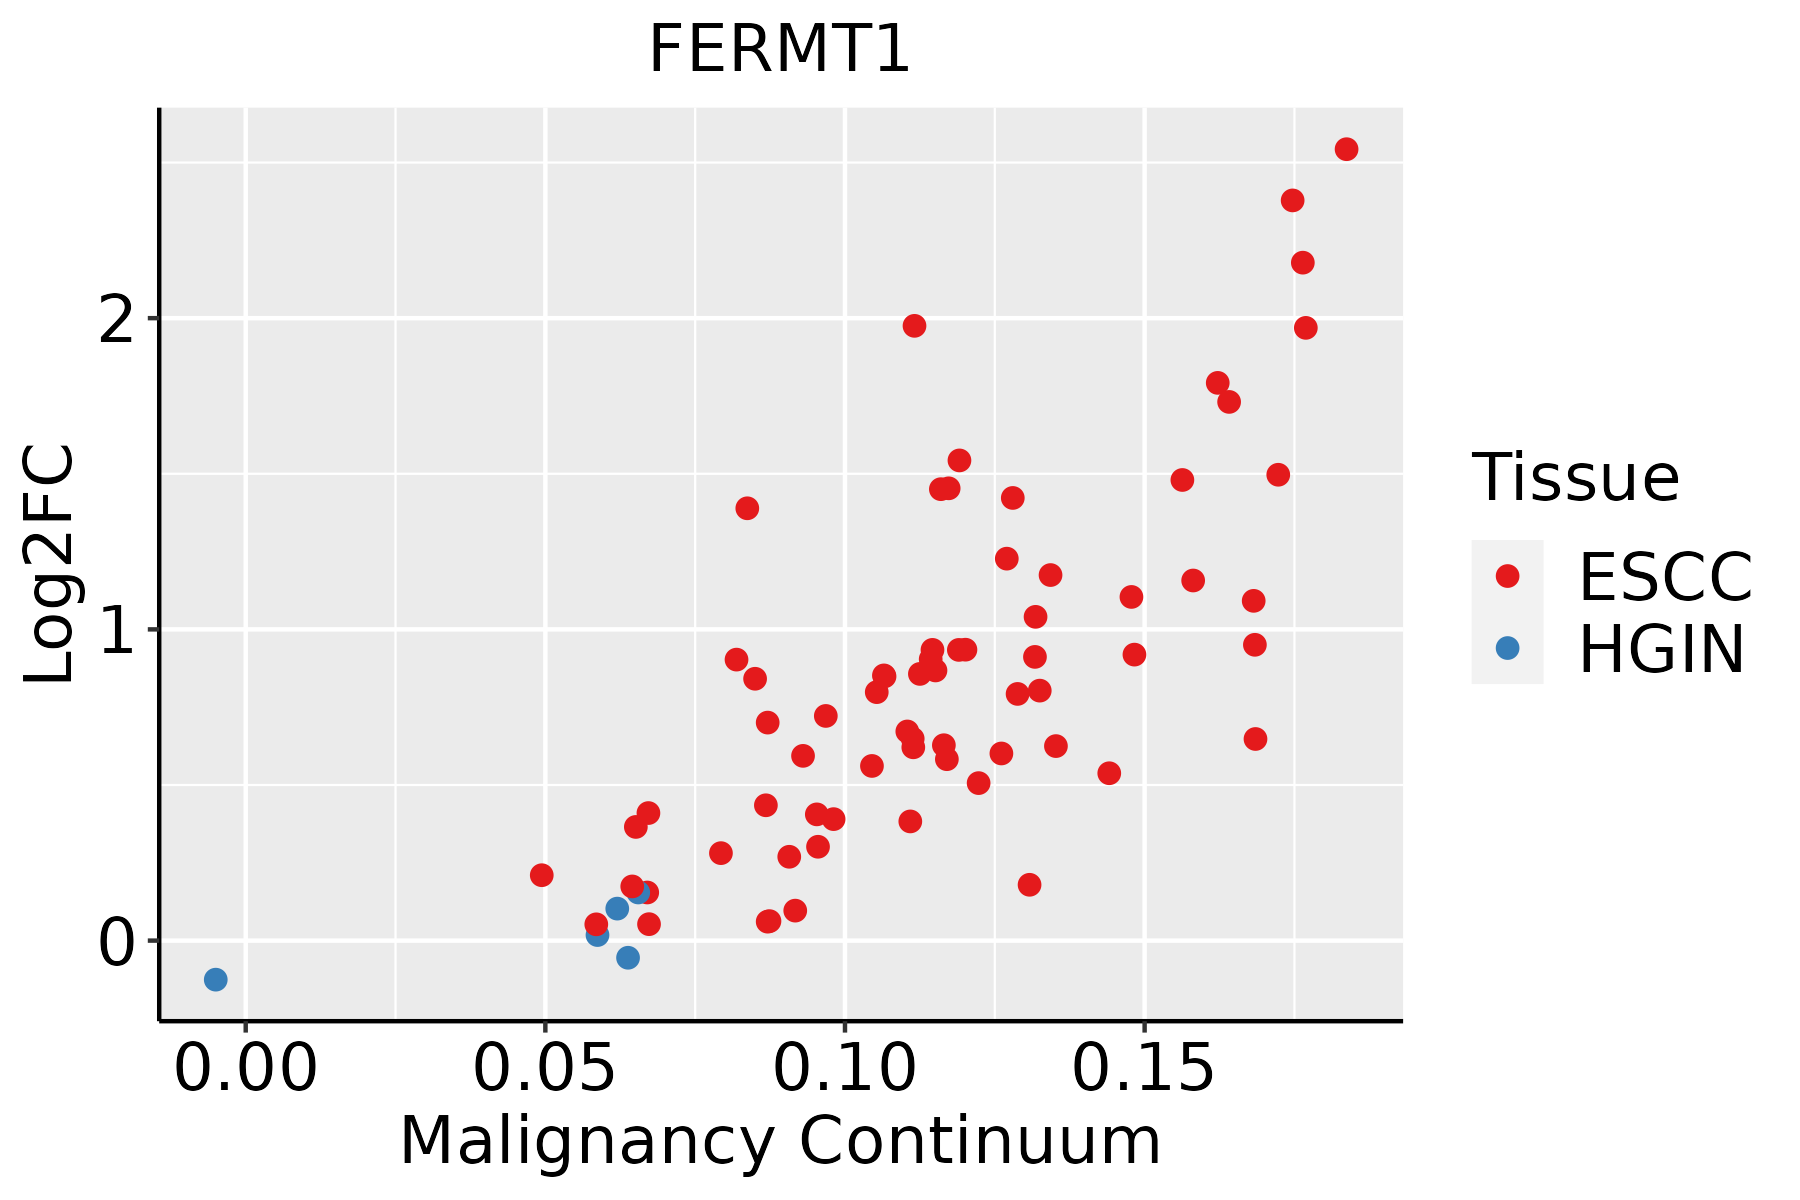 | ESCC: Esophageal squamous cell carcinoma |
| HGIN: High-grade intraepithelial neoplasias | ||
| LGIN: Low-grade intraepithelial neoplasias | ||
| Liver | 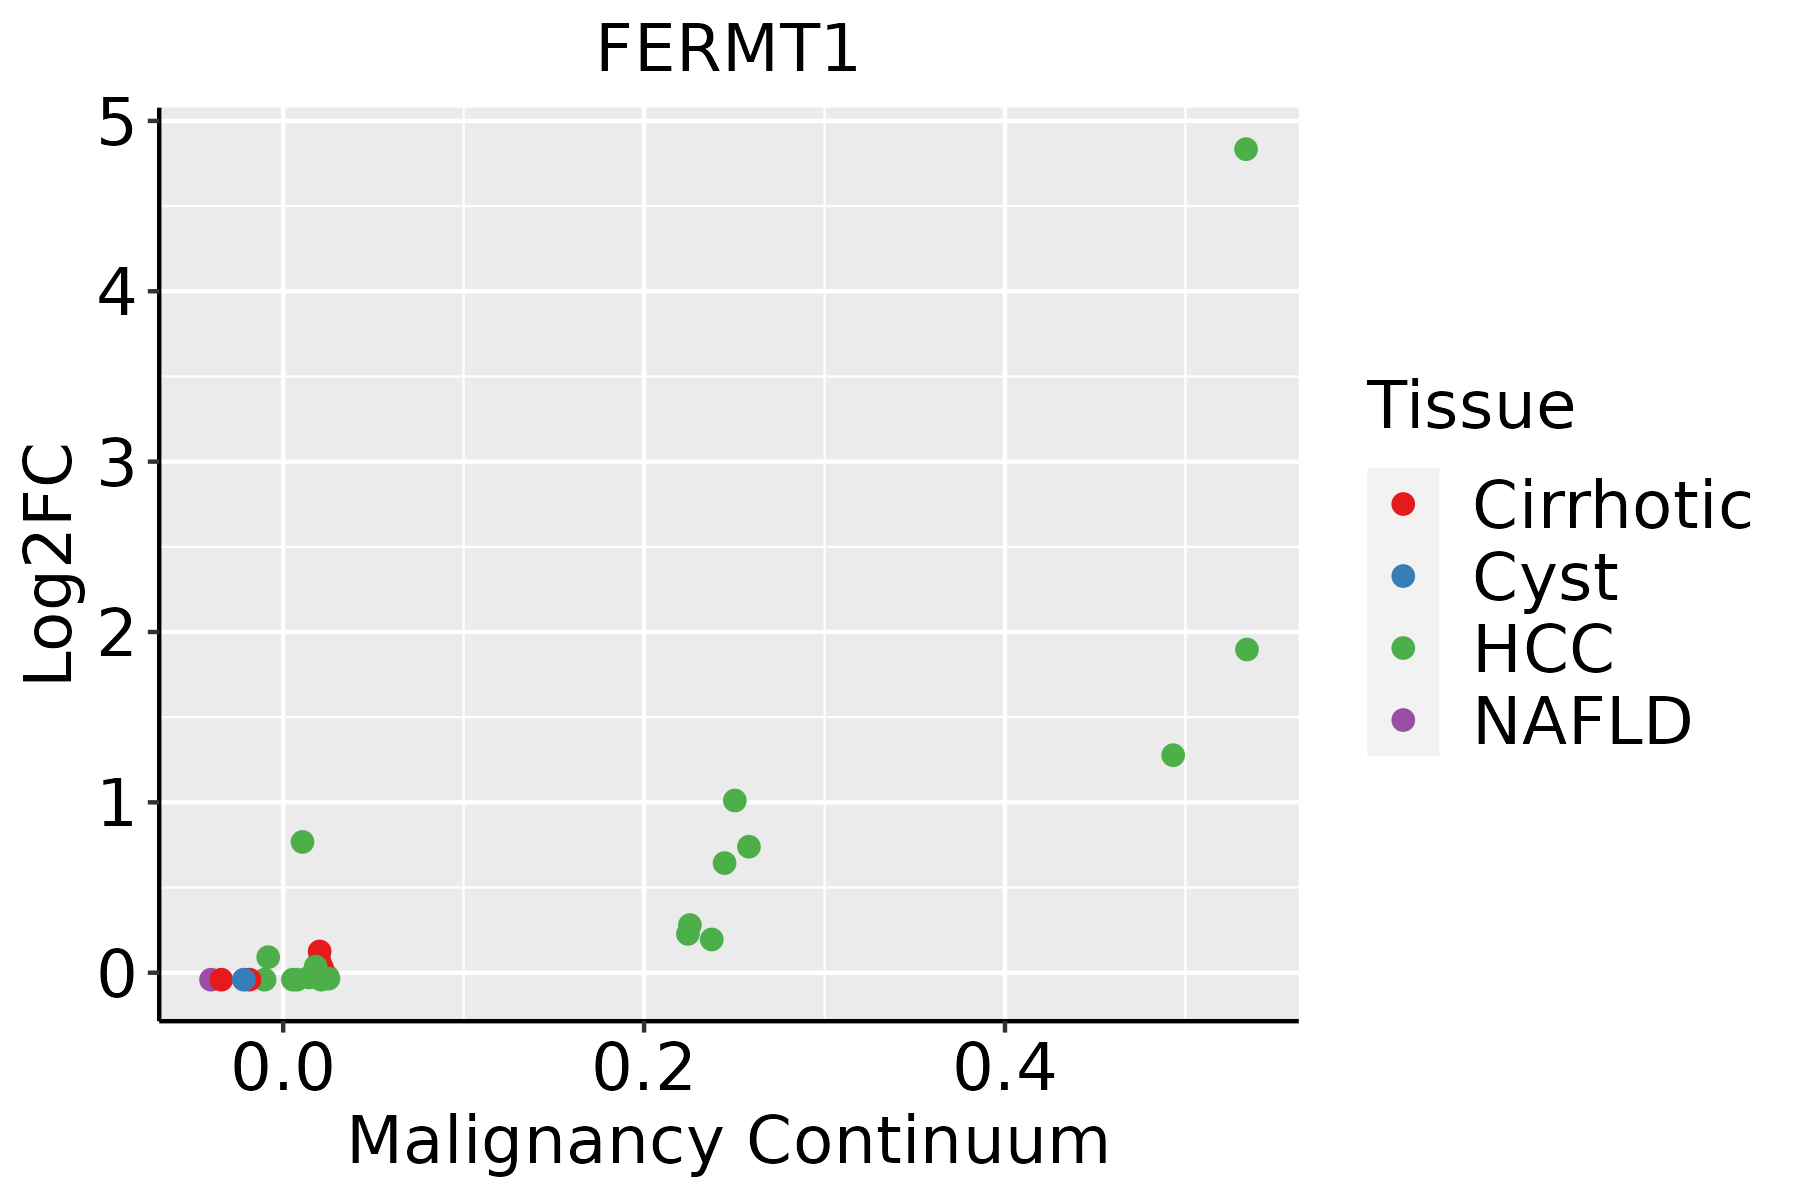 | HCC: Hepatocellular carcinoma |
| NAFLD: Non-alcoholic fatty liver disease | ||
| Oral Cavity | 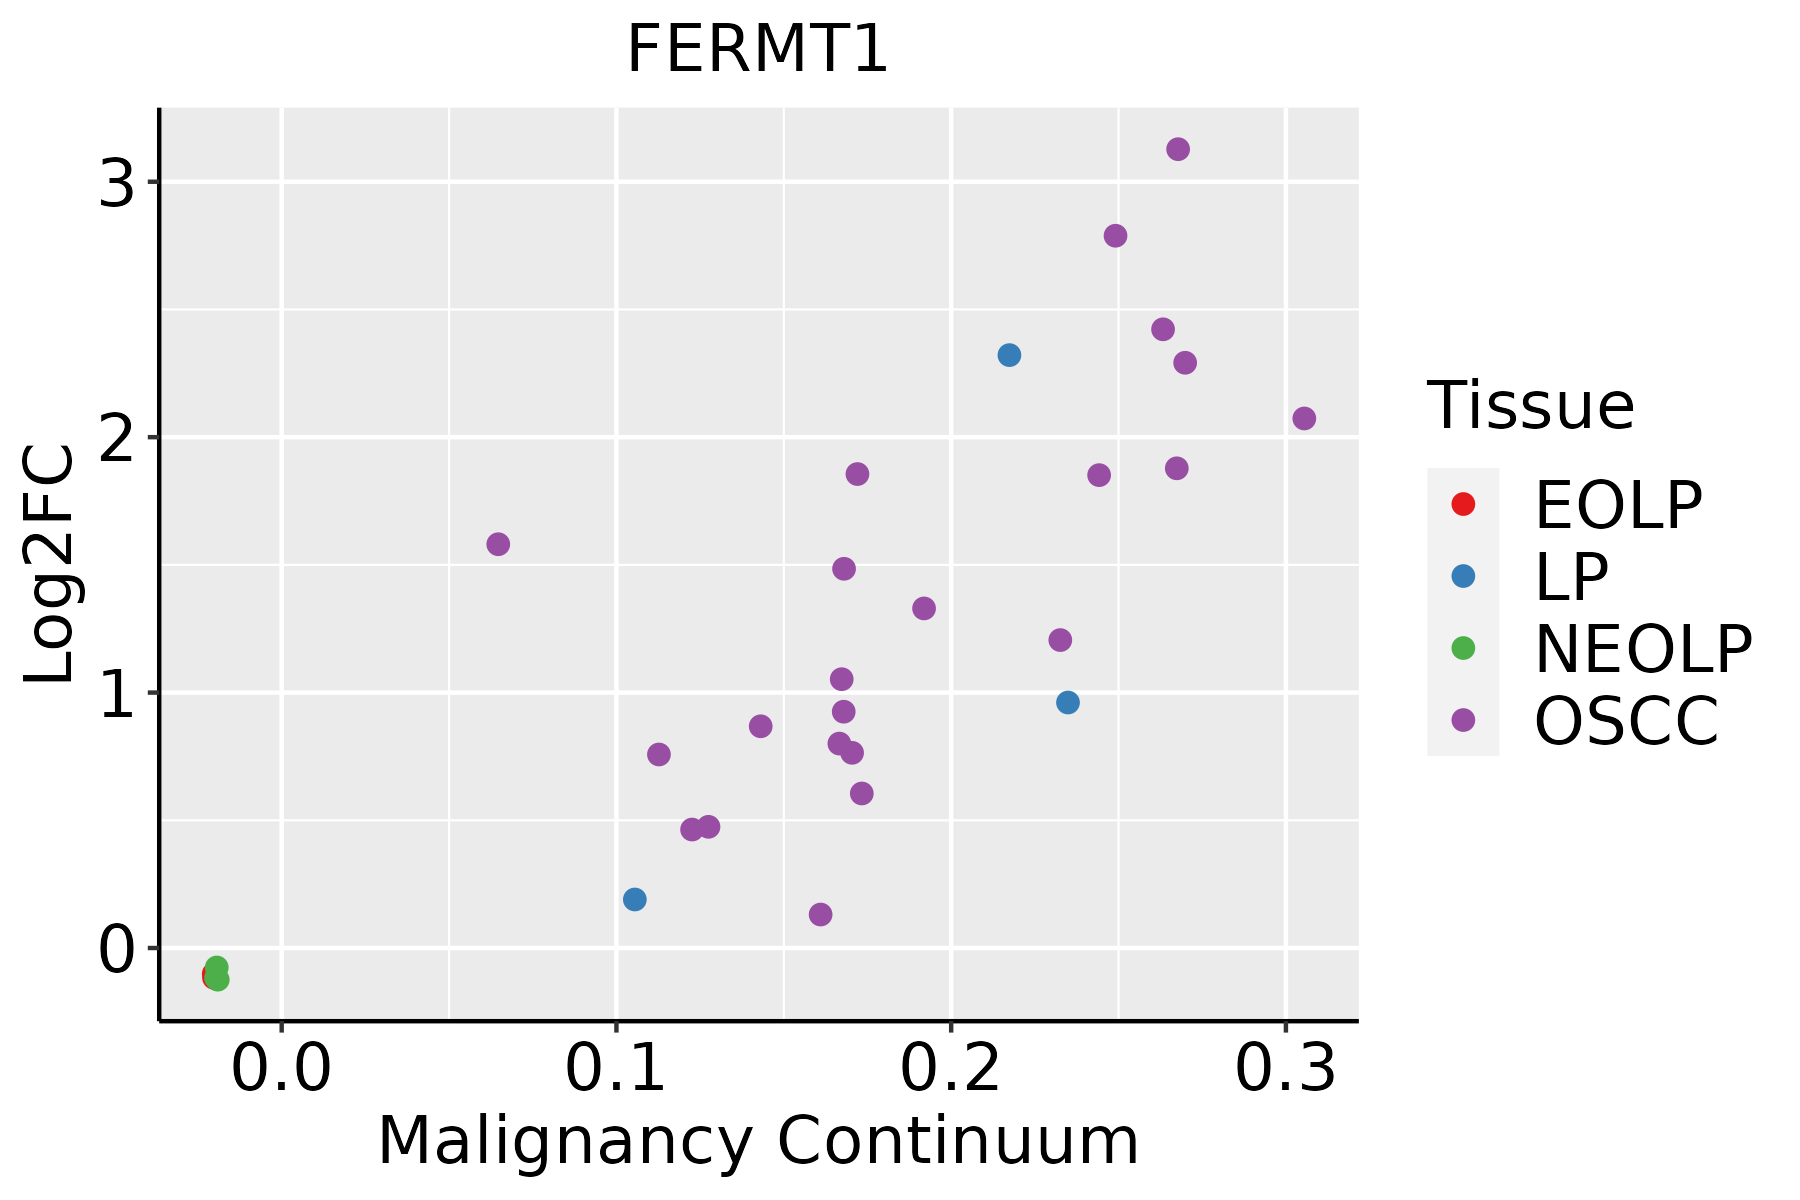 | EOLP: Erosive Oral lichen planus |
| LP: leukoplakia | ||
| NEOLP: Non-erosive oral lichen planus | ||
| OSCC: Oral squamous cell carcinoma | ||
| Prostate |  | BPH: Benign Prostatic Hyperplasia |
| Skin | 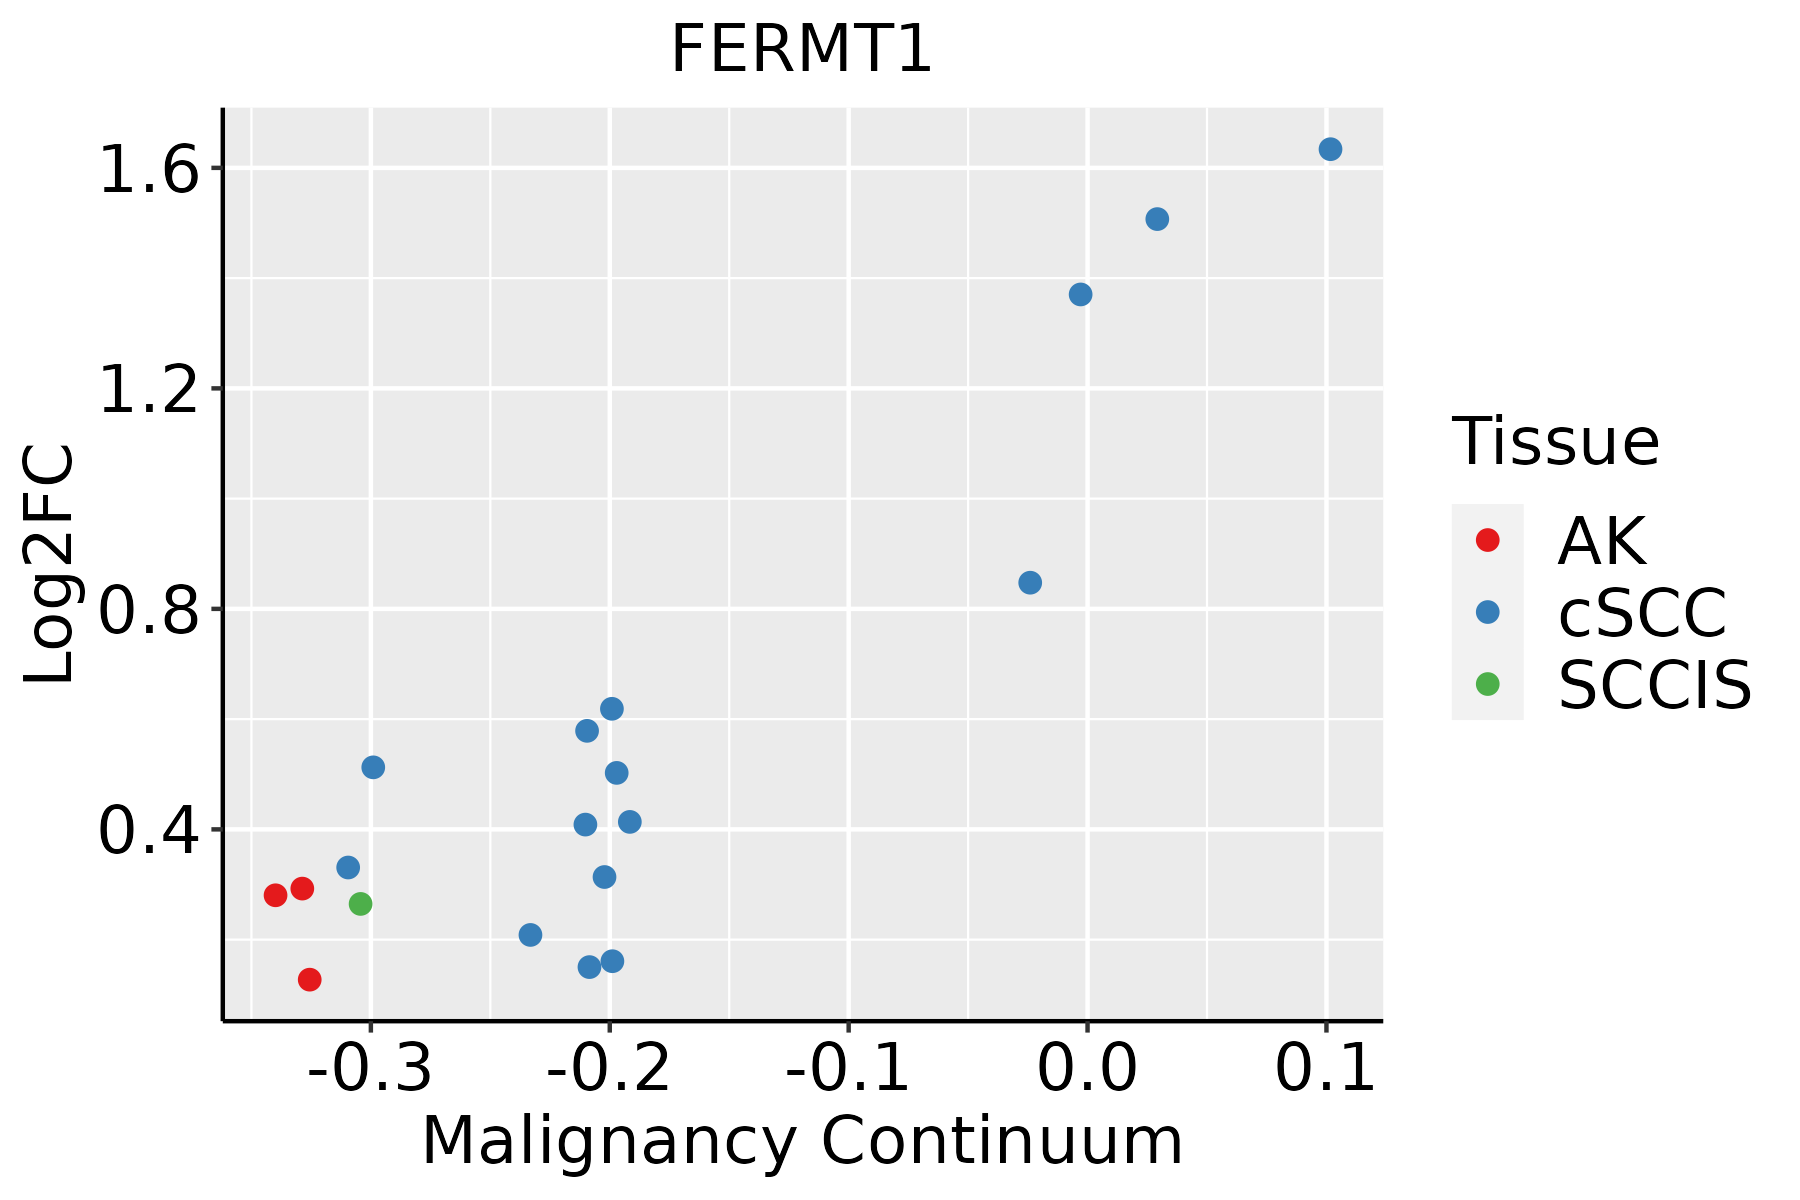 | AK: Actinic keratosis |
| cSCC: Cutaneous squamous cell carcinoma | ||
| SCCIS:squamous cell carcinoma in situ |
| ∗log2FC in expression of this searched gene in stem-like cells from each diseased tissue sample relative to stem-like cells in normal samples in each tissue plotted against the malignancy continuum. Samples are colored based on if they are from different disease stage. |
Top |
Malignant transformation related pathway analysis |
| Find out the enriched GO biological processes and KEGG pathways involved in transition from healthy to precancer to cancer |
| Tissue | Disease Stage | Enriched GO biological Processes |
| Colorectum | AD |  |
| Colorectum | SER |  |
| Colorectum | MSS |  |
| Colorectum | MSI-H |  |
| Colorectum | FAP |  |
| ∗Top 15 enriched GO BP terms are showed in the bar plot of each disease state in each tissue. Each row represents a significant GO biological process which is colored according to the -log10(p.adjust). |
| Page: 1 2 3 4 5 6 7 8 9 |
| GO ID | Tissue | Disease Stage | Description | Gene Ratio | Bg Ratio | pvalue | p.adjust | Count |
| GO:004206010 | Cervix | CC | wound healing | 109/2311 | 422/18723 | 1.84e-14 | 1.57e-11 | 109 |
| GO:001081010 | Cervix | CC | regulation of cell-substrate adhesion | 69/2311 | 221/18723 | 8.57e-14 | 5.69e-11 | 69 |
| GO:00315898 | Cervix | CC | cell-substrate adhesion | 96/2311 | 363/18723 | 1.48e-13 | 8.85e-11 | 96 |
| GO:009013210 | Cervix | CC | epithelium migration | 90/2311 | 360/18723 | 2.45e-11 | 6.11e-09 | 90 |
| GO:00016679 | Cervix | CC | ameboidal-type cell migration | 110/2311 | 475/18723 | 2.66e-11 | 6.36e-09 | 110 |
| GO:001063110 | Cervix | CC | epithelial cell migration | 89/2311 | 357/18723 | 3.72e-11 | 8.54e-09 | 89 |
| GO:00085446 | Cervix | CC | epidermis development | 83/2311 | 324/18723 | 3.91e-11 | 8.54e-09 | 83 |
| GO:00071639 | Cervix | CC | establishment or maintenance of cell polarity | 63/2311 | 218/18723 | 4.25e-11 | 8.76e-09 | 63 |
| GO:009013010 | Cervix | CC | tissue migration | 90/2311 | 365/18723 | 5.42e-11 | 1.05e-08 | 90 |
| GO:00435884 | Cervix | CC | skin development | 71/2311 | 263/18723 | 8.04e-11 | 1.46e-08 | 71 |
| GO:00725949 | Cervix | CC | establishment of protein localization to organelle | 99/2311 | 422/18723 | 1.23e-10 | 2.11e-08 | 99 |
| GO:004578510 | Cervix | CC | positive regulation of cell adhesion | 101/2311 | 437/18723 | 1.96e-10 | 3.08e-08 | 101 |
| GO:00506737 | Cervix | CC | epithelial cell proliferation | 98/2311 | 437/18723 | 2.01e-09 | 2.15e-07 | 98 |
| GO:004325410 | Cervix | CC | regulation of protein-containing complex assembly | 96/2311 | 428/18723 | 2.91e-09 | 3.05e-07 | 96 |
| GO:00160557 | Cervix | CC | Wnt signaling pathway | 98/2311 | 444/18723 | 4.82e-09 | 4.65e-07 | 98 |
| GO:01987387 | Cervix | CC | cell-cell signaling by wnt | 98/2311 | 446/18723 | 6.16e-09 | 5.58e-07 | 98 |
| GO:00019528 | Cervix | CC | regulation of cell-matrix adhesion | 40/2311 | 128/18723 | 1.32e-08 | 1.04e-06 | 40 |
| GO:00071608 | Cervix | CC | cell-matrix adhesion | 60/2311 | 233/18723 | 1.58e-08 | 1.23e-06 | 60 |
| GO:00301117 | Cervix | CC | regulation of Wnt signaling pathway | 76/2311 | 328/18723 | 3.05e-08 | 2.08e-06 | 76 |
| GO:00069139 | Cervix | CC | nucleocytoplasmic transport | 71/2311 | 301/18723 | 4.04e-08 | 2.54e-06 | 71 |
| Page: 1 2 3 4 5 6 7 8 9 10 11 12 13 14 15 16 17 18 19 20 21 22 23 24 25 26 27 28 29 30 31 32 33 34 35 36 37 38 39 40 41 42 43 44 45 46 47 |
| Pathway ID | Tissue | Disease Stage | Description | Gene Ratio | Bg Ratio | pvalue | p.adjust | qvalue | Count |
| Page: 1 |
Top |
Cell-cell communication analysis |
| Identification of potential cell-cell interactions between two cell types and their ligand-receptor pairs for different disease states |
| Ligand | Receptor | LRpair | Pathway | Tissue | Disease Stage |
| Page: 1 |
Top |
Single-cell gene regulatory network inference analysis |
| Find out the significant the regulons (TFs) and the target genes of each regulon across cell types for different disease states |
| TF | Cell Type | Tissue | Disease Stage | Target Gene | RSS | Regulon Activity |
| ∗The dot plots of a searched regulon are shown for all cell subpopulations in each disease state of each tissue based on the regulon specific score inferred using pySCENIC and by calculating the average expression. |
| Page: 1 |
Top |
Somatic mutation of malignant transformation related genes |
| Annotation of somatic variants for genes involved in malignant transformation |
| Hugo Symbol | Variant Class | Variant Classification | dbSNP RS | HGVSc | HGVSp | HGVSp Short | SWISSPROT | BIOTYPE | SIFT | PolyPhen | Tumor Sample Barcode | Tissue | Histology | Sex | Age | Stage | Therapy Types | Drugs | Outcome |
| FERMT1 | SNV | Missense_Mutation | c.1870N>A | p.Glu624Lys | p.E624K | Q9BQL6 | protein_coding | deleterious(0.01) | possibly_damaging(0.833) | TCGA-A8-A09I-01 | Breast | breast invasive carcinoma | Female | >=65 | I/II | Hormone Therapy | anastrozole | SD | |
| FERMT1 | SNV | Missense_Mutation | c.447G>C | p.Lys149Asn | p.K149N | Q9BQL6 | protein_coding | tolerated(0.22) | probably_damaging(0.983) | TCGA-AC-A23H-01 | Breast | breast invasive carcinoma | Female | >=65 | I/II | Unknown | Unknown | PD | |
| FERMT1 | SNV | Missense_Mutation | c.70G>C | p.Glu24Gln | p.E24Q | Q9BQL6 | protein_coding | tolerated(0.18) | benign(0.101) | TCGA-AC-A23H-01 | Breast | breast invasive carcinoma | Female | >=65 | I/II | Unknown | Unknown | PD | |
| FERMT1 | SNV | Missense_Mutation | c.509N>A | p.Ser170Tyr | p.S170Y | Q9BQL6 | protein_coding | tolerated(0.23) | possibly_damaging(0.703) | TCGA-AN-A046-01 | Breast | breast invasive carcinoma | Female | >=65 | I/II | Unknown | Unknown | SD | |
| FERMT1 | SNV | Missense_Mutation | c.2028N>T | p.Gln676His | p.Q676H | Q9BQL6 | protein_coding | tolerated(0.94) | possibly_damaging(0.732) | TCGA-AN-A0AK-01 | Breast | breast invasive carcinoma | Female | >=65 | I/II | Unknown | Unknown | SD | |
| FERMT1 | SNV | Missense_Mutation | c.1024G>A | p.Glu342Lys | p.E342K | Q9BQL6 | protein_coding | deleterious(0.01) | benign(0.232) | TCGA-AO-A0JC-01 | Breast | breast invasive carcinoma | Female | <65 | I/II | Chemotherapy | fluorouracil | SD | |
| FERMT1 | SNV | Missense_Mutation | novel | c.757T>C | p.Ser253Pro | p.S253P | Q9BQL6 | protein_coding | deleterious(0.01) | probably_damaging(1) | TCGA-AO-A0JD-01 | Breast | breast invasive carcinoma | Female | <65 | III/IV | Chemotherapy | cyclophosphamide | SD |
| FERMT1 | SNV | Missense_Mutation | rs143876620 | c.1603N>T | p.Arg535Trp | p.R535W | Q9BQL6 | protein_coding | deleterious(0) | probably_damaging(0.98) | TCGA-2W-A8YY-01 | Cervix | cervical & endocervical cancer | Female | <65 | I/II | Chemotherapy | cisplatin | CR |
| FERMT1 | SNV | Missense_Mutation | novel | c.790N>A | p.Glu264Lys | p.E264K | Q9BQL6 | protein_coding | deleterious(0.02) | probably_damaging(0.976) | TCGA-MY-A5BF-01 | Cervix | cervical & endocervical cancer | Female | >=65 | I/II | Chemotherapy | cisplatin | CR |
| FERMT1 | SNV | Missense_Mutation | c.1258N>A | p.Leu420Ile | p.L420I | Q9BQL6 | protein_coding | deleterious(0.03) | benign(0.236) | TCGA-AA-3977-01 | Colorectum | colon adenocarcinoma | Male | >=65 | I/II | Unknown | Unknown | SD |
| Page: 1 2 3 4 5 6 |
Top |
Related drugs of malignant transformation related genes |
| Identification of chemicals and drugs interact with genes involved in malignant transfromation |
| (DGIdb 4.0) |
| Entrez ID | Symbol | Category | Interaction Types | Drug Claim Name | Drug Name | PMIDs |
| Page: 1 |

Copyright 2023-Present -The University of Texas Health Science Center at Houston |