
|
|||||
|
 | |
| |
| |
| |
| |
| |
|
Gene: FER1L6 |
Gene summary for FER1L6 |
| Gene information | Species | Human | Gene symbol | FER1L6 | Gene ID | 654463 |
| Gene name | fer-1 like family member 6 | |
| Gene Alias | C8ORFK23 | |
| Cytomap | 8q24.13 | |
| Gene Type | protein-coding | GO ID | GO:0007009 | UniProtAcc | Q2WGJ9 |
Top |
Malignant transformation analysis |
| Identification of the aberrant gene expression in precancerous and cancerous lesions by comparing the gene expression of stem-like cells in diseased tissues with normal stem cells |
| Entrez ID | Symbol | Replicates | Species | Organ | Tissue | Adj P-value | Log2FC | Malignancy |
| 654463 | FER1L6 | HTA11_2487_2000001011 | Human | Colorectum | SER | 2.01e-02 | 2.67e-01 | -0.1808 |
| 654463 | FER1L6 | HTA11_78_2000001011 | Human | Colorectum | AD | 6.28e-05 | 3.49e-01 | -0.1088 |
| 654463 | FER1L6 | HTA11_411_2000001011 | Human | Colorectum | SER | 6.63e-05 | 9.28e-01 | -0.2602 |
| 654463 | FER1L6 | HTA11_2112_2000001011 | Human | Colorectum | SER | 3.88e-04 | 9.70e-01 | -0.2196 |
| 654463 | FER1L6 | Pat02-B | Human | Stomach | GC | 1.08e-13 | 3.34e-01 | 0.0368 |
| 654463 | FER1L6 | Pat03-B | Human | Stomach | GC | 1.84e-03 | 2.43e-01 | 0.3693 |
| 654463 | FER1L6 | Pat04-B | Human | Stomach | GC | 1.80e-12 | 3.94e-01 | -0.1483 |
| 654463 | FER1L6 | Pat05-B | Human | Stomach | GC | 2.01e-02 | 2.30e-01 | -0.0353 |
| 654463 | FER1L6 | Pat06-B | Human | Stomach | GC | 9.30e-09 | 2.45e-01 | -0.1961 |
| 654463 | FER1L6 | Pat10-B | Human | Stomach | GC | 2.06e-06 | 4.79e-01 | 0.084 |
| 654463 | FER1L6 | Pat11-B | Human | Stomach | GC | 3.43e-07 | 2.68e-01 | -0.182 |
| 654463 | FER1L6 | Pat13-B | Human | Stomach | GC | 1.66e-05 | 3.41e-01 | 0.0555 |
| 654463 | FER1L6 | Pat15-B | Human | Stomach | GC | 4.46e-06 | 3.13e-01 | -0.0778 |
| 654463 | FER1L6 | Pat18-B | Human | Stomach | GC | 4.35e-23 | 6.07e-01 | -0.0432 |
| 654463 | FER1L6 | Pat19-B | Human | Stomach | GC | 2.04e-08 | 3.47e-01 | 0.0826 |
| 654463 | FER1L6 | Pat22-B | Human | Stomach | GC | 1.24e-16 | 3.94e-01 | -0.1042 |
| 654463 | FER1L6 | Pat24-B | Human | Stomach | GC | 3.34e-05 | 2.87e-01 | -0.1184 |
| 654463 | FER1L6 | Pat25-A | Human | Stomach | CAG with IM | 2.85e-11 | 2.25e-01 | -0.1648 |
| 654463 | FER1L6 | Pat26-A | Human | Stomach | CSG | 4.59e-13 | 2.69e-01 | -0.2402 |
| 654463 | FER1L6 | Pat28-A | Human | Stomach | CSG | 5.25e-08 | 2.70e-01 | -0.2594 |
| Page: 1 |
| Tissue | Expression Dynamics | Abbreviation |
| Colorectum (GSE201348) | 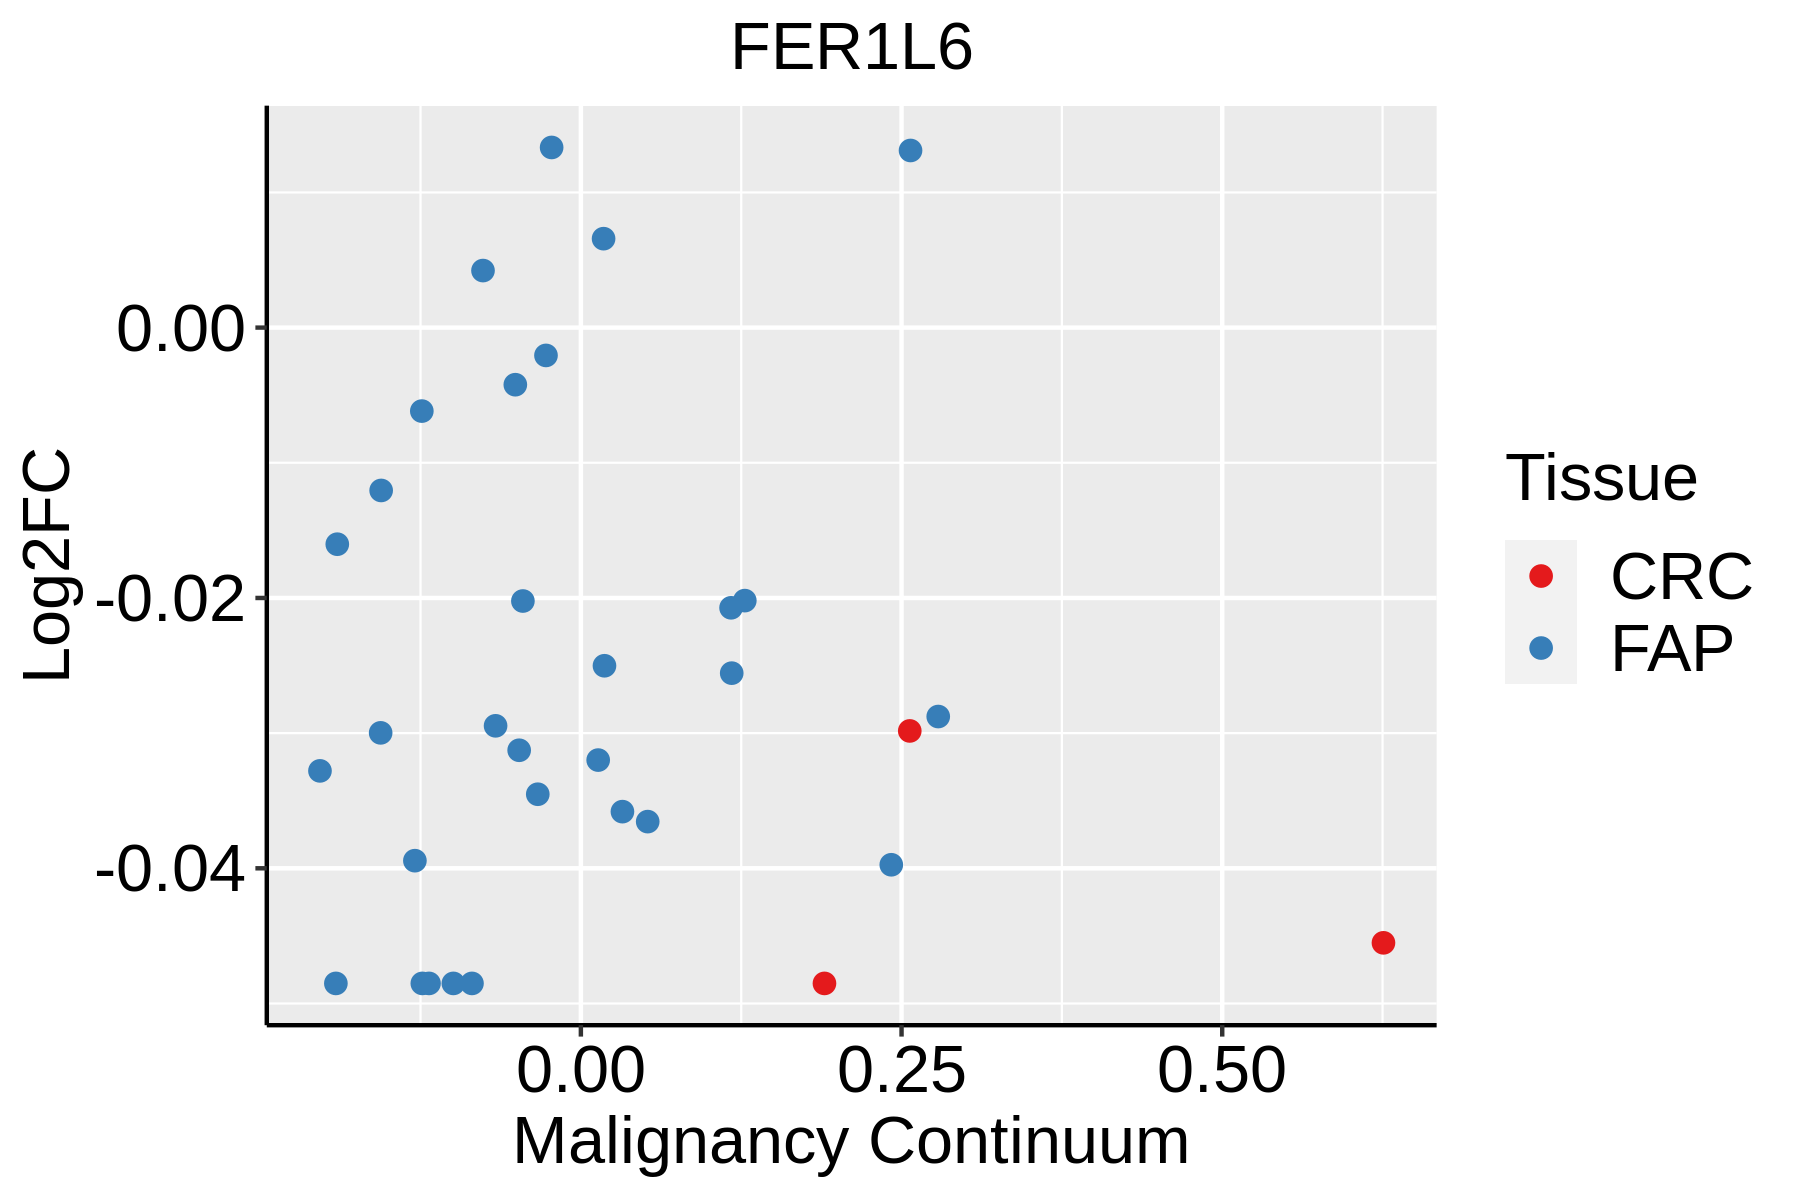 | FAP: Familial adenomatous polyposis |
| CRC: Colorectal cancer | ||
| Colorectum (HTA11) | 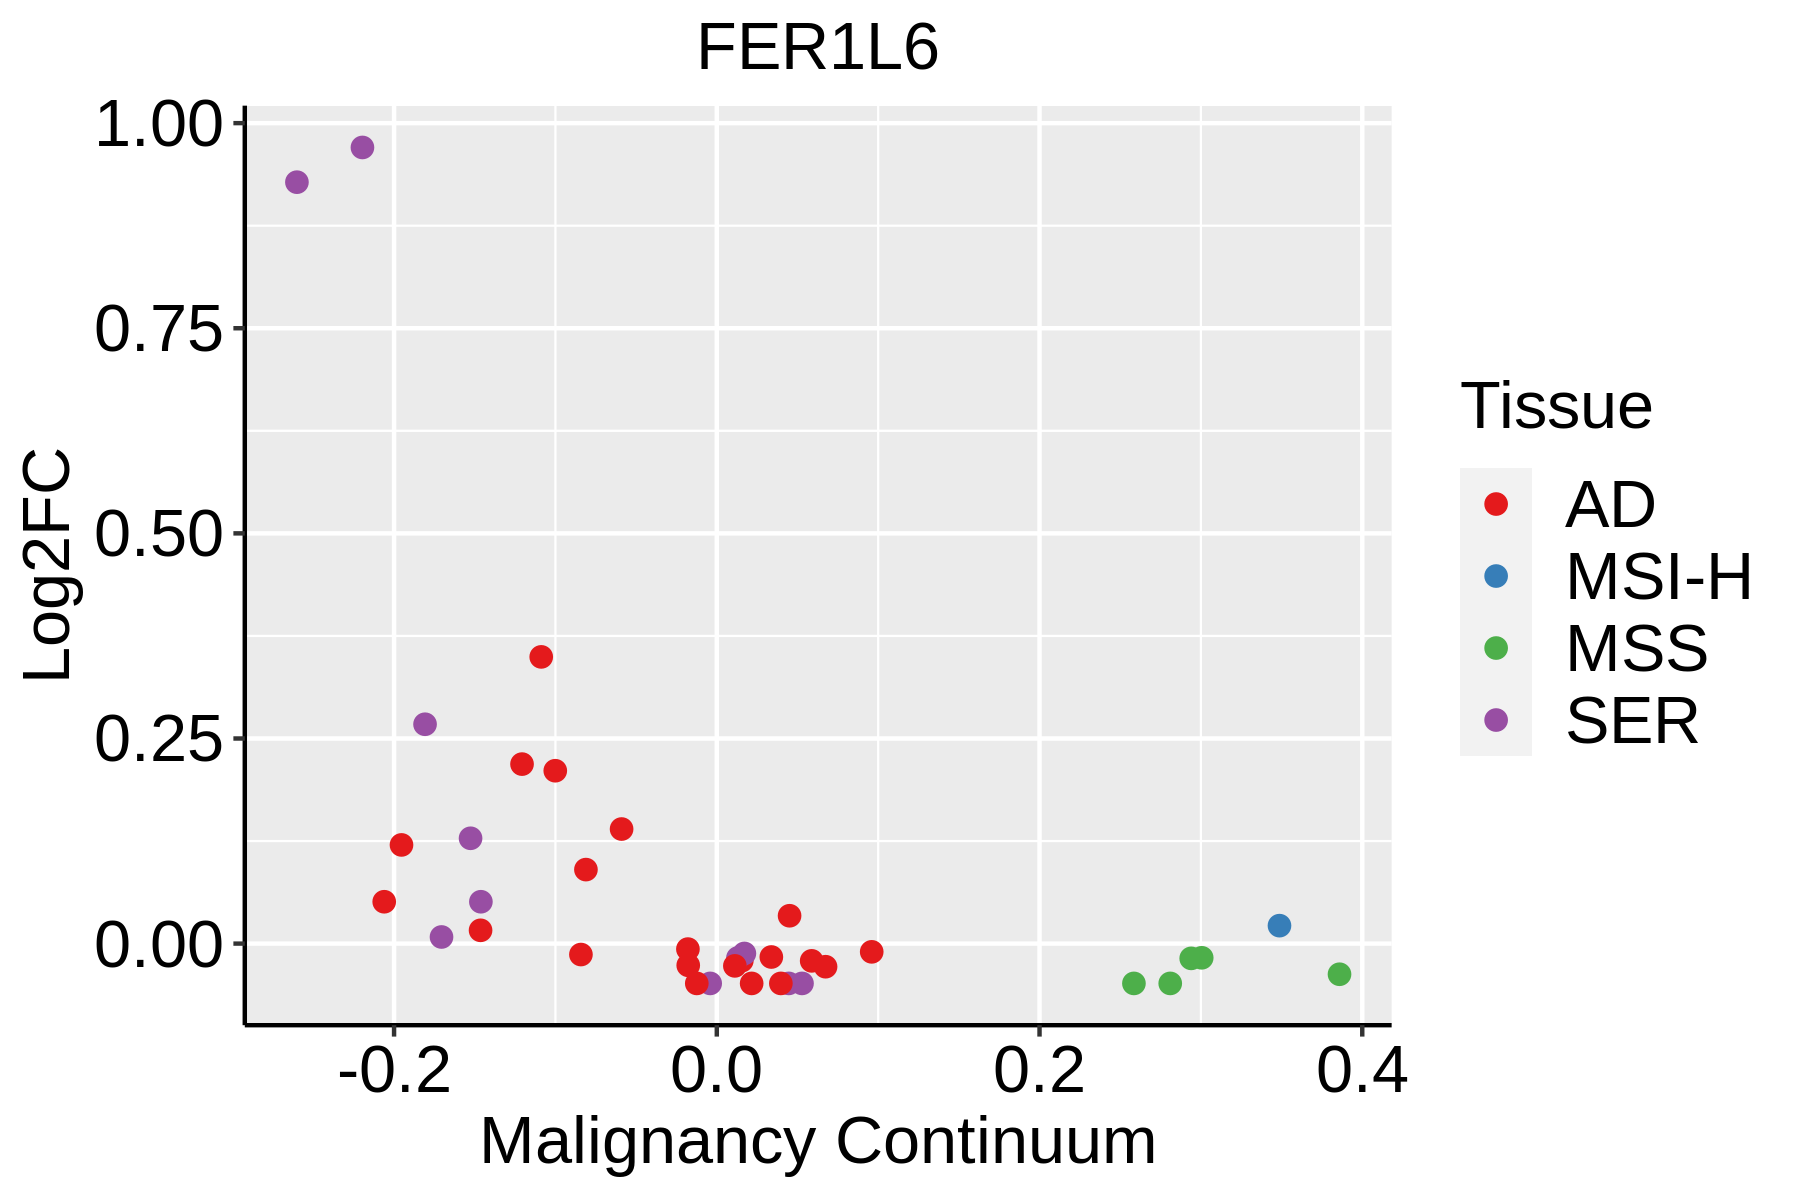 | AD: Adenomas |
| SER: Sessile serrated lesions | ||
| MSI-H: Microsatellite-high colorectal cancer | ||
| MSS: Microsatellite stable colorectal cancer | ||
| GC | 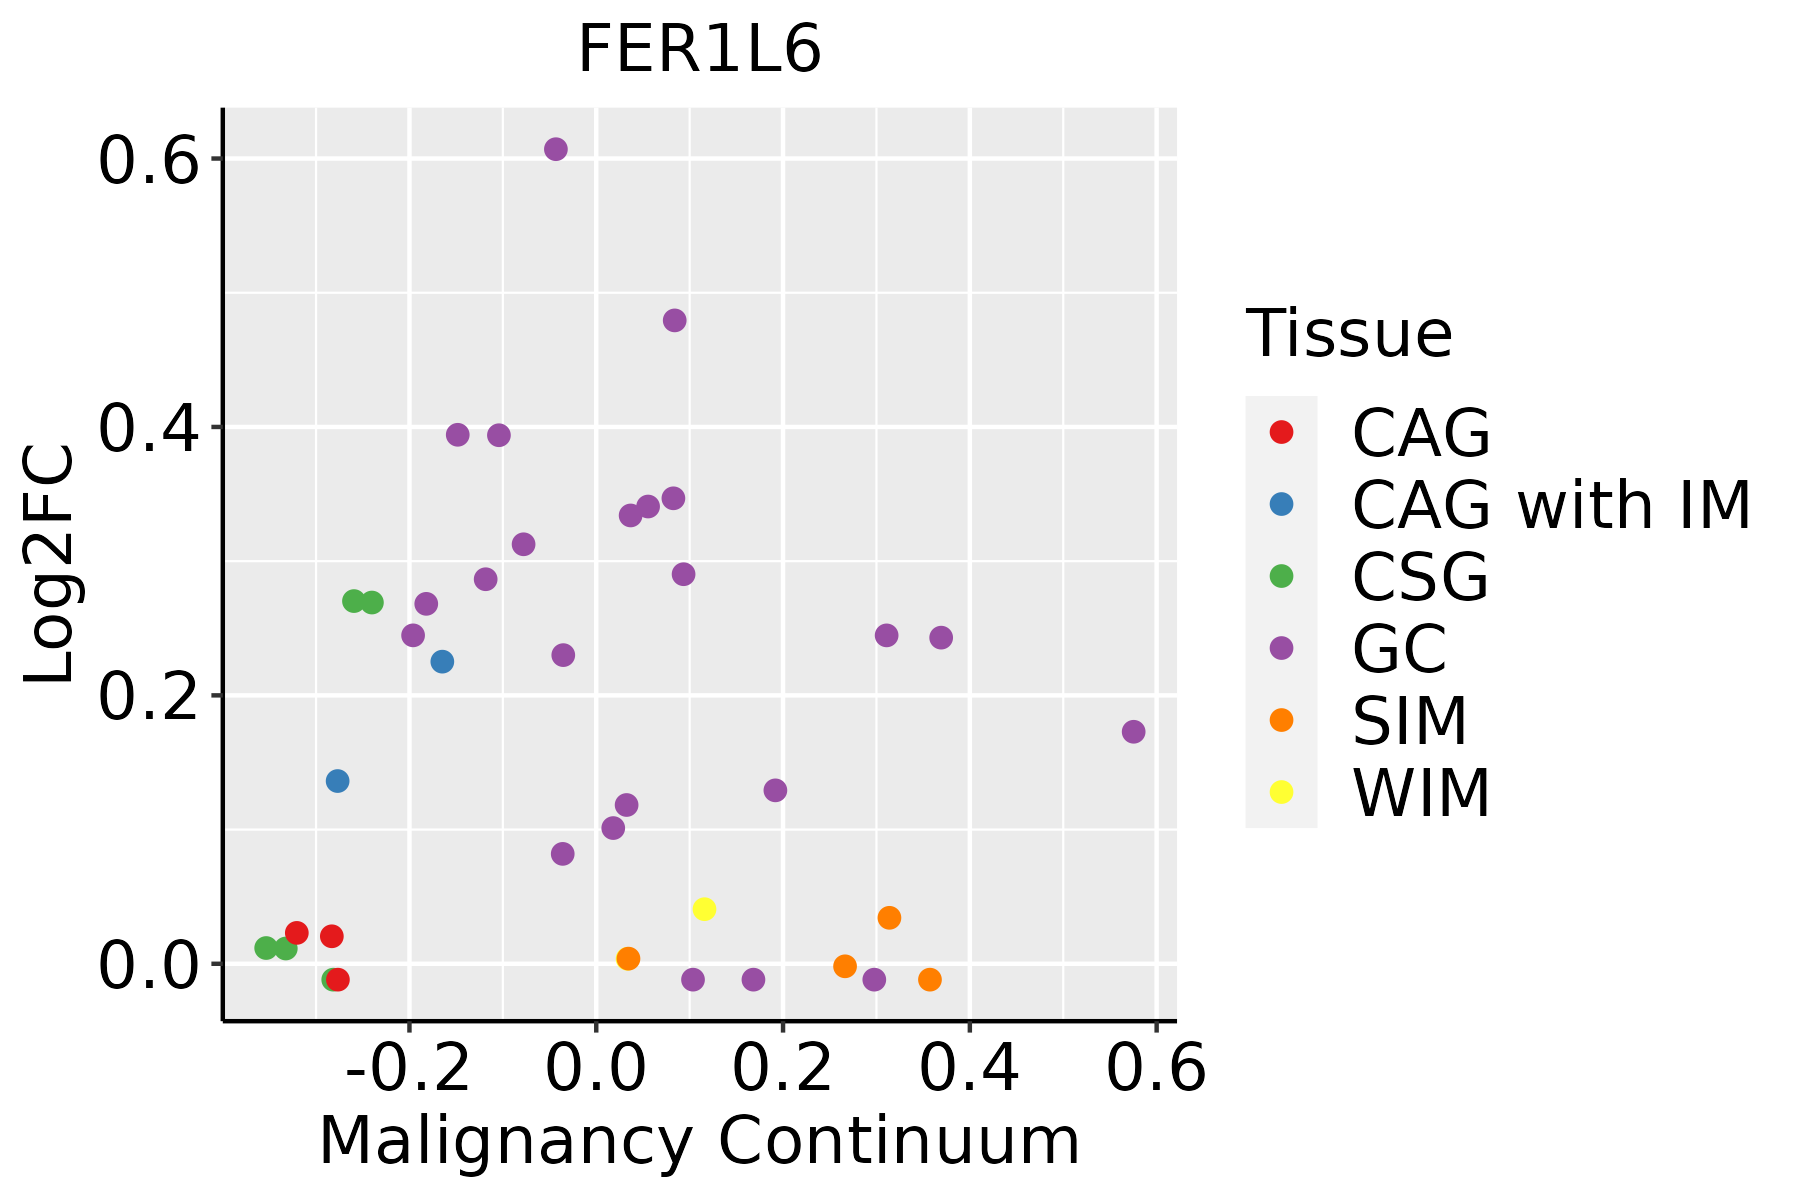 | CAG: Chronic atrophic gastritis |
| CAG with IM: Chronic atrophic gastritis with intestinal metaplasia | ||
| CSG: Chronic superficial gastritis | ||
| GC: Gastric cancer | ||
| SIM: Severe intestinal metaplasia | ||
| WIM: Wild intestinal metaplasia |
| ∗log2FC in expression of this searched gene in stem-like cells from each diseased tissue sample relative to stem-like cells in normal samples in each tissue plotted against the malignancy continuum. Samples are colored based on if they are from different disease stage. |
Top |
Malignant transformation related pathway analysis |
| Find out the enriched GO biological processes and KEGG pathways involved in transition from healthy to precancer to cancer |
| Tissue | Disease Stage | Enriched GO biological Processes |
| Colorectum | AD |  |
| Colorectum | SER |  |
| Colorectum | MSS |  |
| Colorectum | MSI-H |  |
| Colorectum | FAP |  |
| ∗Top 15 enriched GO BP terms are showed in the bar plot of each disease state in each tissue. Each row represents a significant GO biological process which is colored according to the -log10(p.adjust). |
| Page: 1 2 3 4 5 6 7 8 9 |
| GO ID | Tissue | Disease Stage | Description | Gene Ratio | Bg Ratio | pvalue | p.adjust | Count |
| GO:0007009 | Colorectum | SER | plasma membrane organization | 36/2897 | 142/18723 | 1.50e-03 | 1.62e-02 | 36 |
| Page: 1 |
| Pathway ID | Tissue | Disease Stage | Description | Gene Ratio | Bg Ratio | pvalue | p.adjust | qvalue | Count |
| Page: 1 |
Top |
Cell-cell communication analysis |
| Identification of potential cell-cell interactions between two cell types and their ligand-receptor pairs for different disease states |
| Ligand | Receptor | LRpair | Pathway | Tissue | Disease Stage |
| Page: 1 |
Top |
Single-cell gene regulatory network inference analysis |
| Find out the significant the regulons (TFs) and the target genes of each regulon across cell types for different disease states |
| TF | Cell Type | Tissue | Disease Stage | Target Gene | RSS | Regulon Activity |
| ∗The dot plots of a searched regulon are shown for all cell subpopulations in each disease state of each tissue based on the regulon specific score inferred using pySCENIC and by calculating the average expression. |
| Page: 1 |
Top |
Somatic mutation of malignant transformation related genes |
| Annotation of somatic variants for genes involved in malignant transformation |
| Hugo Symbol | Variant Class | Variant Classification | dbSNP RS | HGVSc | HGVSp | HGVSp Short | SWISSPROT | BIOTYPE | SIFT | PolyPhen | Tumor Sample Barcode | Tissue | Histology | Sex | Age | Stage | Therapy Types | Drugs | Outcome |
| FER1L6 | SNV | Missense_Mutation | novel | c.2461C>A | p.Gln821Lys | p.Q821K | Q2WGJ9 | protein_coding | tolerated(1) | benign(0) | TCGA-A2-A4RY-01 | Breast | breast invasive carcinoma | Female | <65 | III/IV | Chemotherapy | taxotere | CR |
| FER1L6 | SNV | Missense_Mutation | rs765039191 | c.2960C>T | p.Pro987Leu | p.P987L | Q2WGJ9 | protein_coding | deleterious(0) | probably_damaging(0.998) | TCGA-A2-A4S1-01 | Breast | breast invasive carcinoma | Female | >=65 | I/II | Unknown | Unknown | SD |
| FER1L6 | SNV | Missense_Mutation | rs200371435 | c.1891A>T | p.Thr631Ser | p.T631S | Q2WGJ9 | protein_coding | tolerated(0.61) | benign(0.001) | TCGA-A8-A07J-01 | Breast | breast invasive carcinoma | Female | <65 | I/II | Chemotherapy | 5-fluorouracil | CR |
| FER1L6 | SNV | Missense_Mutation | c.2498N>T | p.Tyr833Phe | p.Y833F | Q2WGJ9 | protein_coding | deleterious(0.01) | probably_damaging(0.999) | TCGA-A8-A09W-01 | Breast | breast invasive carcinoma | Female | >=65 | III/IV | Unknown | Unknown | SD | |
| FER1L6 | SNV | Missense_Mutation | c.2004G>C | p.Trp668Cys | p.W668C | Q2WGJ9 | protein_coding | tolerated(0.18) | benign(0.021) | TCGA-AC-A23C-01 | Breast | breast invasive carcinoma | Female | <65 | I/II | Chemotherapy | chemo | CR | |
| FER1L6 | SNV | Missense_Mutation | novel | c.757N>A | p.Glu253Lys | p.E253K | Q2WGJ9 | protein_coding | deleterious(0) | probably_damaging(0.995) | TCGA-AN-A046-01 | Breast | breast invasive carcinoma | Female | >=65 | I/II | Unknown | Unknown | SD |
| FER1L6 | SNV | Missense_Mutation | novel | c.3599N>T | p.Arg1200Met | p.R1200M | Q2WGJ9 | protein_coding | tolerated(0.05) | probably_damaging(0.921) | TCGA-AN-A046-01 | Breast | breast invasive carcinoma | Female | >=65 | I/II | Unknown | Unknown | SD |
| FER1L6 | SNV | Missense_Mutation | c.2258N>A | p.Cys753Tyr | p.C753Y | Q2WGJ9 | protein_coding | deleterious(0) | probably_damaging(1) | TCGA-AN-A0XW-01 | Breast | breast invasive carcinoma | Female | <65 | III/IV | Unknown | Unknown | SD | |
| FER1L6 | SNV | Missense_Mutation | c.3611N>G | p.Asp1204Gly | p.D1204G | Q2WGJ9 | protein_coding | deleterious(0) | possibly_damaging(0.867) | TCGA-BH-A0BZ-01 | Breast | breast invasive carcinoma | Female | <65 | III/IV | Chemotherapy | doxorubicin | CR | |
| FER1L6 | SNV | Missense_Mutation | novel | c.4921N>A | p.Asp1641Asn | p.D1641N | Q2WGJ9 | protein_coding | deleterious(0) | probably_damaging(1) | TCGA-BH-A0HF-01 | Breast | breast invasive carcinoma | Female | >=65 | I/II | Hormone Therapy | arimidex | SD |
| Page: 1 2 3 4 5 6 7 8 9 10 11 12 13 14 15 16 17 18 19 20 21 22 23 24 25 26 27 |
Top |
Related drugs of malignant transformation related genes |
| Identification of chemicals and drugs interact with genes involved in malignant transfromation |
| (DGIdb 4.0) |
| Entrez ID | Symbol | Category | Interaction Types | Drug Claim Name | Drug Name | PMIDs |
| Page: 1 |

Copyright 2023-Present -The University of Texas Health Science Center at Houston |