
|
|||||
|
 | |
| |
| |
| |
| |
| |
|
Gene: FEN1 |
Gene summary for FEN1 |
| Gene information | Species | Human | Gene symbol | FEN1 | Gene ID | 2237 |
| Gene name | flap structure-specific endonuclease 1 | |
| Gene Alias | FEN-1 | |
| Cytomap | 11q12.2 | |
| Gene Type | protein-coding | GO ID | GO:0000723 | UniProtAcc | P39748 |
Top |
Malignant transformation analysis |
| Identification of the aberrant gene expression in precancerous and cancerous lesions by comparing the gene expression of stem-like cells in diseased tissues with normal stem cells |
| Entrez ID | Symbol | Replicates | Species | Organ | Tissue | Adj P-value | Log2FC | Malignancy |
| 2237 | FEN1 | HTA11_1938_2000001011 | Human | Colorectum | AD | 4.00e-03 | 2.09e-01 | -0.0811 |
| 2237 | FEN1 | HTA11_696_2000001011 | Human | Colorectum | AD | 2.05e-06 | 2.43e-01 | -0.1464 |
| 2237 | FEN1 | HTA11_1391_2000001011 | Human | Colorectum | AD | 2.86e-09 | 3.71e-01 | -0.059 |
| 2237 | FEN1 | HTA11_866_3004761011 | Human | Colorectum | AD | 2.51e-02 | 1.12e-01 | 0.096 |
| 2237 | FEN1 | HTA11_7696_3000711011 | Human | Colorectum | AD | 1.92e-04 | 1.52e-01 | 0.0674 |
| 2237 | FEN1 | HTA11_6818_2000001021 | Human | Colorectum | AD | 1.15e-02 | 1.70e-01 | 0.0588 |
| 2237 | FEN1 | HTA11_99999970781_79442 | Human | Colorectum | MSS | 1.09e-16 | 4.06e-01 | 0.294 |
| 2237 | FEN1 | HTA11_99999965062_69753 | Human | Colorectum | MSI-H | 7.89e-03 | 5.36e-01 | 0.3487 |
| 2237 | FEN1 | HTA11_99999971662_82457 | Human | Colorectum | MSS | 4.38e-06 | 1.99e-01 | 0.3859 |
| 2237 | FEN1 | HTA11_99999973899_84307 | Human | Colorectum | MSS | 1.46e-02 | 2.13e-01 | 0.2585 |
| 2237 | FEN1 | LZE2T | Human | Esophagus | ESCC | 4.73e-03 | 5.42e-01 | 0.082 |
| 2237 | FEN1 | LZE7T | Human | Esophagus | ESCC | 2.07e-15 | 6.79e-01 | 0.0667 |
| 2237 | FEN1 | LZE24T | Human | Esophagus | ESCC | 3.17e-06 | 1.51e-01 | 0.0596 |
| 2237 | FEN1 | LZE21T | Human | Esophagus | ESCC | 6.52e-03 | 1.62e-01 | 0.0655 |
| 2237 | FEN1 | LZE6T | Human | Esophagus | ESCC | 9.61e-05 | 2.15e-01 | 0.0845 |
| 2237 | FEN1 | P1T-E | Human | Esophagus | ESCC | 2.44e-06 | 2.76e-01 | 0.0875 |
| 2237 | FEN1 | P2T-E | Human | Esophagus | ESCC | 3.34e-28 | 7.43e-01 | 0.1177 |
| 2237 | FEN1 | P4T-E | Human | Esophagus | ESCC | 1.44e-19 | 5.65e-01 | 0.1323 |
| 2237 | FEN1 | P5T-E | Human | Esophagus | ESCC | 1.28e-13 | 3.53e-01 | 0.1327 |
| 2237 | FEN1 | P8T-E | Human | Esophagus | ESCC | 2.42e-16 | 5.09e-01 | 0.0889 |
| Page: 1 2 3 4 5 6 |
| Tissue | Expression Dynamics | Abbreviation |
| Colorectum (GSE201348) |  | FAP: Familial adenomatous polyposis |
| CRC: Colorectal cancer | ||
| Colorectum (HTA11) | 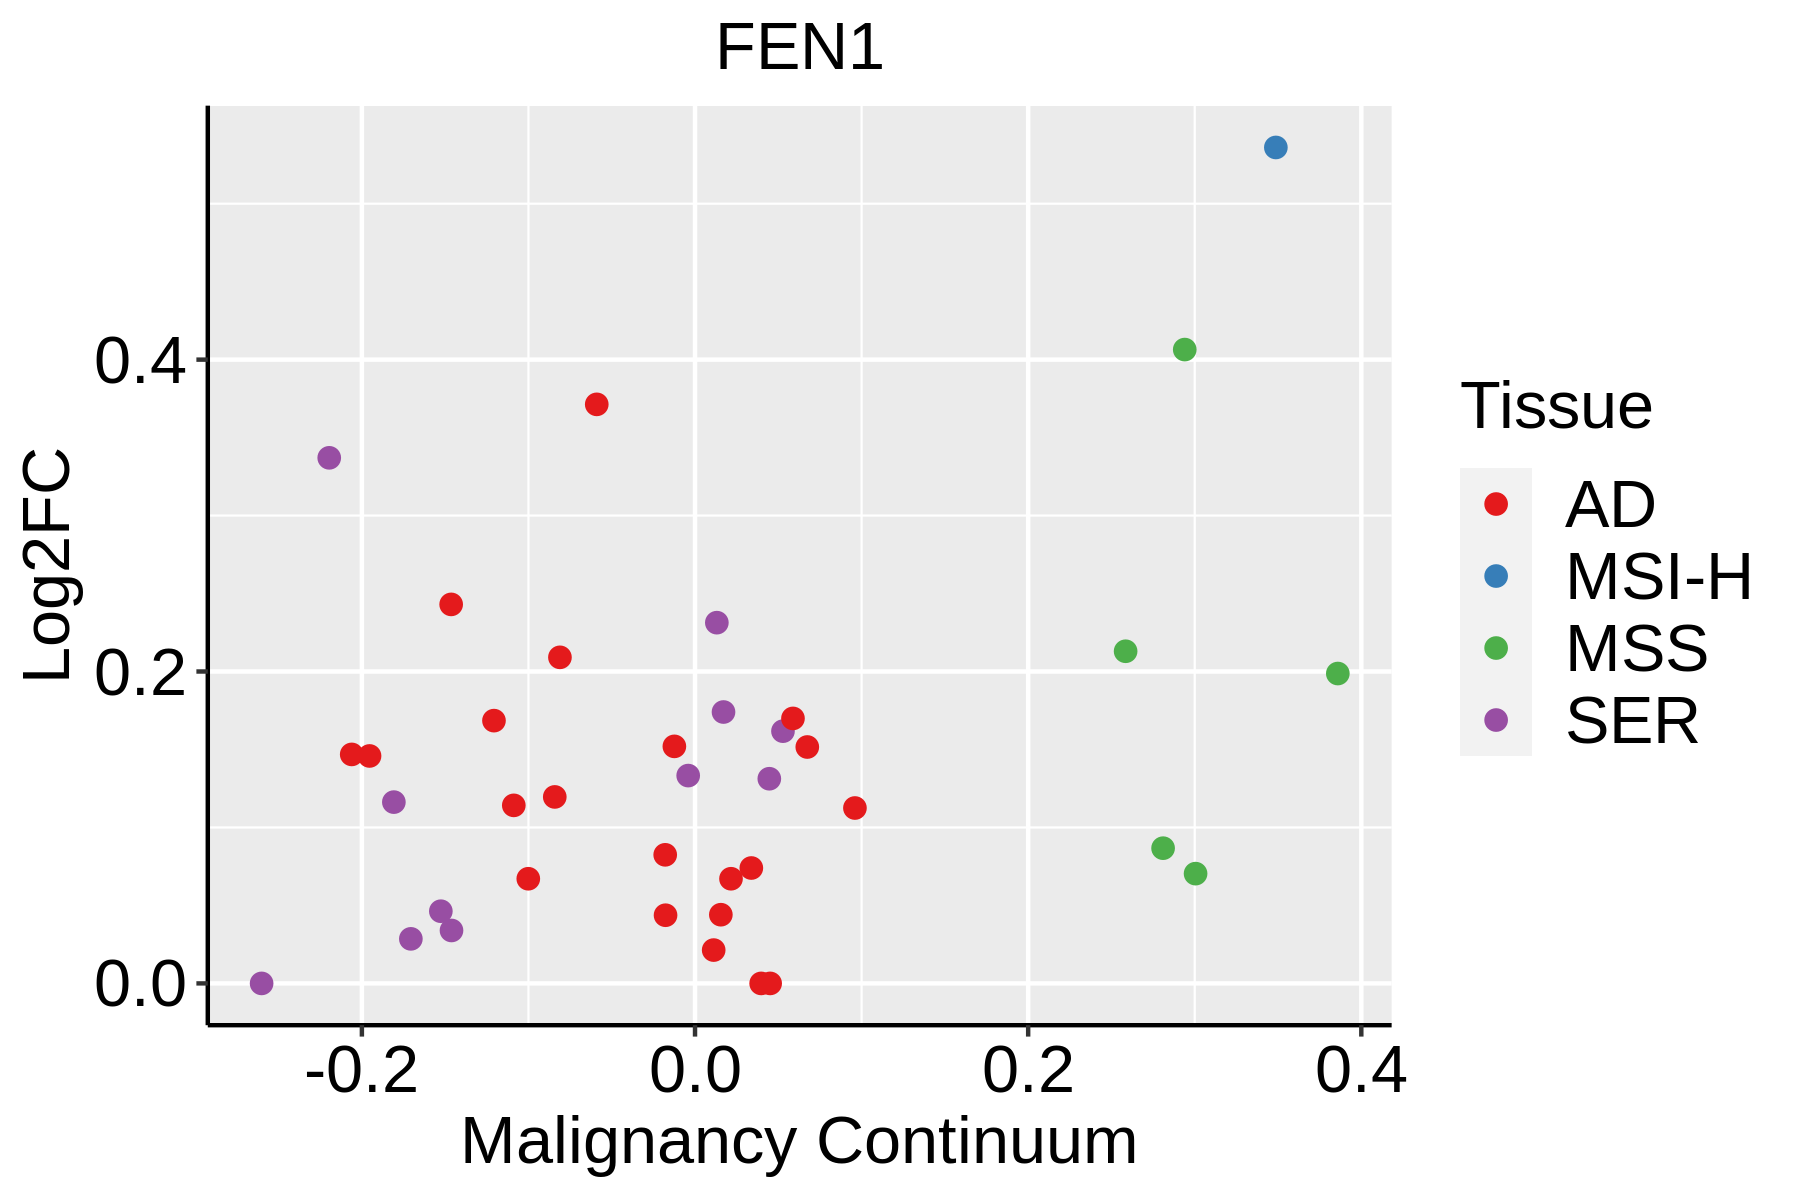 | AD: Adenomas |
| SER: Sessile serrated lesions | ||
| MSI-H: Microsatellite-high colorectal cancer | ||
| MSS: Microsatellite stable colorectal cancer | ||
| Esophagus | 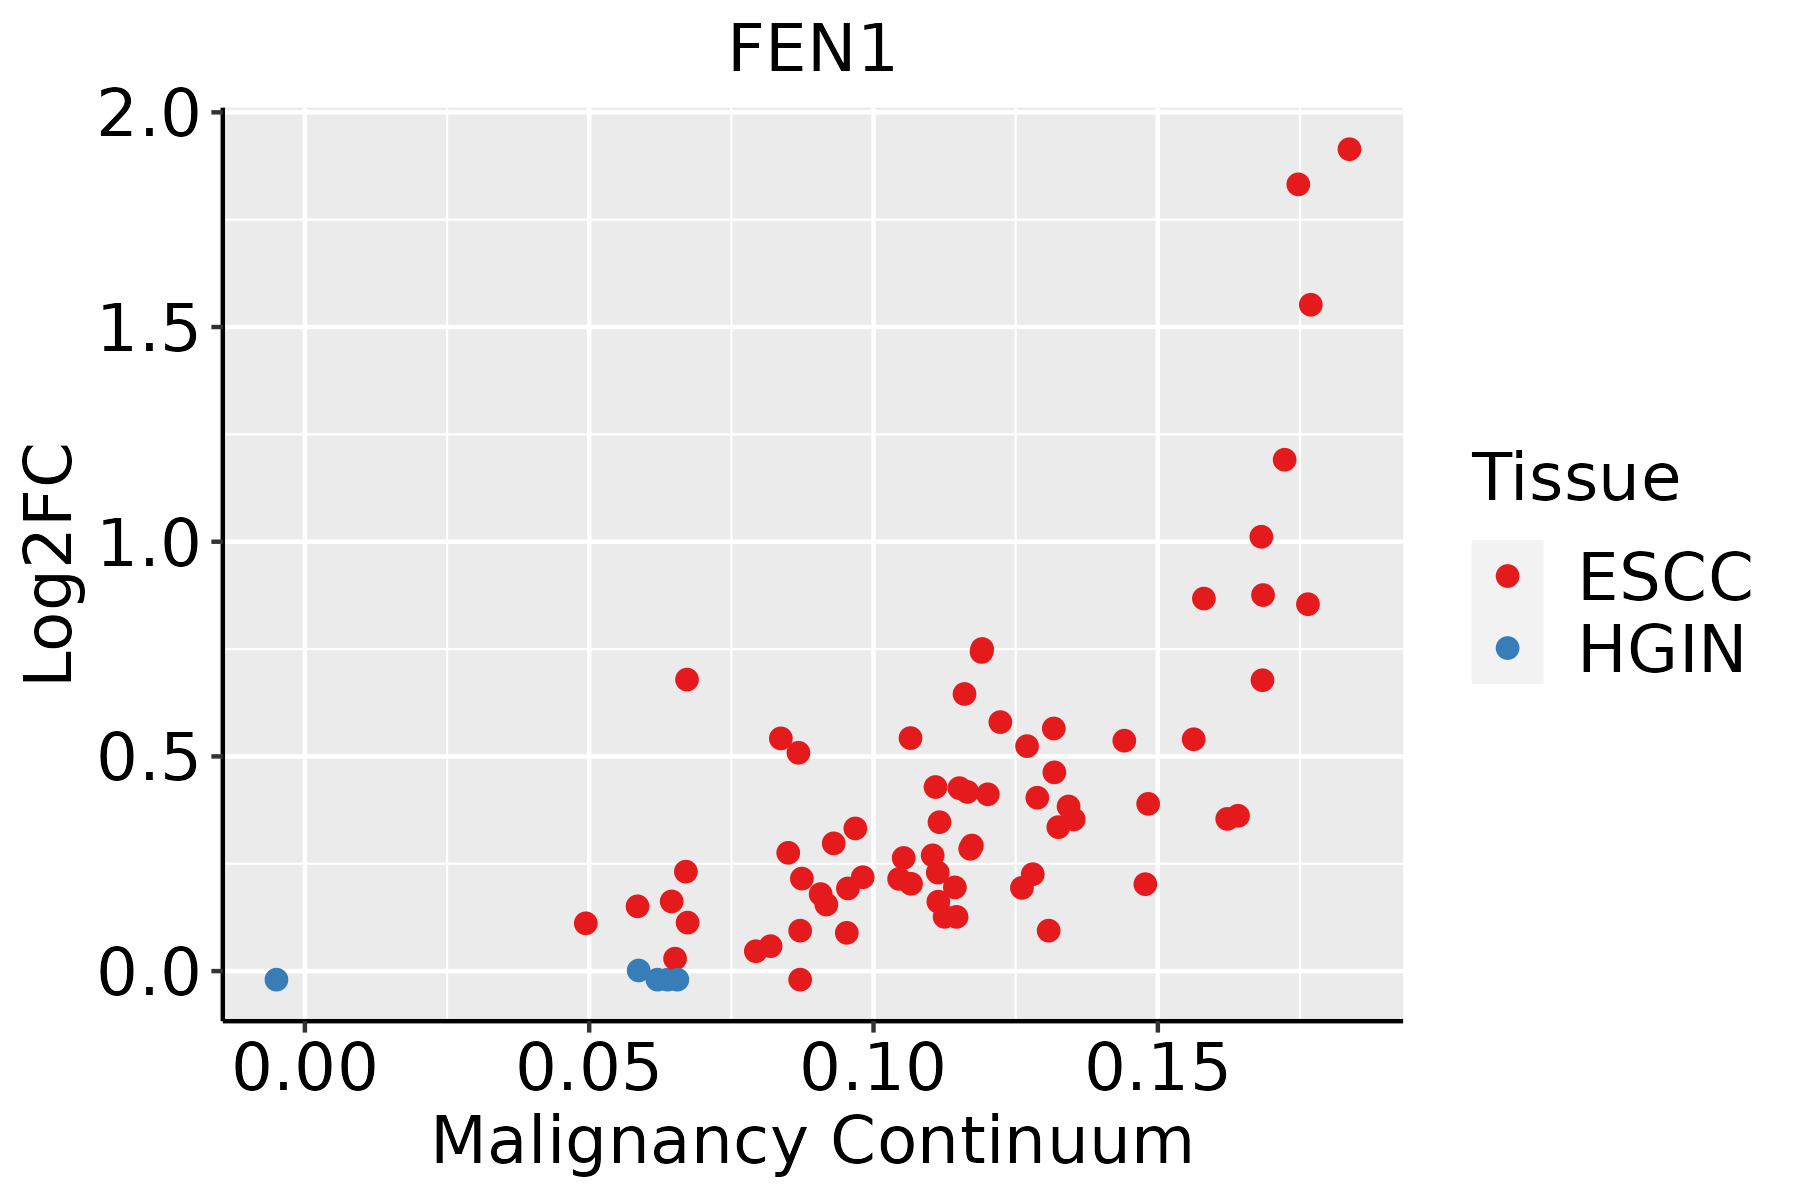 | ESCC: Esophageal squamous cell carcinoma |
| HGIN: High-grade intraepithelial neoplasias | ||
| LGIN: Low-grade intraepithelial neoplasias | ||
| Liver | 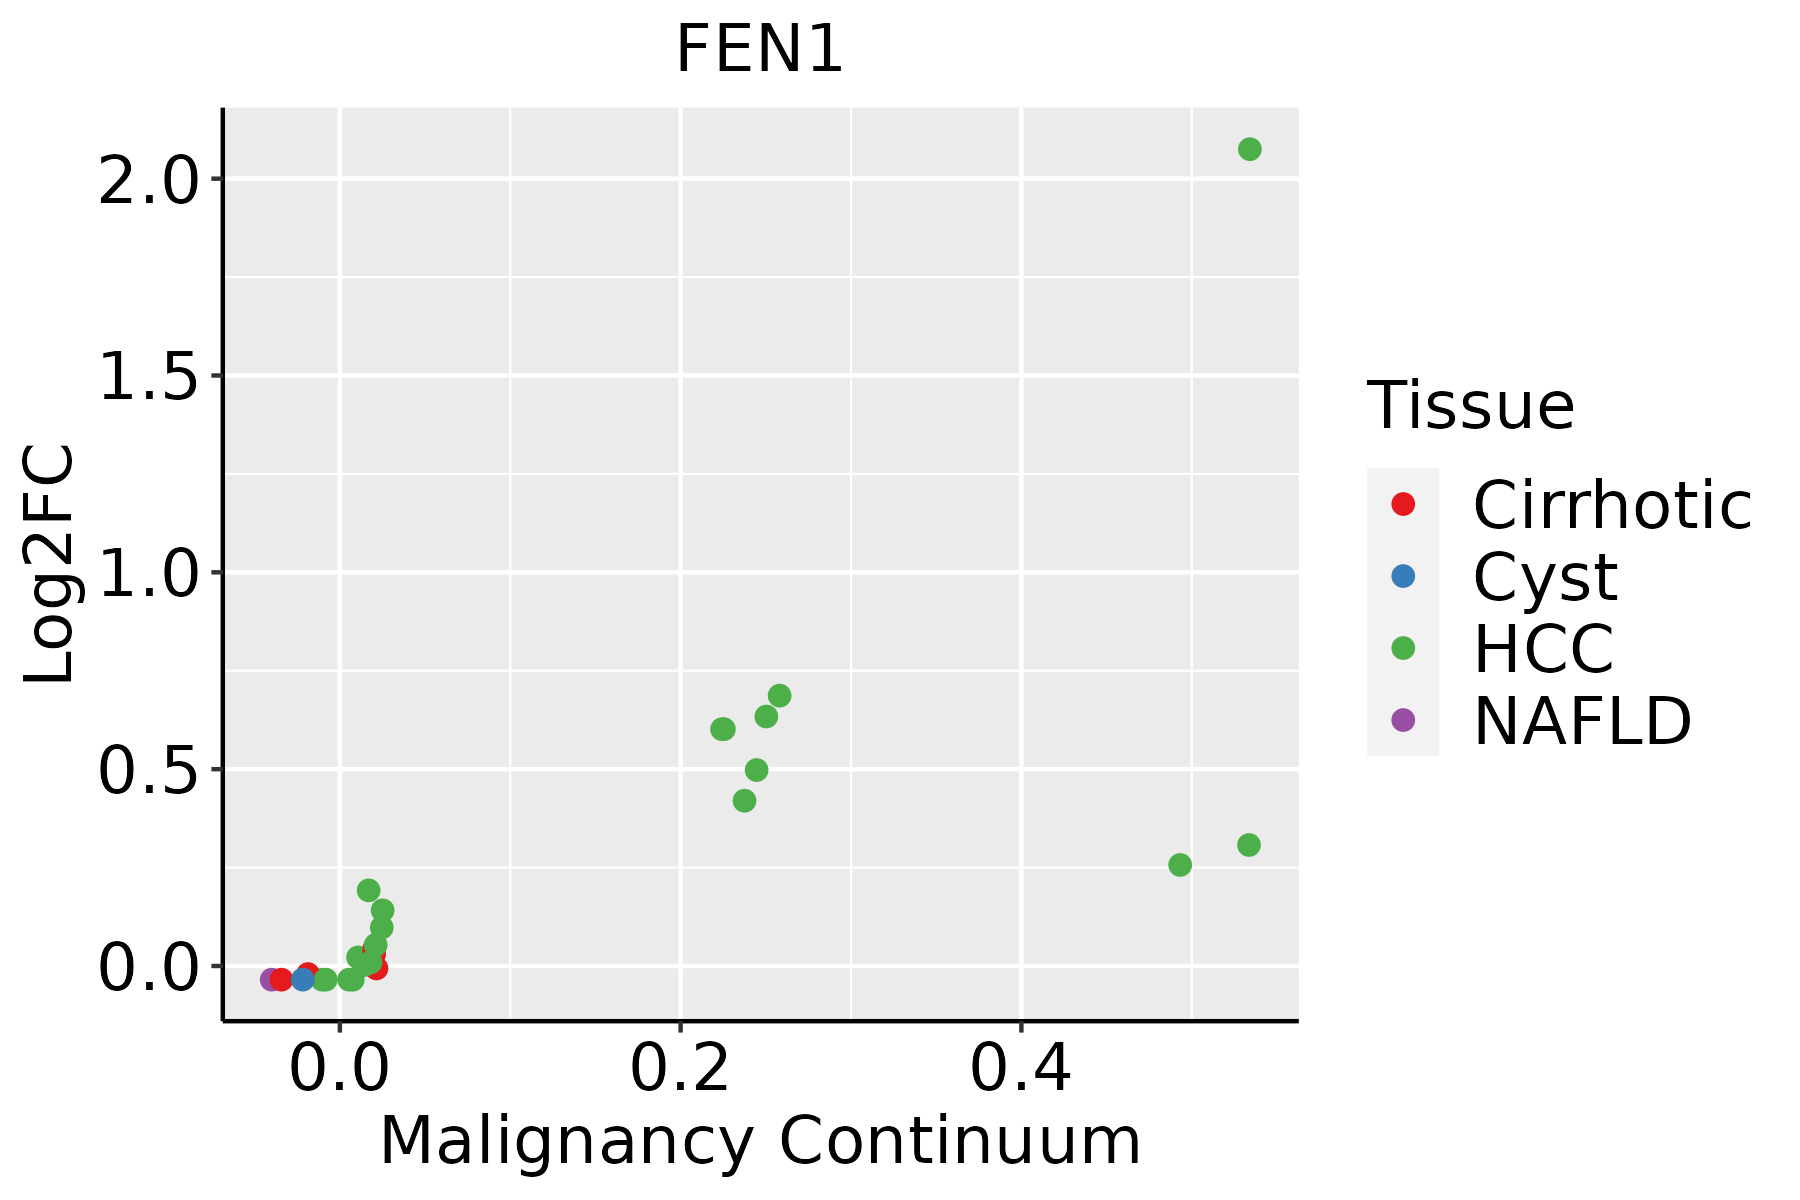 | HCC: Hepatocellular carcinoma |
| NAFLD: Non-alcoholic fatty liver disease | ||
| Oral Cavity |  | EOLP: Erosive Oral lichen planus |
| LP: leukoplakia | ||
| NEOLP: Non-erosive oral lichen planus | ||
| OSCC: Oral squamous cell carcinoma | ||
| Skin | 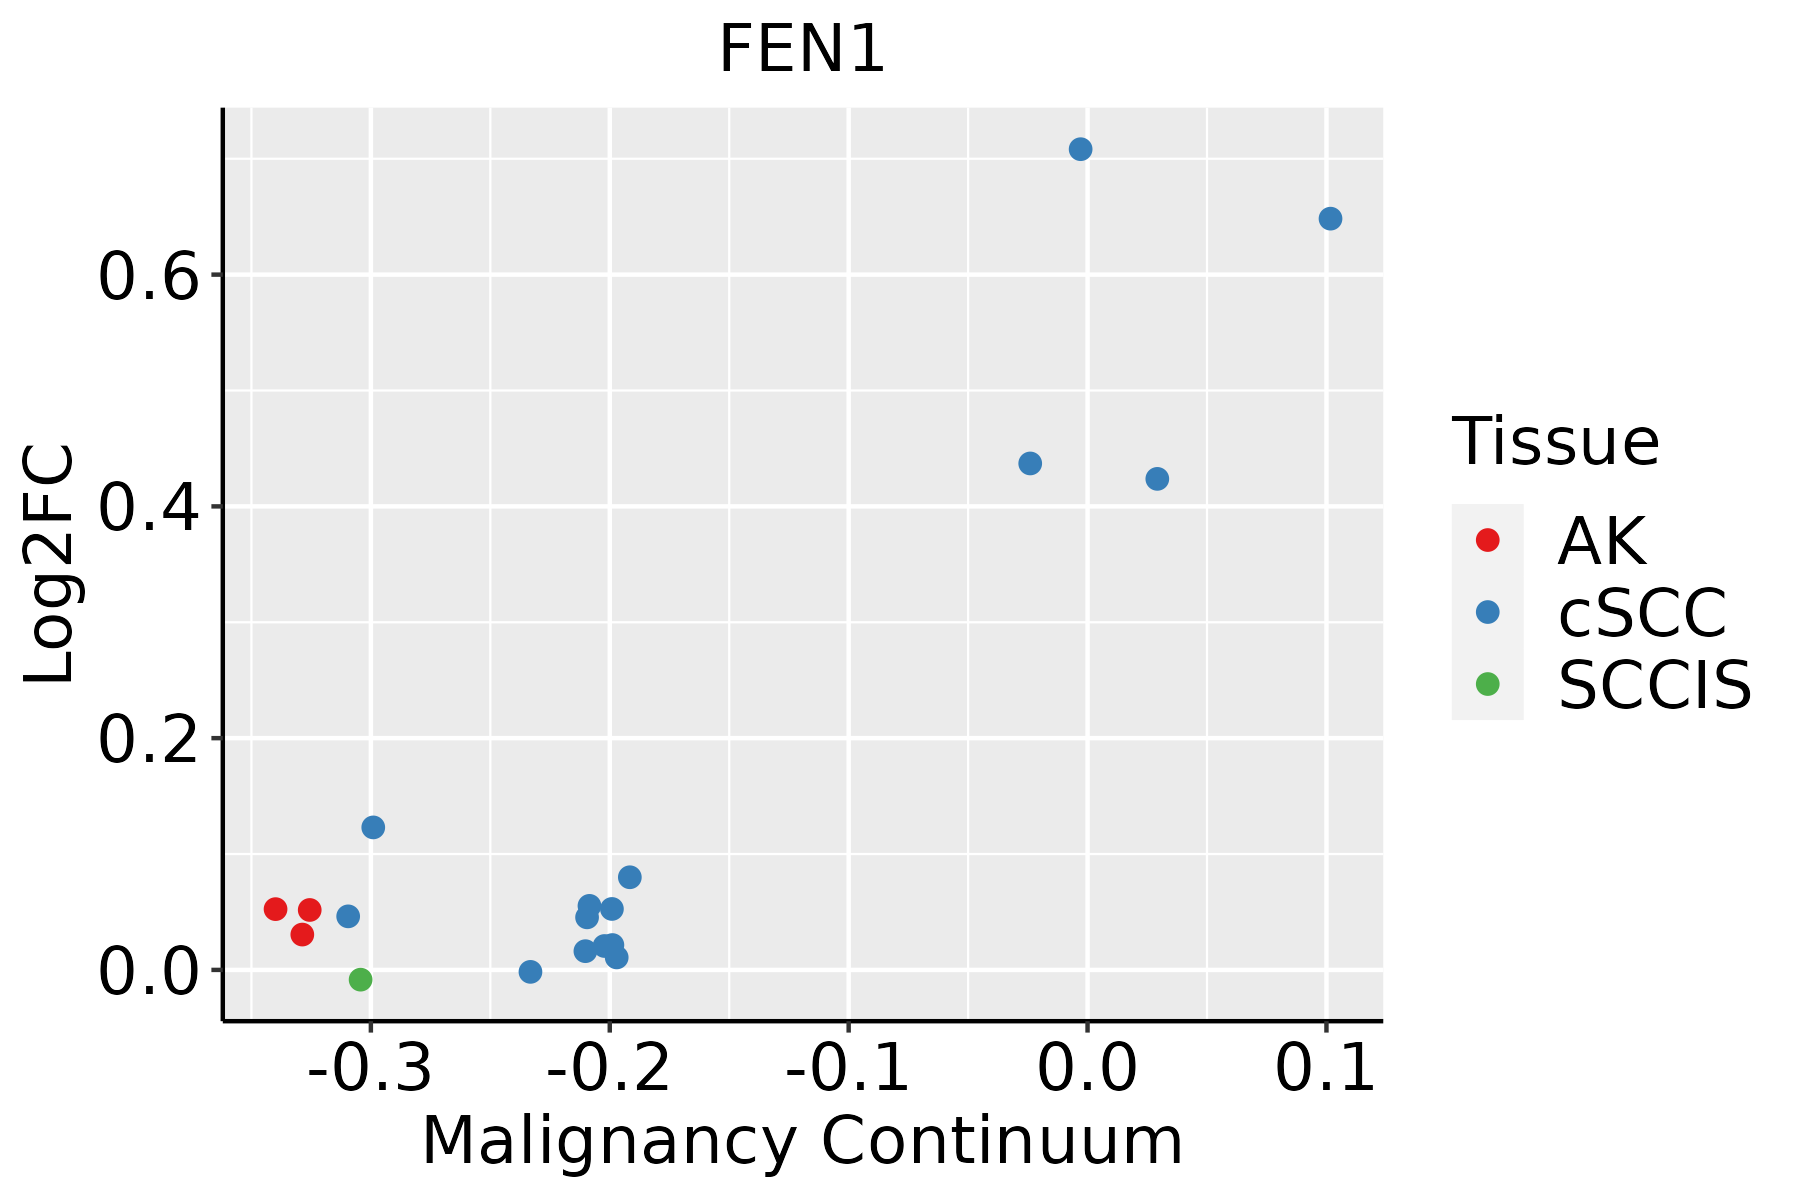 | AK: Actinic keratosis |
| cSCC: Cutaneous squamous cell carcinoma | ||
| SCCIS:squamous cell carcinoma in situ | ||
| Thyroid | 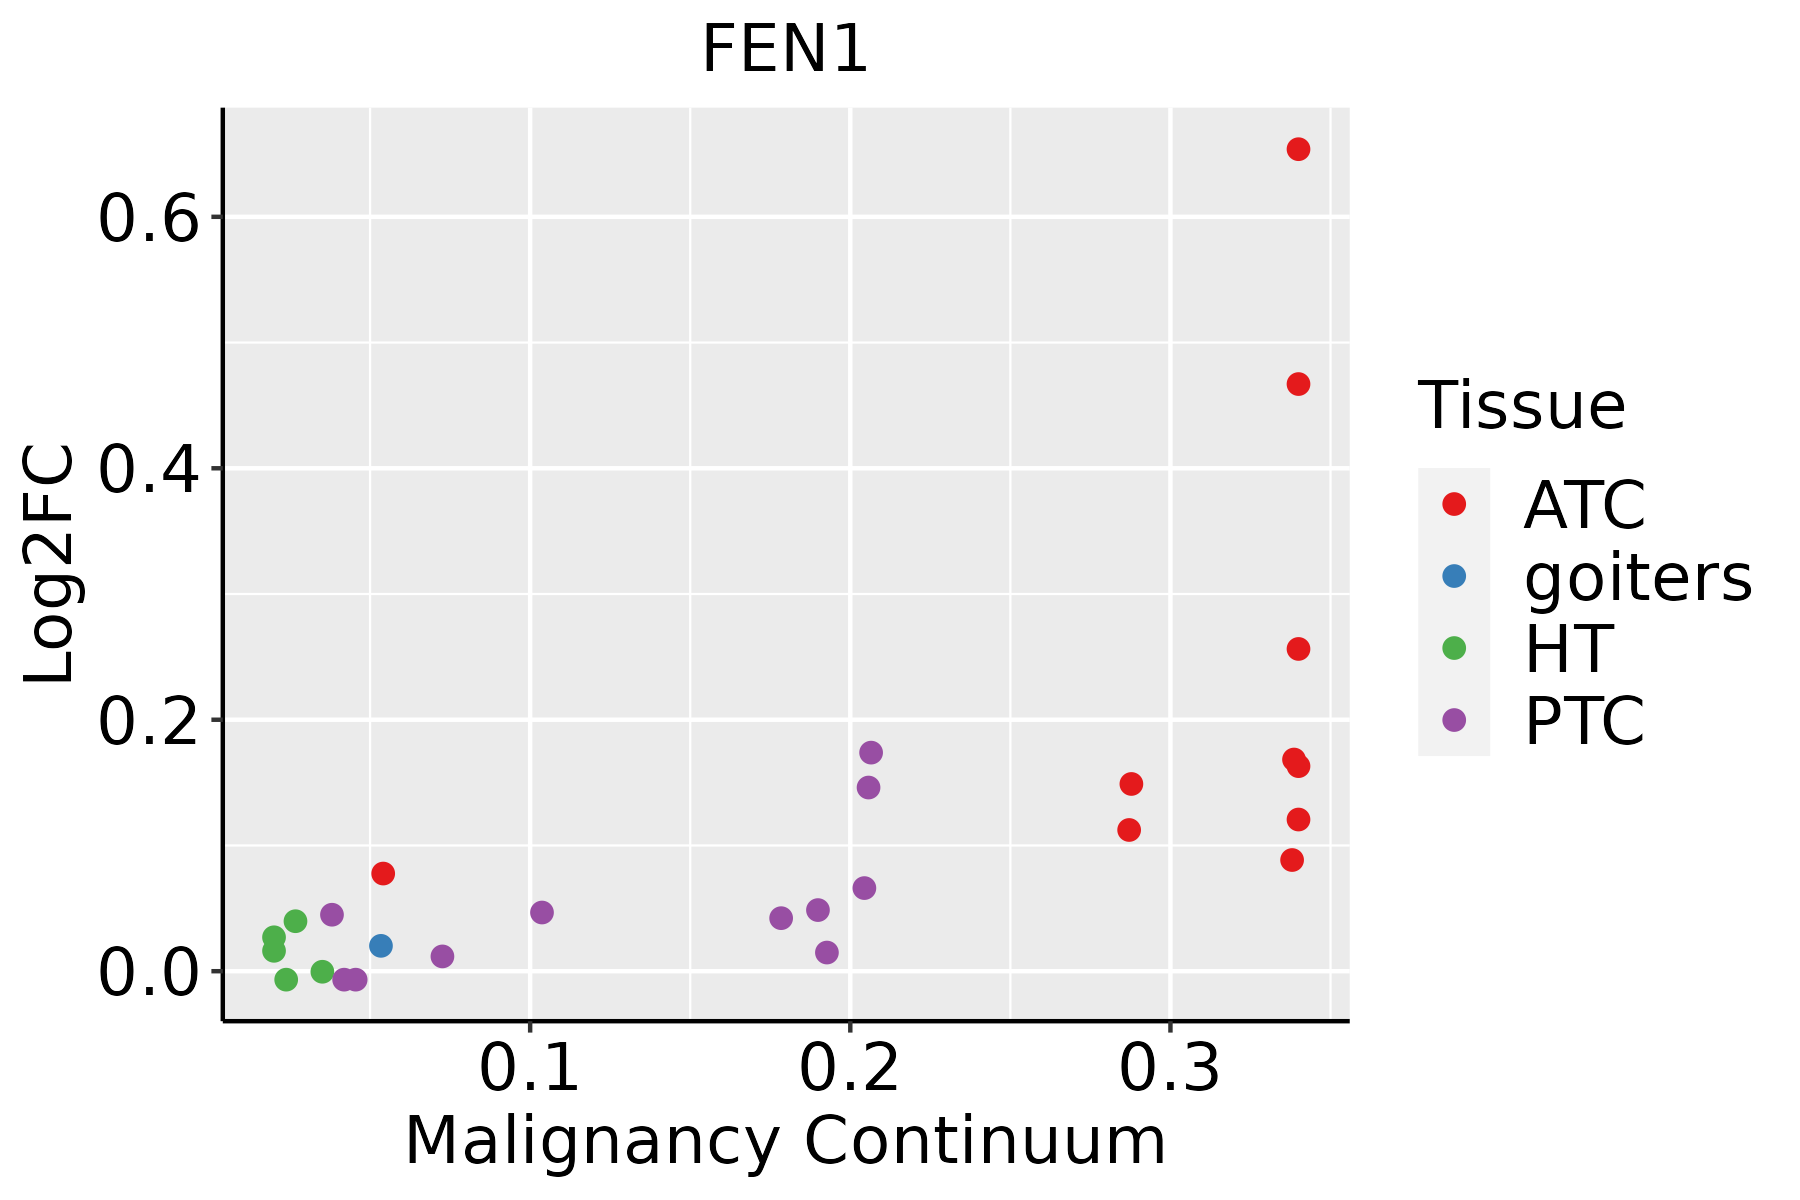 | ATC: Anaplastic thyroid cancer |
| HT: Hashimoto's thyroiditis | ||
| PTC: Papillary thyroid cancer |
| ∗log2FC in expression of this searched gene in stem-like cells from each diseased tissue sample relative to stem-like cells in normal samples in each tissue plotted against the malignancy continuum. Samples are colored based on if they are from different disease stage. |
Top |
Malignant transformation related pathway analysis |
| Find out the enriched GO biological processes and KEGG pathways involved in transition from healthy to precancer to cancer |
| Tissue | Disease Stage | Enriched GO biological Processes |
| Colorectum | AD |  |
| Colorectum | SER |  |
| Colorectum | MSS |  |
| Colorectum | MSI-H |  |
| Colorectum | FAP |  |
| ∗Top 15 enriched GO BP terms are showed in the bar plot of each disease state in each tissue. Each row represents a significant GO biological process which is colored according to the -log10(p.adjust). |
| Page: 1 2 3 4 5 6 7 8 9 |
| GO ID | Tissue | Disease Stage | Description | Gene Ratio | Bg Ratio | pvalue | p.adjust | Count |
| GO:0006401 | Colorectum | AD | RNA catabolic process | 102/3918 | 278/18723 | 8.64e-10 | 6.76e-08 | 102 |
| GO:0044270 | Colorectum | AD | cellular nitrogen compound catabolic process | 147/3918 | 451/18723 | 3.35e-09 | 2.23e-07 | 147 |
| GO:0046700 | Colorectum | AD | heterocycle catabolic process | 145/3918 | 445/18723 | 4.37e-09 | 2.84e-07 | 145 |
| GO:0034655 | Colorectum | AD | nucleobase-containing compound catabolic process | 133/3918 | 407/18723 | 1.56e-08 | 9.12e-07 | 133 |
| GO:0019439 | Colorectum | AD | aromatic compound catabolic process | 146/3918 | 467/18723 | 7.48e-08 | 3.84e-06 | 146 |
| GO:1901361 | Colorectum | AD | organic cyclic compound catabolic process | 153/3918 | 495/18723 | 8.23e-08 | 4.18e-06 | 153 |
| GO:2001252 | Colorectum | AD | positive regulation of chromosome organization | 35/3918 | 82/18723 | 6.90e-06 | 1.72e-04 | 35 |
| GO:0033044 | Colorectum | AD | regulation of chromosome organization | 60/3918 | 187/18723 | 2.25e-04 | 2.94e-03 | 60 |
| GO:0007063 | Colorectum | AD | regulation of sister chromatid cohesion | 12/3918 | 21/18723 | 3.02e-04 | 3.62e-03 | 12 |
| GO:0000723 | Colorectum | AD | telomere maintenance | 43/3918 | 131/18723 | 9.77e-04 | 9.20e-03 | 43 |
| GO:0007062 | Colorectum | AD | sister chromatid cohesion | 23/3918 | 62/18723 | 2.51e-03 | 1.92e-02 | 23 |
| GO:0045787 | Colorectum | AD | positive regulation of cell cycle | 85/3918 | 313/18723 | 4.76e-03 | 3.22e-02 | 85 |
| GO:00064012 | Colorectum | MSS | RNA catabolic process | 102/3467 | 278/18723 | 5.07e-13 | 1.02e-10 | 102 |
| GO:00442702 | Colorectum | MSS | cellular nitrogen compound catabolic process | 141/3467 | 451/18723 | 2.95e-11 | 3.83e-09 | 141 |
| GO:00467002 | Colorectum | MSS | heterocycle catabolic process | 139/3467 | 445/18723 | 4.37e-11 | 5.05e-09 | 139 |
| GO:00346552 | Colorectum | MSS | nucleobase-containing compound catabolic process | 129/3467 | 407/18723 | 7.48e-11 | 8.18e-09 | 129 |
| GO:19013612 | Colorectum | MSS | organic cyclic compound catabolic process | 148/3467 | 495/18723 | 3.47e-10 | 3.18e-08 | 148 |
| GO:00194392 | Colorectum | MSS | aromatic compound catabolic process | 140/3467 | 467/18723 | 8.56e-10 | 6.85e-08 | 140 |
| GO:20012522 | Colorectum | MSS | positive regulation of chromosome organization | 33/3467 | 82/18723 | 3.72e-06 | 1.07e-04 | 33 |
| GO:00330441 | Colorectum | MSS | regulation of chromosome organization | 55/3467 | 187/18723 | 1.86e-04 | 2.63e-03 | 55 |
| Page: 1 2 3 4 5 6 7 8 9 10 11 |
| Pathway ID | Tissue | Disease Stage | Description | Gene Ratio | Bg Ratio | pvalue | p.adjust | qvalue | Count |
| hsa03410 | Oral cavity | OSCC | Base excision repair | 32/3704 | 44/8465 | 9.11e-05 | 3.25e-04 | 1.65e-04 | 32 |
| hsa034101 | Oral cavity | OSCC | Base excision repair | 32/3704 | 44/8465 | 9.11e-05 | 3.25e-04 | 1.65e-04 | 32 |
| hsa030302 | Oral cavity | LP | DNA replication | 23/2418 | 36/8465 | 1.08e-05 | 7.79e-05 | 5.02e-05 | 23 |
| hsa034102 | Oral cavity | LP | Base excision repair | 23/2418 | 44/8465 | 7.66e-04 | 3.75e-03 | 2.42e-03 | 23 |
| hsa030303 | Oral cavity | LP | DNA replication | 23/2418 | 36/8465 | 1.08e-05 | 7.79e-05 | 5.02e-05 | 23 |
| hsa034103 | Oral cavity | LP | Base excision repair | 23/2418 | 44/8465 | 7.66e-04 | 3.75e-03 | 2.42e-03 | 23 |
| Page: 1 |
Top |
Cell-cell communication analysis |
| Identification of potential cell-cell interactions between two cell types and their ligand-receptor pairs for different disease states |
| Ligand | Receptor | LRpair | Pathway | Tissue | Disease Stage |
| Page: 1 |
Top |
Single-cell gene regulatory network inference analysis |
| Find out the significant the regulons (TFs) and the target genes of each regulon across cell types for different disease states |
| TF | Cell Type | Tissue | Disease Stage | Target Gene | RSS | Regulon Activity |
| ∗The dot plots of a searched regulon are shown for all cell subpopulations in each disease state of each tissue based on the regulon specific score inferred using pySCENIC and by calculating the average expression. |
| Page: 1 |
Top |
Somatic mutation of malignant transformation related genes |
| Annotation of somatic variants for genes involved in malignant transformation |
| Hugo Symbol | Variant Class | Variant Classification | dbSNP RS | HGVSc | HGVSp | HGVSp Short | SWISSPROT | BIOTYPE | SIFT | PolyPhen | Tumor Sample Barcode | Tissue | Histology | Sex | Age | Stage | Therapy Types | Drugs | Outcome |
| FEN1 | SNV | Missense_Mutation | c.788N>A | p.Leu263His | p.L263H | P39748 | protein_coding | deleterious(0) | possibly_damaging(0.735) | TCGA-A8-A06X-01 | Breast | breast invasive carcinoma | Female | >=65 | I/II | Unknown | Unknown | SD | |
| FEN1 | SNV | Missense_Mutation | novel | c.394A>G | p.Lys132Glu | p.K132E | P39748 | protein_coding | deleterious(0) | benign(0.398) | TCGA-B6-A0IN-01 | Breast | breast invasive carcinoma | Female | <65 | I/II | Unknown | Unknown | PD |
| FEN1 | SNV | Missense_Mutation | c.607N>T | p.Pro203Ser | p.P203S | P39748 | protein_coding | deleterious(0) | benign(0.366) | TCGA-AA-3713-01 | Colorectum | colon adenocarcinoma | Male | >=65 | III/IV | Chemotherapy | 5-fluorouracil | PR | |
| FEN1 | SNV | Missense_Mutation | c.60N>T | p.Glu20Asp | p.E20D | P39748 | protein_coding | deleterious(0.03) | possibly_damaging(0.746) | TCGA-AA-A010-01 | Colorectum | colon adenocarcinoma | Female | <65 | I/II | Chemotherapy | folinic | CR | |
| FEN1 | SNV | Missense_Mutation | c.733C>G | p.Arg245Gly | p.R245G | P39748 | protein_coding | tolerated(0.06) | benign(0.433) | TCGA-AA-A022-01 | Colorectum | colon adenocarcinoma | Female | >=65 | I/II | Unknown | Unknown | SD | |
| FEN1 | SNV | Missense_Mutation | rs573495657 | c.1016N>A | p.Arg339His | p.R339H | P39748 | protein_coding | deleterious(0) | probably_damaging(0.996) | TCGA-D5-6928-01 | Colorectum | colon adenocarcinoma | Male | >=65 | I/II | Unknown | Unknown | SD |
| FEN1 | SNV | Missense_Mutation | rs573495657 | c.1016N>A | p.Arg339His | p.R339H | P39748 | protein_coding | deleterious(0) | probably_damaging(0.996) | TCGA-AG-3728-01 | Colorectum | rectum adenocarcinoma | Male | >=65 | III/IV | Chemotherapy | folinic | CR |
| FEN1 | SNV | Missense_Mutation | novel | c.986N>A | p.Ser329Asn | p.S329N | P39748 | protein_coding | tolerated(0.14) | benign(0) | TCGA-AG-A002-01 | Colorectum | rectum adenocarcinoma | Male | <65 | I/II | Unknown | Unknown | SD |
| FEN1 | SNV | Missense_Mutation | novel | c.742N>A | p.Asp248Asn | p.D248N | P39748 | protein_coding | tolerated(0.07) | benign(0.091) | TCGA-A5-A0G2-01 | Endometrium | uterine corpus endometrioid carcinoma | Female | <65 | III/IV | Unknown | Unknown | SD |
| FEN1 | SNV | Missense_Mutation | novel | c.1043N>A | p.Gly348Asp | p.G348D | P39748 | protein_coding | tolerated(0.09) | benign(0.192) | TCGA-A5-A0G2-01 | Endometrium | uterine corpus endometrioid carcinoma | Female | <65 | III/IV | Unknown | Unknown | SD |
| Page: 1 2 3 |
Top |
Related drugs of malignant transformation related genes |
| Identification of chemicals and drugs interact with genes involved in malignant transfromation |
| (DGIdb 4.0) |
| Entrez ID | Symbol | Category | Interaction Types | Drug Claim Name | Drug Name | PMIDs |
| 2237 | FEN1 | DNA REPAIR, DRUGGABLE GENOME, ENZYME | NSC-106547 | CHEMBL223575 | ||
| 2237 | FEN1 | DNA REPAIR, DRUGGABLE GENOME, ENZYME | GOSSYPOL | GOSSYPOL | ||
| 2237 | FEN1 | DNA REPAIR, DRUGGABLE GENOME, ENZYME | TYRPHOSTIN 23 | TYRPHOSTIN 23 | ||
| 2237 | FEN1 | DNA REPAIR, DRUGGABLE GENOME, ENZYME | SRT-1720 | CHEMBL257991 | ||
| 2237 | FEN1 | DNA REPAIR, DRUGGABLE GENOME, ENZYME | 5,6,7,8,4'-PENTAHYDROXYFLAVONE | CHEMBL234338 | ||
| 2237 | FEN1 | DNA REPAIR, DRUGGABLE GENOME, ENZYME | APOMORPHINE HYDROCHLORIDE HEMIHYDRATE | APOMORPHINE HYDROCHLORIDE HEMIHYDRATE | ||
| 2237 | FEN1 | DNA REPAIR, DRUGGABLE GENOME, ENZYME | NOREPINEPHRINE | NOREPINEPHRINE | ||
| 2237 | FEN1 | DNA REPAIR, DRUGGABLE GENOME, ENZYME | CCG-63802 | CHEMBL1476646 | ||
| 2237 | FEN1 | DNA REPAIR, DRUGGABLE GENOME, ENZYME | BENSERAZIDE HYDROCHLORIDE | BENSERAZIDE HYDROCHLORIDE | ||
| 2237 | FEN1 | DNA REPAIR, DRUGGABLE GENOME, ENZYME | METHACYCLINE HYDROCHLORIDE | METHACYCLINE HYDROCHLORIDE |
| Page: 1 2 3 4 5 6 7 8 9 10 11 12 13 14 15 16 17 18 19 20 |

Copyright 2023-Present -The University of Texas Health Science Center at Houston |