Schematic overview of the cellular and molecular mechanisms involved in the cancer progression, including the proposed cellular and molecular mechanisms in cancer cells trajectory. AT1: alveolar type 1 cells; AT2: alveolar type 2 cells; AAH: atypical adenomatous hyperplasia; AIS: adenocarcinoma in situ; MIA: minimally invasive adenocarcinoma; IA: invasive adenocarcinoma; EMT: epithelial-mesenchymal transition

Home

Download

Statistics

Help

Contact

Center for Computational Systems Medicine
leaf

Gene summary

leaf

Malignant transformation analysis

leaf

Malignant transformation related pathway analysis

leaf

Cell-cell communication analysis

leaf

Single-cell gene regulatory network inference analysis

leaf

Somatic mutation of malignant transformation related genes

leaf

Related drugs of malignant transformation related genes

Gene: FEM1B

Gene summary for FEM1B

check button Gene summary.

Gene informationSpeciesHuman
Gene symbol

FEM1B

Gene ID

10116

Gene namefem-1 homolog B
Gene AliasF1A-ALPHA
Cytomap15q23
Gene Typeprotein-coding
GO ID

GO:0000003

UniProtAcc

Q9UK73


Top

Malignant transformation analysis

check button Identification of the aberrant gene expression in precancerous and cancerous lesions by comparing the gene expression of stem-like cells in diseased tissues with normal stem cells
check button Malignant transformation involving gene list.
Entrez IDSymbolReplicatesSpeciesOrganTissueAdj P-valueLog2FCMalignancy
10116FEM1BLZE4THumanEsophagusESCC1.02e-043.26e-010.0811
10116FEM1BLZE7THumanEsophagusESCC2.74e-061.54e-010.0667
10116FEM1BLZE8THumanEsophagusESCC3.79e-03-4.09e-020.067
10116FEM1BLZE24THumanEsophagusESCC1.49e-131.52e-010.0596
10116FEM1BLZE21THumanEsophagusESCC6.82e-091.69e-010.0655
10116FEM1BLZE6THumanEsophagusESCC7.51e-037.36e-030.0845
10116FEM1BP1T-EHumanEsophagusESCC9.78e-102.98e-010.0875
10116FEM1BP2T-EHumanEsophagusESCC1.98e-234.72e-010.1177
10116FEM1BP4T-EHumanEsophagusESCC2.81e-154.08e-010.1323
10116FEM1BP5T-EHumanEsophagusESCC1.29e-092.75e-010.1327
10116FEM1BP8T-EHumanEsophagusESCC5.31e-222.41e-010.0889
10116FEM1BP9T-EHumanEsophagusESCC9.72e-133.91e-010.1131
10116FEM1BP10T-EHumanEsophagusESCC9.57e-254.08e-010.116
10116FEM1BP11T-EHumanEsophagusESCC3.04e-062.69e-010.1426
10116FEM1BP12T-EHumanEsophagusESCC2.43e-244.34e-010.1122
10116FEM1BP15T-EHumanEsophagusESCC4.30e-235.82e-010.1149
10116FEM1BP16T-EHumanEsophagusESCC3.16e-214.49e-010.1153
10116FEM1BP20T-EHumanEsophagusESCC1.06e-078.26e-020.1124
10116FEM1BP21T-EHumanEsophagusESCC7.92e-161.31e-010.1617
10116FEM1BP22T-EHumanEsophagusESCC5.36e-151.82e-010.1236
Page: 1 2 3 4 5 6 

check button Transcriptomic changes along malignancy continuum.
TissueExpression DynamicsAbbreviation
EsophagusThe image shows the transcriptomic changes along malignancy continuum.log2FC in expression of this searched gene in stem-like cells from each diseased tissue sample relative to stem-like cells in normal samples in each tissue plotted against the malignancy continuum. Samples are colored based on if they are from different disease stage.
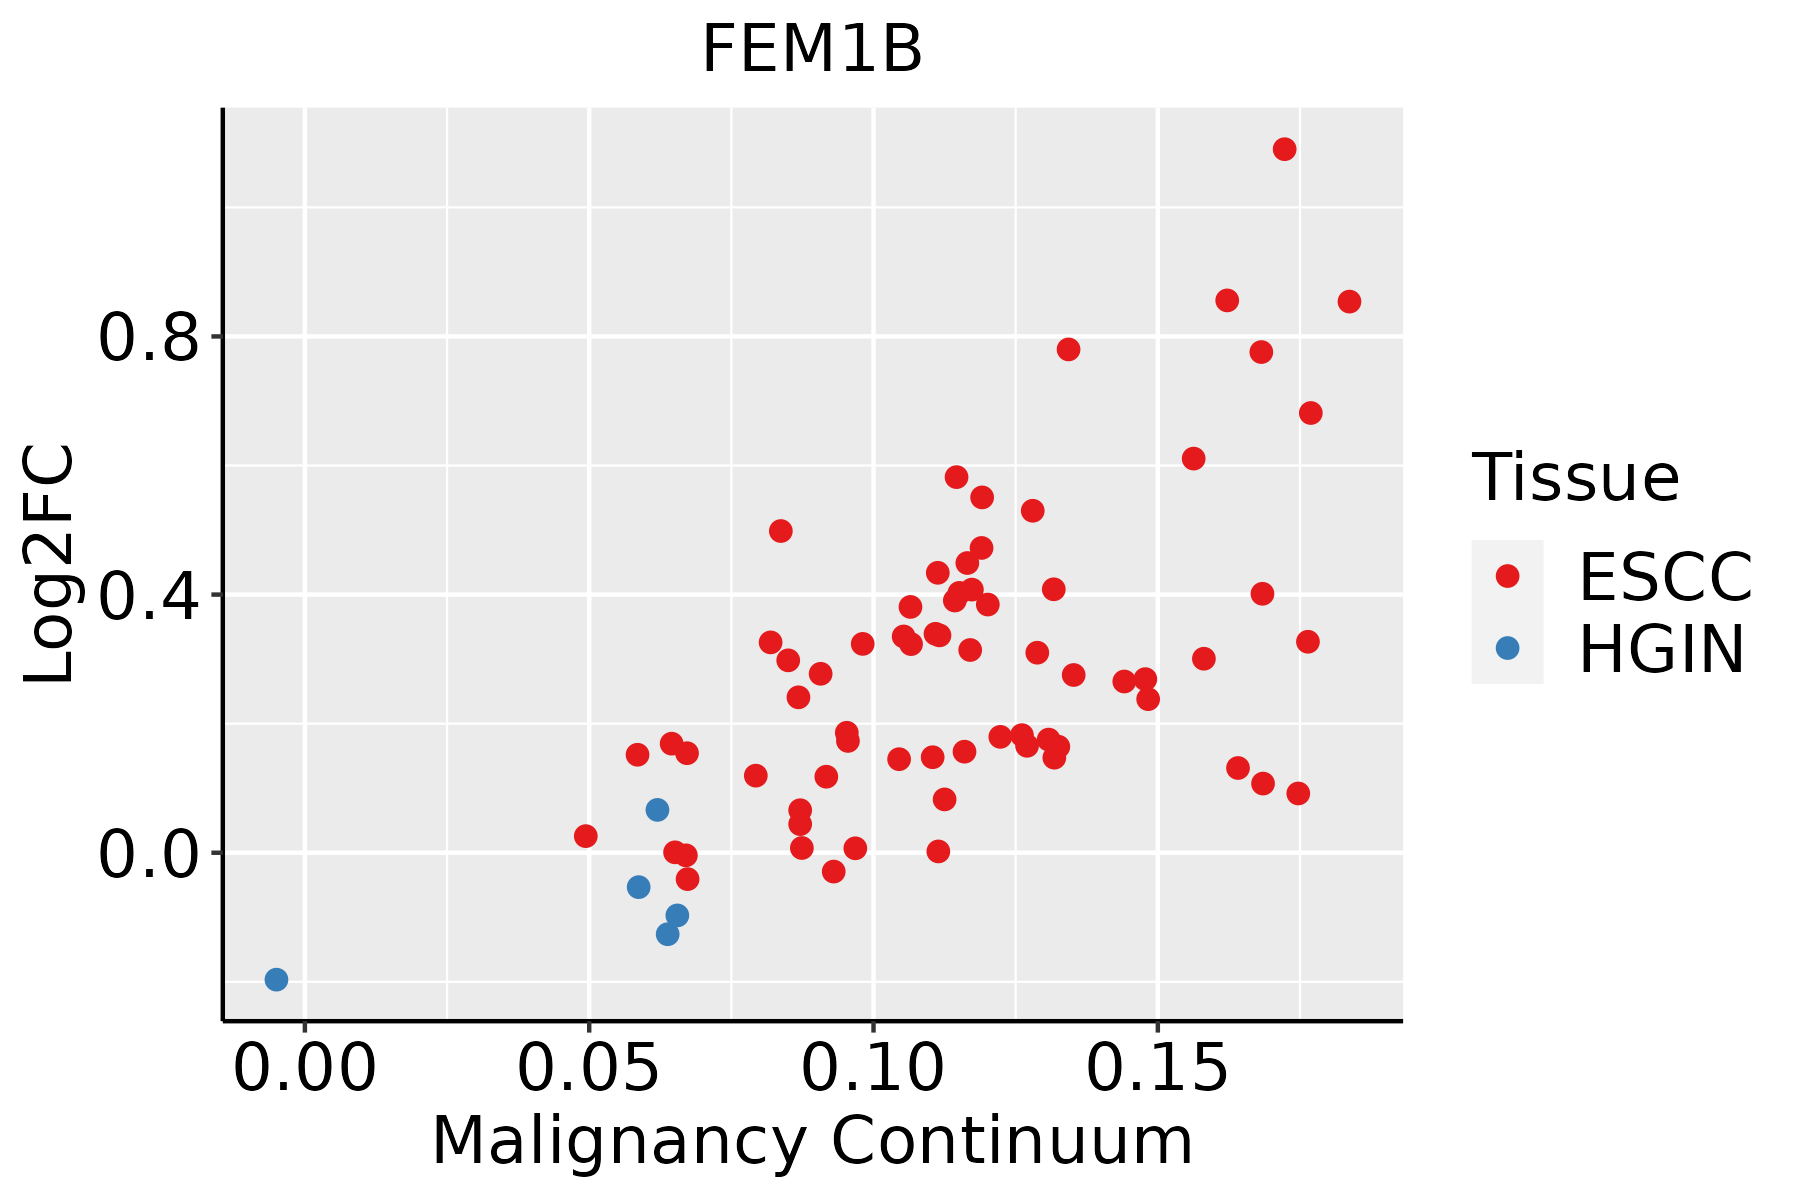
ESCC: Esophageal squamous cell carcinoma
HGIN: High-grade intraepithelial neoplasias
LGIN: Low-grade intraepithelial neoplasias
LiverThe image shows the transcriptomic changes along malignancy continuum.log2FC in expression of this searched gene in stem-like cells from each diseased tissue sample relative to stem-like cells in normal samples in each tissue plotted against the malignancy continuum. Samples are colored based on if they are from different disease stage.
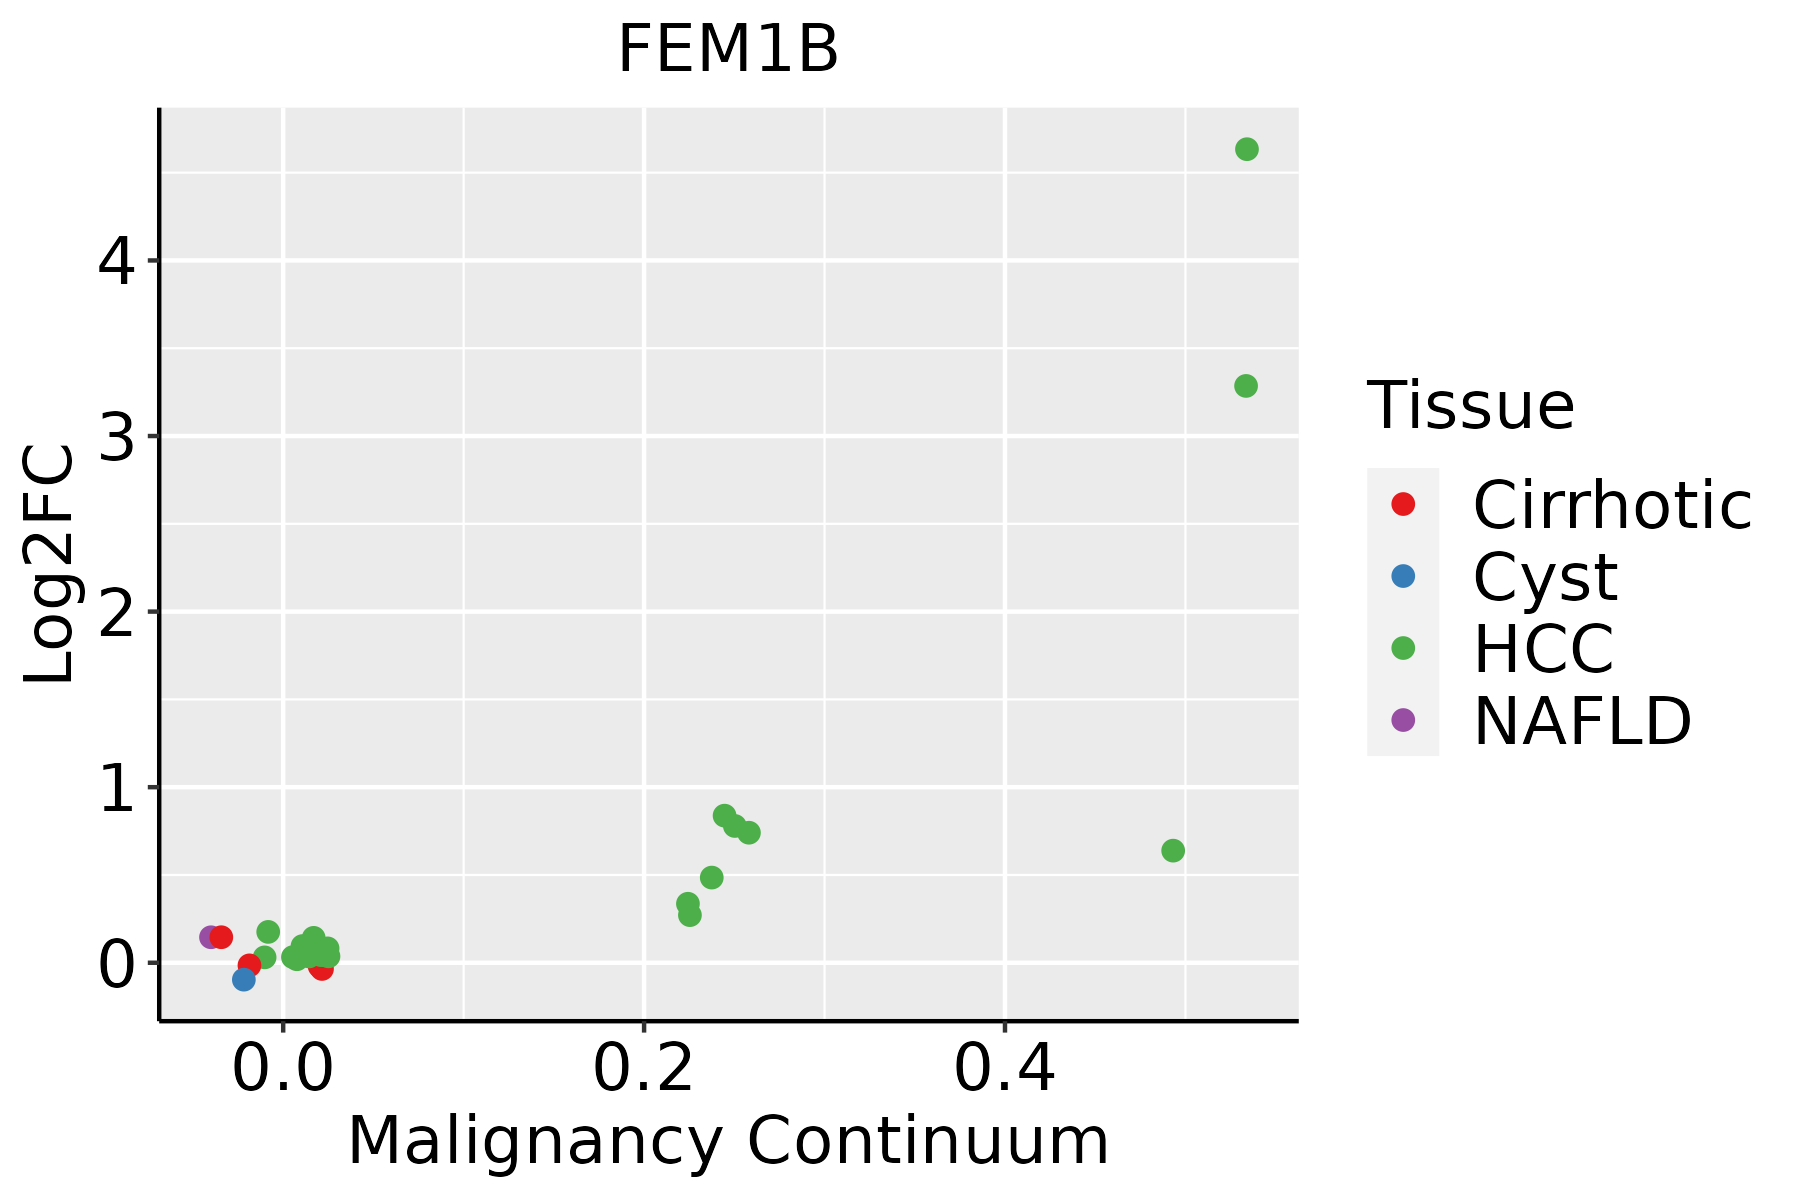
HCC: Hepatocellular carcinoma
NAFLD: Non-alcoholic fatty liver disease
Oral CavityThe image shows the transcriptomic changes along malignancy continuum.log2FC in expression of this searched gene in stem-like cells from each diseased tissue sample relative to stem-like cells in normal samples in each tissue plotted against the malignancy continuum. Samples are colored based on if they are from different disease stage.EOLP: Erosive Oral lichen planus
LP: leukoplakia
NEOLP: Non-erosive oral lichen planus
OSCC: Oral squamous cell carcinoma
ProstateThe image shows the transcriptomic changes along malignancy continuum.log2FC in expression of this searched gene in stem-like cells from each diseased tissue sample relative to stem-like cells in normal samples in each tissue plotted against the malignancy continuum. Samples are colored based on if they are from different disease stage.
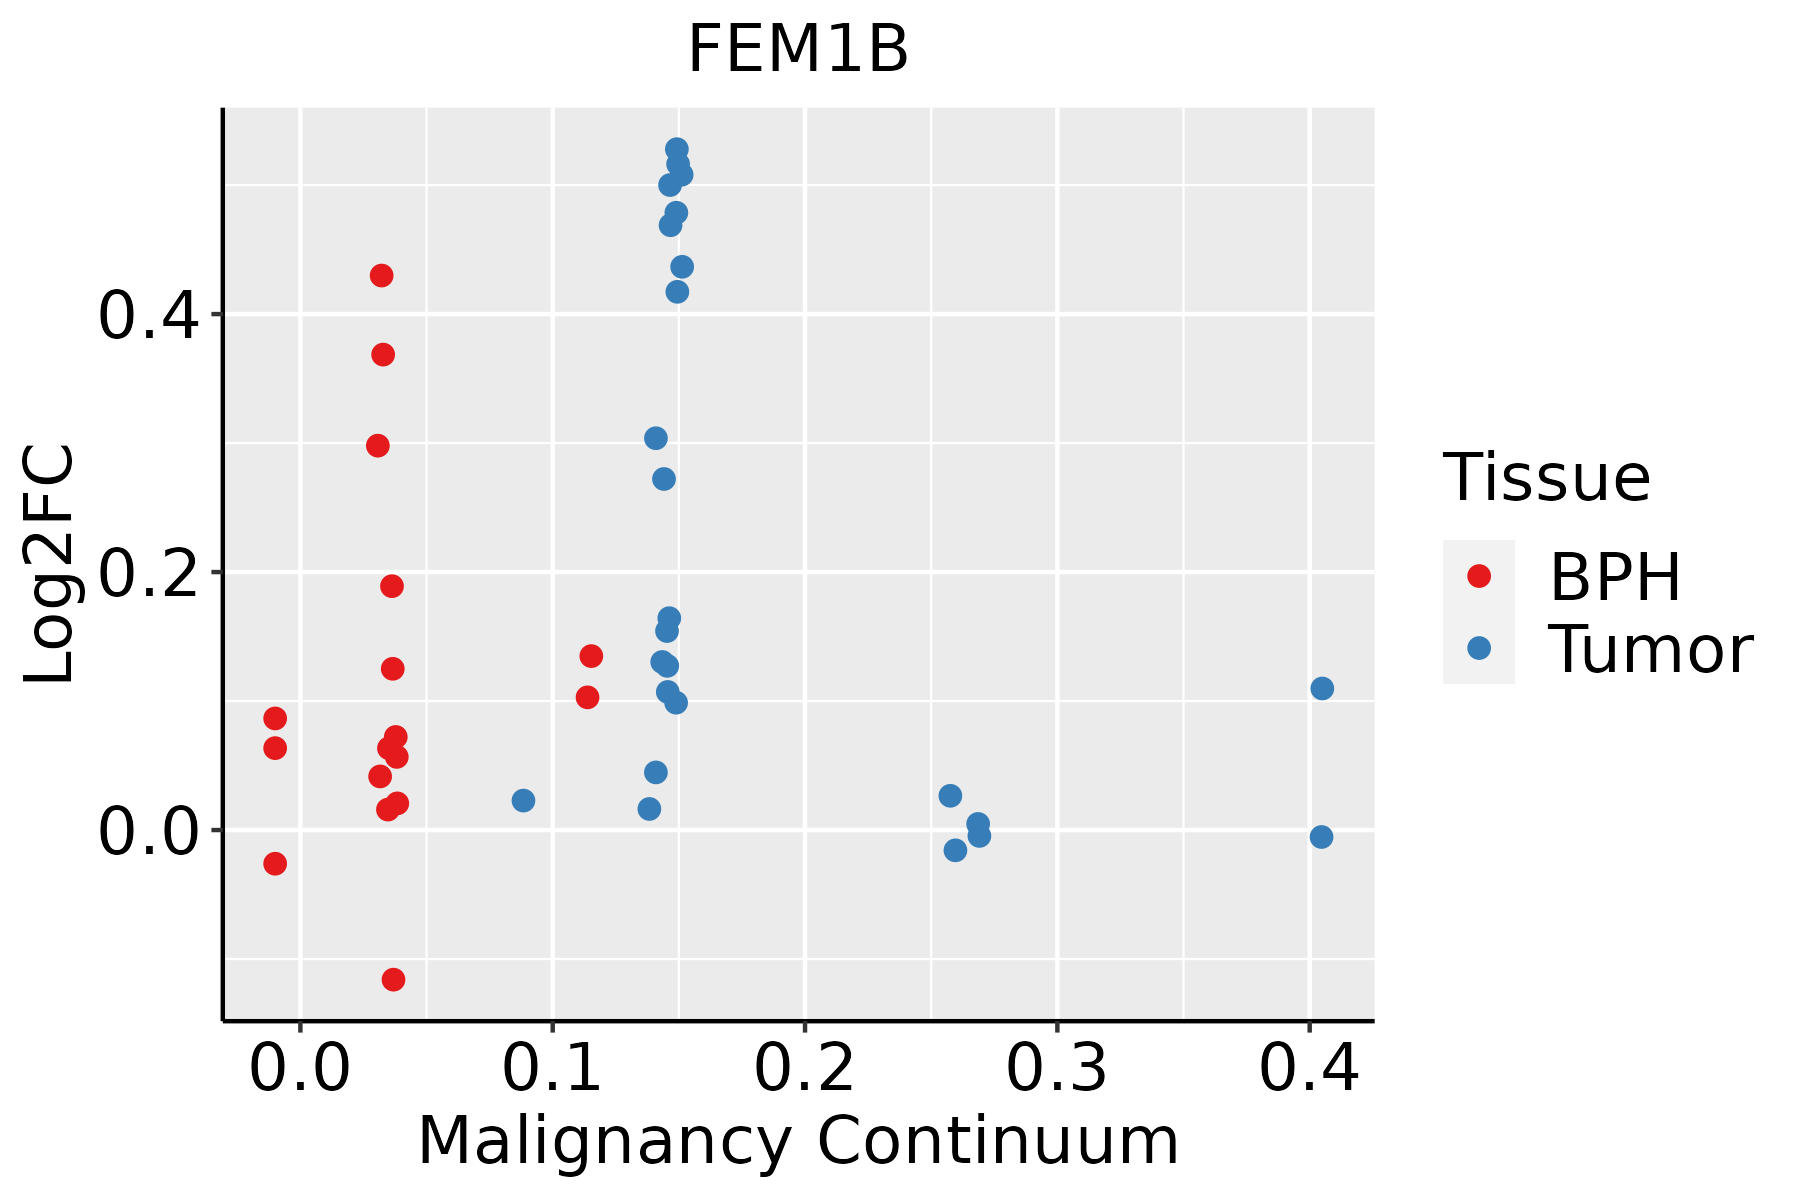
BPH: Benign Prostatic Hyperplasia
SkinThe image shows the transcriptomic changes along malignancy continuum.log2FC in expression of this searched gene in stem-like cells from each diseased tissue sample relative to stem-like cells in normal samples in each tissue plotted against the malignancy continuum. Samples are colored based on if they are from different disease stage.AK: Actinic keratosis
cSCC: Cutaneous squamous cell carcinoma
SCCIS:squamous cell carcinoma in situ
∗log2FC in expression of this searched gene in stem-like cells from each diseased tissue sample relative to stem-like cells in normal samples in each tissue plotted against the malignancy continuum. Samples are colored based on if they are from different disease stage.

Top

Malignant transformation related pathway analysis

check buttonFind out the enriched GO biological processes and KEGG pathways involved in transition from healthy to precancer to cancer
check button Figure of enriched GO biological processes.
TissueDisease StageEnriched GO biological Processes
ColorectumADGO analysis - Figure of enriched GO biological processes: Top 15 enriched GO BP terms are showed in the bar plot of each disease state in each tissue. Each row represents a significant GO biological process which is colored according to the -log10(p.adjust).
ColorectumSERGO analysis - Figure of enriched GO biological processes: Top 15 enriched GO BP terms are showed in the bar plot of each disease state in each tissue. Each row represents a significant GO biological process which is colored according to the -log10(p.adjust).
ColorectumMSSGO analysis - Figure of enriched GO biological processes: Top 15 enriched GO BP terms are showed in the bar plot of each disease state in each tissue. Each row represents a significant GO biological process which is colored according to the -log10(p.adjust).
ColorectumMSI-HGO analysis - Figure of enriched GO biological processes: Top 15 enriched GO BP terms are showed in the bar plot of each disease state in each tissue. Each row represents a significant GO biological process which is colored according to the -log10(p.adjust).
ColorectumFAPGO analysis - Figure of enriched GO biological processes: Top 15 enriched GO BP terms are showed in the bar plot of each disease state in each tissue. Each row represents a significant GO biological process which is colored according to the -log10(p.adjust).
∗Top 15 enriched GO BP terms are showed in the bar plot of each disease state in each tissue. Each row represents a significant GO biological process which is colored according to the -log10(p.adjust).
Page: 1 2 3 4 5 6 7 8 9 

check button Enriched GO biological processes.
GO IDTissueDisease StageDescriptionGene RatioBg Ratiopvaluep.adjustCount
GO:0010498111EsophagusESCCproteasomal protein catabolic process369/8552490/187231.13e-411.80e-38369
GO:0043161111EsophagusESCCproteasome-mediated ubiquitin-dependent protein catabolic process312/8552412/187233.53e-364.48e-33312
GO:2001233111EsophagusESCCregulation of apoptotic signaling pathway256/8552356/187234.11e-241.04e-21256
GO:0097191111EsophagusESCCextrinsic apoptotic signaling pathway159/8552219/187234.12e-162.94e-14159
GO:2001236111EsophagusESCCregulation of extrinsic apoptotic signaling pathway111/8552151/187232.97e-121.18e-10111
GO:0048732111EsophagusESCCgland development269/8552436/187237.81e-122.95e-10269
GO:190198713EsophagusESCCregulation of cell cycle phase transition242/8552390/187233.86e-111.26e-09242
GO:00457865EsophagusESCCnegative regulation of cell cycle236/8552385/187233.62e-109.93e-09236
GO:00000754EsophagusESCCcell cycle checkpoint117/8552169/187234.47e-101.17e-08117
GO:2001020110EsophagusESCCregulation of response to DNA damage stimulus145/8552219/187235.97e-101.50e-08145
GO:004277014EsophagusESCCsignal transduction in response to DNA damage117/8552172/187232.38e-095.32e-08117
GO:0061458110EsophagusESCCreproductive system development247/8552427/187232.24e-073.42e-06247
GO:004860818EsophagusESCCreproductive structure development245/8552424/187232.82e-074.14e-06245
GO:00109484EsophagusESCCnegative regulation of cell cycle process177/8552294/187233.26e-074.59e-06177
GO:00315705EsophagusESCCDNA integrity checkpoint83/8552123/187238.17e-071.06e-0583
GO:000206420EsophagusESCCepithelial cell development136/8552220/187239.50e-071.21e-05136
GO:000862519EsophagusESCCextrinsic apoptotic signaling pathway via death domain receptors59/855282/187231.23e-061.52e-0559
GO:00000775EsophagusESCCDNA damage checkpoint78/8552115/187231.27e-061.56e-0578
GO:19019883EsophagusESCCnegative regulation of cell cycle phase transition151/8552249/187231.28e-061.57e-05151
GO:002261216EsophagusESCCgland morphogenesis78/8552118/187235.83e-066.03e-0578
Page: 1 2 3 4 5 6 7 8 

check button Enriched KEGG pathways.
Pathway IDTissueDisease StageDescriptionGene RatioBg Ratiopvaluep.adjustqvalueCount
Page: 1 

Top

Cell-cell communication analysis

check buttonIdentification of potential cell-cell interactions between two cell types and their ligand-receptor pairs for different disease states
LigandReceptorLRpairPathwayTissueDisease Stage
Page: 1 

Top

Single-cell gene regulatory network inference analysis

check buttonFind out the significant the regulons (TFs) and the target genes of each regulon across cell types for different disease states
TFCell TypeTissueDisease StageTarget GeneRSSRegulon Activity
∗The dot plots of a searched regulon are shown for all cell subpopulations in each disease state of each tissue based on the regulon specific score inferred using pySCENIC and by calculating the average expression.
Page: 1 

Top

Somatic mutation of malignant transformation related genes

check buttonAnnotation of somatic variants for genes involved in malignant transformation
Hugo SymbolVariant ClassVariant ClassificationdbSNP RSHGVScHGVSpHGVSp ShortSWISSPROTBIOTYPESIFTPolyPhenTumor Sample BarcodeTissueHistologySexAgeStageTherapy TypesDrugsOutcome
FEM1BSNVMissense_Mutationc.653N>Tp.His218Leup.H218LQ9UK73protein_codingtolerated(0.67)benign(0.023)TCGA-BH-A0HB-01Breastbreast invasive carcinomaFemale<65I/IIChemotherapydocetaxelSD
FEM1BinsertionNonsense_Mutationnovelc.1309_1310insACATCCCTTAAACATATGTTAGGCTGTGGCCTCTGTTATCTAACTGCp.Met437AsnfsTer4p.M437Nfs*4Q9UK73protein_codingTCGA-A8-A06X-01Breastbreast invasive carcinomaFemale>=65I/IIUnknownUnknownSD
FEM1BSNVMissense_Mutationnovelc.703N>Ap.Val235Ilep.V235IQ9UK73protein_codingdeleterious(0.01)possibly_damaging(0.688)TCGA-2W-A8YY-01Cervixcervical & endocervical cancerFemale<65I/IIChemotherapycisplatinCR
FEM1BSNVMissense_Mutationrs777760220c.1444N>Tp.Arg482Cysp.R482CQ9UK73protein_codingdeleterious(0)possibly_damaging(0.828)TCGA-C5-A1BI-01Cervixcervical & endocervical cancerFemale<65III/IVChemotherapycisplatinSD
FEM1BSNVMissense_Mutationnovelc.1092C>Gp.Ile364Metp.I364MQ9UK73protein_codingtolerated(0.15)possibly_damaging(0.494)TCGA-EK-A3GK-01Cervixcervical & endocervical cancerFemale<65I/IIUnknownUnknownSD
FEM1BSNVMissense_Mutationrs775266107c.1381N>Ap.Glu461Lysp.E461KQ9UK73protein_codingtolerated(0.49)benign(0.134)TCGA-FU-A3HZ-01Cervixcervical & endocervical cancerFemale<65I/IIChemotherapycisplatinCR
FEM1BSNVMissense_Mutationc.599N>Gp.Ile200Argp.I200RQ9UK73protein_codingdeleterious(0.01)benign(0.009)TCGA-IR-A3LB-01Cervixcervical & endocervical cancerFemale<65I/IIChemotherapycisplatinPD
FEM1BSNVMissense_Mutationc.365C>Tp.Ser122Leup.S122LQ9UK73protein_codingdeleterious(0)probably_damaging(1)TCGA-LP-A4AV-01Cervixcervical & endocervical cancerFemale<65I/IIUnknownUnknownSD
FEM1BSNVMissense_Mutationc.1439G>Ap.Arg480Lysp.R480KQ9UK73protein_codingtolerated(0.31)benign(0.132)TCGA-AA-3510-01Colorectumcolon adenocarcinomaMale>=65I/IIUnknownUnknownSD
FEM1BSNVMissense_Mutationc.679N>Ap.Ala227Thrp.A227TQ9UK73protein_codingdeleterious(0)probably_damaging(0.995)TCGA-AA-3712-01Colorectumcolon adenocarcinomaMale>=65III/IVUnknownUnknownSD
Page: 1 2 3 4 5 6 7 8 

Top

Related drugs of malignant transformation related genes

check buttonIdentification of chemicals and drugs interact with genes involved in malignant transfromation
(DGIdb 4.0)
Entrez IDSymbolCategoryInteraction TypesDrug Claim NameDrug NamePMIDs
Page: 1