
|
|||||
|
 | |
| |
| |
| |
| |
| |
|
Gene: FEM1A |
Gene summary for FEM1A |
| Gene information | Species | Human | Gene symbol | FEM1A | Gene ID | 55527 |
| Gene name | fem-1 homolog A | |
| Gene Alias | EPRAP | |
| Cytomap | 19p13.3 | |
| Gene Type | protein-coding | GO ID | GO:0006464 | UniProtAcc | Q9BSK4 |
Top |
Malignant transformation analysis |
| Identification of the aberrant gene expression in precancerous and cancerous lesions by comparing the gene expression of stem-like cells in diseased tissues with normal stem cells |
| Entrez ID | Symbol | Replicates | Species | Organ | Tissue | Adj P-value | Log2FC | Malignancy |
| 55527 | FEM1A | LZE7T | Human | Esophagus | ESCC | 3.39e-02 | 2.18e-01 | 0.0667 |
| 55527 | FEM1A | LZE24T | Human | Esophagus | ESCC | 1.89e-09 | 1.91e-01 | 0.0596 |
| 55527 | FEM1A | P1T-E | Human | Esophagus | ESCC | 3.42e-03 | 2.65e-01 | 0.0875 |
| 55527 | FEM1A | P2T-E | Human | Esophagus | ESCC | 1.13e-09 | 2.15e-01 | 0.1177 |
| 55527 | FEM1A | P4T-E | Human | Esophagus | ESCC | 1.23e-08 | 1.28e-01 | 0.1323 |
| 55527 | FEM1A | P5T-E | Human | Esophagus | ESCC | 4.37e-04 | 4.50e-02 | 0.1327 |
| 55527 | FEM1A | P8T-E | Human | Esophagus | ESCC | 8.16e-18 | 2.59e-01 | 0.0889 |
| 55527 | FEM1A | P9T-E | Human | Esophagus | ESCC | 2.13e-10 | 2.05e-01 | 0.1131 |
| 55527 | FEM1A | P10T-E | Human | Esophagus | ESCC | 2.50e-18 | 3.35e-01 | 0.116 |
| 55527 | FEM1A | P11T-E | Human | Esophagus | ESCC | 1.14e-11 | 3.27e-01 | 0.1426 |
| 55527 | FEM1A | P12T-E | Human | Esophagus | ESCC | 5.46e-12 | 2.68e-01 | 0.1122 |
| 55527 | FEM1A | P15T-E | Human | Esophagus | ESCC | 8.61e-21 | 3.47e-01 | 0.1149 |
| 55527 | FEM1A | P16T-E | Human | Esophagus | ESCC | 1.25e-11 | 1.92e-01 | 0.1153 |
| 55527 | FEM1A | P17T-E | Human | Esophagus | ESCC | 1.25e-06 | 2.36e-01 | 0.1278 |
| 55527 | FEM1A | P19T-E | Human | Esophagus | ESCC | 1.72e-02 | 3.57e-01 | 0.1662 |
| 55527 | FEM1A | P20T-E | Human | Esophagus | ESCC | 9.87e-12 | 2.71e-01 | 0.1124 |
| 55527 | FEM1A | P21T-E | Human | Esophagus | ESCC | 2.86e-09 | 1.27e-01 | 0.1617 |
| 55527 | FEM1A | P22T-E | Human | Esophagus | ESCC | 5.20e-07 | 1.61e-01 | 0.1236 |
| 55527 | FEM1A | P23T-E | Human | Esophagus | ESCC | 3.61e-20 | 3.77e-01 | 0.108 |
| 55527 | FEM1A | P24T-E | Human | Esophagus | ESCC | 5.11e-13 | 2.18e-01 | 0.1287 |
| Page: 1 2 3 4 |
| Tissue | Expression Dynamics | Abbreviation |
| Esophagus | 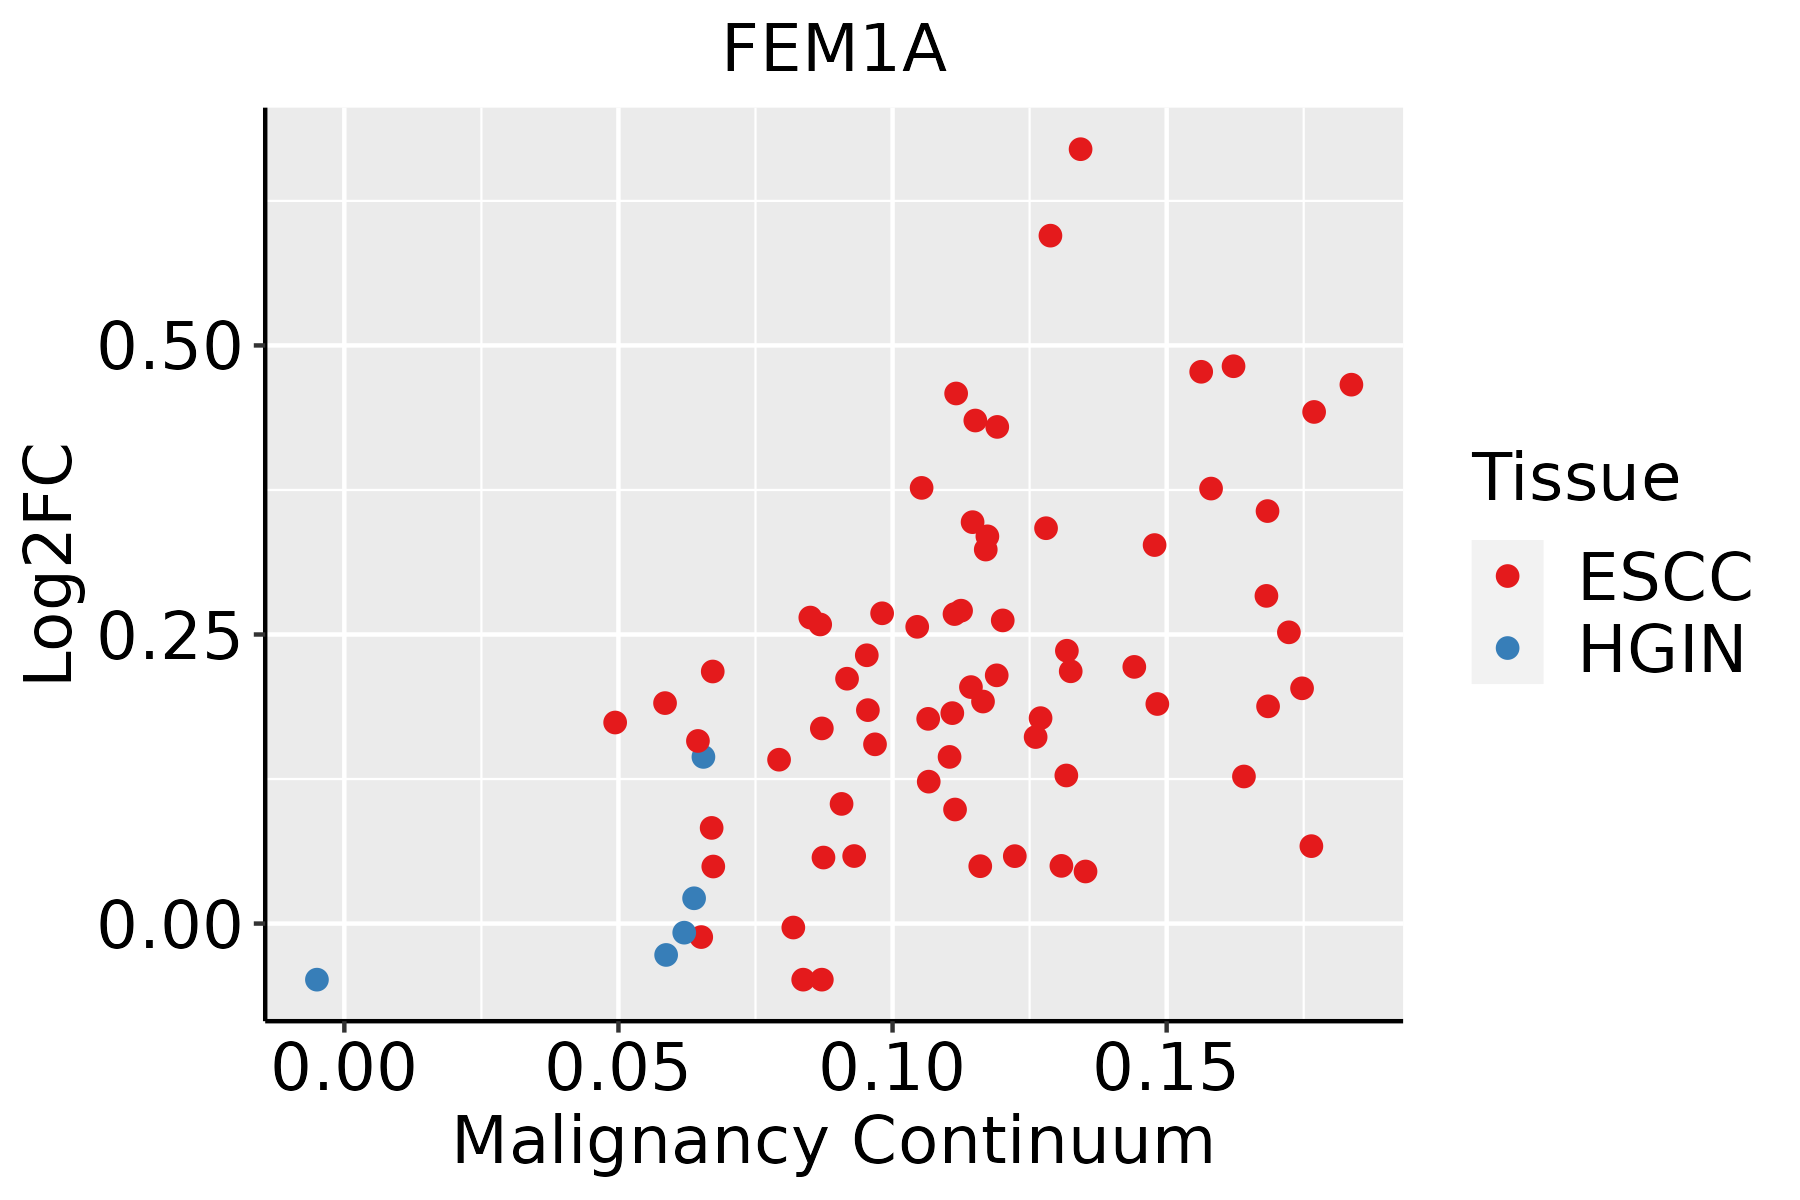 | ESCC: Esophageal squamous cell carcinoma |
| HGIN: High-grade intraepithelial neoplasias | ||
| LGIN: Low-grade intraepithelial neoplasias | ||
| Oral Cavity |  | EOLP: Erosive Oral lichen planus |
| LP: leukoplakia | ||
| NEOLP: Non-erosive oral lichen planus | ||
| OSCC: Oral squamous cell carcinoma |
| ∗log2FC in expression of this searched gene in stem-like cells from each diseased tissue sample relative to stem-like cells in normal samples in each tissue plotted against the malignancy continuum. Samples are colored based on if they are from different disease stage. |
Top |
Malignant transformation related pathway analysis |
| Find out the enriched GO biological processes and KEGG pathways involved in transition from healthy to precancer to cancer |
| Tissue | Disease Stage | Enriched GO biological Processes |
| Colorectum | AD |  |
| Colorectum | SER |  |
| Colorectum | MSS |  |
| Colorectum | MSI-H |  |
| Colorectum | FAP |  |
| ∗Top 15 enriched GO BP terms are showed in the bar plot of each disease state in each tissue. Each row represents a significant GO biological process which is colored according to the -log10(p.adjust). |
| Page: 1 2 3 4 5 6 7 8 9 |
| GO ID | Tissue | Disease Stage | Description | Gene Ratio | Bg Ratio | pvalue | p.adjust | Count |
| GO:0010498111 | Esophagus | ESCC | proteasomal protein catabolic process | 369/8552 | 490/18723 | 1.13e-41 | 1.80e-38 | 369 |
| GO:0043161111 | Esophagus | ESCC | proteasome-mediated ubiquitin-dependent protein catabolic process | 312/8552 | 412/18723 | 3.53e-36 | 4.48e-33 | 312 |
| GO:005143819 | Esophagus | ESCC | regulation of ubiquitin-protein transferase activity | 38/8552 | 53/18723 | 1.10e-04 | 7.69e-04 | 38 |
| GO:001049820 | Oral cavity | OSCC | proteasomal protein catabolic process | 336/7305 | 490/18723 | 5.45e-41 | 8.63e-38 | 336 |
| GO:004316120 | Oral cavity | OSCC | proteasome-mediated ubiquitin-dependent protein catabolic process | 285/7305 | 412/18723 | 5.68e-36 | 5.99e-33 | 285 |
| GO:005143810 | Oral cavity | OSCC | regulation of ubiquitin-protein transferase activity | 37/7305 | 53/18723 | 5.37e-06 | 6.04e-05 | 37 |
| GO:00321037 | Oral cavity | OSCC | positive regulation of response to external stimulus | 203/7305 | 427/18723 | 1.79e-04 | 1.22e-03 | 203 |
| GO:00313495 | Oral cavity | OSCC | positive regulation of defense response | 127/7305 | 278/18723 | 1.32e-02 | 4.39e-02 | 127 |
| Page: 1 |
| Pathway ID | Tissue | Disease Stage | Description | Gene Ratio | Bg Ratio | pvalue | p.adjust | qvalue | Count |
| Page: 1 |
Top |
Cell-cell communication analysis |
| Identification of potential cell-cell interactions between two cell types and their ligand-receptor pairs for different disease states |
| Ligand | Receptor | LRpair | Pathway | Tissue | Disease Stage |
| Page: 1 |
Top |
Single-cell gene regulatory network inference analysis |
| Find out the significant the regulons (TFs) and the target genes of each regulon across cell types for different disease states |
| TF | Cell Type | Tissue | Disease Stage | Target Gene | RSS | Regulon Activity |
| ∗The dot plots of a searched regulon are shown for all cell subpopulations in each disease state of each tissue based on the regulon specific score inferred using pySCENIC and by calculating the average expression. |
| Page: 1 |
Top |
Somatic mutation of malignant transformation related genes |
| Annotation of somatic variants for genes involved in malignant transformation |
| Hugo Symbol | Variant Class | Variant Classification | dbSNP RS | HGVSc | HGVSp | HGVSp Short | SWISSPROT | BIOTYPE | SIFT | PolyPhen | Tumor Sample Barcode | Tissue | Histology | Sex | Age | Stage | Therapy Types | Drugs | Outcome |
| FEM1A | SNV | Missense_Mutation | rs377569506 | c.1218C>G | p.Phe406Leu | p.F406L | Q9BSK4 | protein_coding | deleterious(0) | possibly_damaging(0.476) | TCGA-C8-A27B-01 | Breast | breast invasive carcinoma | Female | <65 | I/II | Chemotherapy | 5-fluorouracil | CR |
| FEM1A | SNV | Missense_Mutation | novel | c.1290N>A | p.Met430Ile | p.M430I | Q9BSK4 | protein_coding | deleterious(0) | possibly_damaging(0.826) | TCGA-PE-A5DE-01 | Breast | breast invasive carcinoma | Female | <65 | I/II | Chemotherapy | taxotere | CR |
| FEM1A | SNV | Missense_Mutation | novel | c.1481C>T | p.Ala494Val | p.A494V | Q9BSK4 | protein_coding | tolerated(0.43) | benign(0.129) | TCGA-EA-A3HS-01 | Cervix | cervical & endocervical cancer | Female | <65 | I/II | Unknown | Unknown | SD |
| FEM1A | SNV | Missense_Mutation | c.1339C>G | p.Gln447Glu | p.Q447E | Q9BSK4 | protein_coding | tolerated(0.14) | benign(0.416) | TCGA-JW-A5VL-01 | Cervix | cervical & endocervical cancer | Female | <65 | I/II | Unknown | Unknown | SD | |
| FEM1A | SNV | Missense_Mutation | c.724G>C | p.Glu242Gln | p.E242Q | Q9BSK4 | protein_coding | tolerated(0.18) | benign(0.079) | TCGA-Q1-A5R2-01 | Cervix | cervical & endocervical cancer | Female | <65 | I/II | Chemotherapy | cisplatin | PR | |
| FEM1A | SNV | Missense_Mutation | c.1732N>A | p.Asp578Asn | p.D578N | Q9BSK4 | protein_coding | deleterious(0.02) | probably_damaging(0.914) | TCGA-AA-A02O-01 | Colorectum | colon adenocarcinoma | Male | >=65 | I/II | Unknown | Unknown | SD | |
| FEM1A | SNV | Missense_Mutation | c.1655N>A | p.Arg552His | p.R552H | Q9BSK4 | protein_coding | deleterious(0) | probably_damaging(0.977) | TCGA-CK-4951-01 | Colorectum | colon adenocarcinoma | Female | >=65 | I/II | Unknown | Unknown | PD | |
| FEM1A | SNV | Missense_Mutation | c.1111N>T | p.Arg371Cys | p.R371C | Q9BSK4 | protein_coding | deleterious(0) | probably_damaging(1) | TCGA-CK-5914-01 | Colorectum | colon adenocarcinoma | Male | >=65 | III/IV | Unknown | Unknown | SD | |
| FEM1A | SNV | Missense_Mutation | c.1847N>T | p.Thr616Met | p.T616M | Q9BSK4 | protein_coding | tolerated(0.08) | benign(0.207) | TCGA-CM-4746-01 | Colorectum | colon adenocarcinoma | Male | <65 | I/II | Unknown | Unknown | SD | |
| FEM1A | SNV | Missense_Mutation | rs776751127 | c.1378N>A | p.Gly460Ser | p.G460S | Q9BSK4 | protein_coding | tolerated(0.86) | benign(0.001) | TCGA-F4-6806-01 | Colorectum | colon adenocarcinoma | Female | <65 | I/II | Chemotherapy | irinotecan | PD |
| Page: 1 2 3 4 5 |
Top |
Related drugs of malignant transformation related genes |
| Identification of chemicals and drugs interact with genes involved in malignant transfromation |
| (DGIdb 4.0) |
| Entrez ID | Symbol | Category | Interaction Types | Drug Claim Name | Drug Name | PMIDs |
| Page: 1 |

Copyright 2023-Present -The University of Texas Health Science Center at Houston |