
|
|||||
|
 | |
| |
| |
| |
| |
| |
|
Gene: FDXR |
Gene summary for FDXR |
| Gene information | Species | Human | Gene symbol | FDXR | Gene ID | 2232 |
| Gene name | ferredoxin reductase | |
| Gene Alias | ADR | |
| Cytomap | 17q25.1 | |
| Gene Type | protein-coding | GO ID | GO:0006066 | UniProtAcc | A0A0A0MT64 |
Top |
Malignant transformation analysis |
| Identification of the aberrant gene expression in precancerous and cancerous lesions by comparing the gene expression of stem-like cells in diseased tissues with normal stem cells |
| Entrez ID | Symbol | Replicates | Species | Organ | Tissue | Adj P-value | Log2FC | Malignancy |
| 2232 | FDXR | LZE2T | Human | Esophagus | ESCC | 2.90e-02 | 4.34e-01 | 0.082 |
| 2232 | FDXR | LZE4T | Human | Esophagus | ESCC | 2.58e-08 | 2.10e-01 | 0.0811 |
| 2232 | FDXR | LZE7T | Human | Esophagus | ESCC | 2.01e-02 | 2.17e-01 | 0.0667 |
| 2232 | FDXR | LZE8T | Human | Esophagus | ESCC | 5.25e-09 | 2.95e-01 | 0.067 |
| 2232 | FDXR | LZE24T | Human | Esophagus | ESCC | 6.49e-23 | 6.17e-01 | 0.0596 |
| 2232 | FDXR | LZE21T | Human | Esophagus | ESCC | 1.44e-07 | 5.34e-01 | 0.0655 |
| 2232 | FDXR | LZE6T | Human | Esophagus | ESCC | 1.50e-03 | 1.72e-01 | 0.0845 |
| 2232 | FDXR | P1T-E | Human | Esophagus | ESCC | 1.95e-11 | 3.67e-01 | 0.0875 |
| 2232 | FDXR | P2T-E | Human | Esophagus | ESCC | 2.13e-21 | 3.56e-01 | 0.1177 |
| 2232 | FDXR | P4T-E | Human | Esophagus | ESCC | 5.23e-14 | 4.00e-01 | 0.1323 |
| 2232 | FDXR | P5T-E | Human | Esophagus | ESCC | 6.71e-17 | 1.59e-01 | 0.1327 |
| 2232 | FDXR | P8T-E | Human | Esophagus | ESCC | 6.28e-15 | 3.22e-01 | 0.0889 |
| 2232 | FDXR | P9T-E | Human | Esophagus | ESCC | 1.93e-14 | 3.30e-01 | 0.1131 |
| 2232 | FDXR | P10T-E | Human | Esophagus | ESCC | 1.01e-38 | 6.17e-01 | 0.116 |
| 2232 | FDXR | P11T-E | Human | Esophagus | ESCC | 1.03e-07 | 5.18e-01 | 0.1426 |
| 2232 | FDXR | P12T-E | Human | Esophagus | ESCC | 1.22e-28 | 5.48e-01 | 0.1122 |
| 2232 | FDXR | P15T-E | Human | Esophagus | ESCC | 8.19e-20 | 4.16e-01 | 0.1149 |
| 2232 | FDXR | P16T-E | Human | Esophagus | ESCC | 2.31e-11 | 2.54e-01 | 0.1153 |
| 2232 | FDXR | P17T-E | Human | Esophagus | ESCC | 4.79e-11 | 2.97e-01 | 0.1278 |
| 2232 | FDXR | P20T-E | Human | Esophagus | ESCC | 3.22e-60 | 1.28e+00 | 0.1124 |
| Page: 1 2 3 4 |
| Tissue | Expression Dynamics | Abbreviation |
| Esophagus |  | ESCC: Esophageal squamous cell carcinoma |
| HGIN: High-grade intraepithelial neoplasias | ||
| LGIN: Low-grade intraepithelial neoplasias | ||
| Oral Cavity | 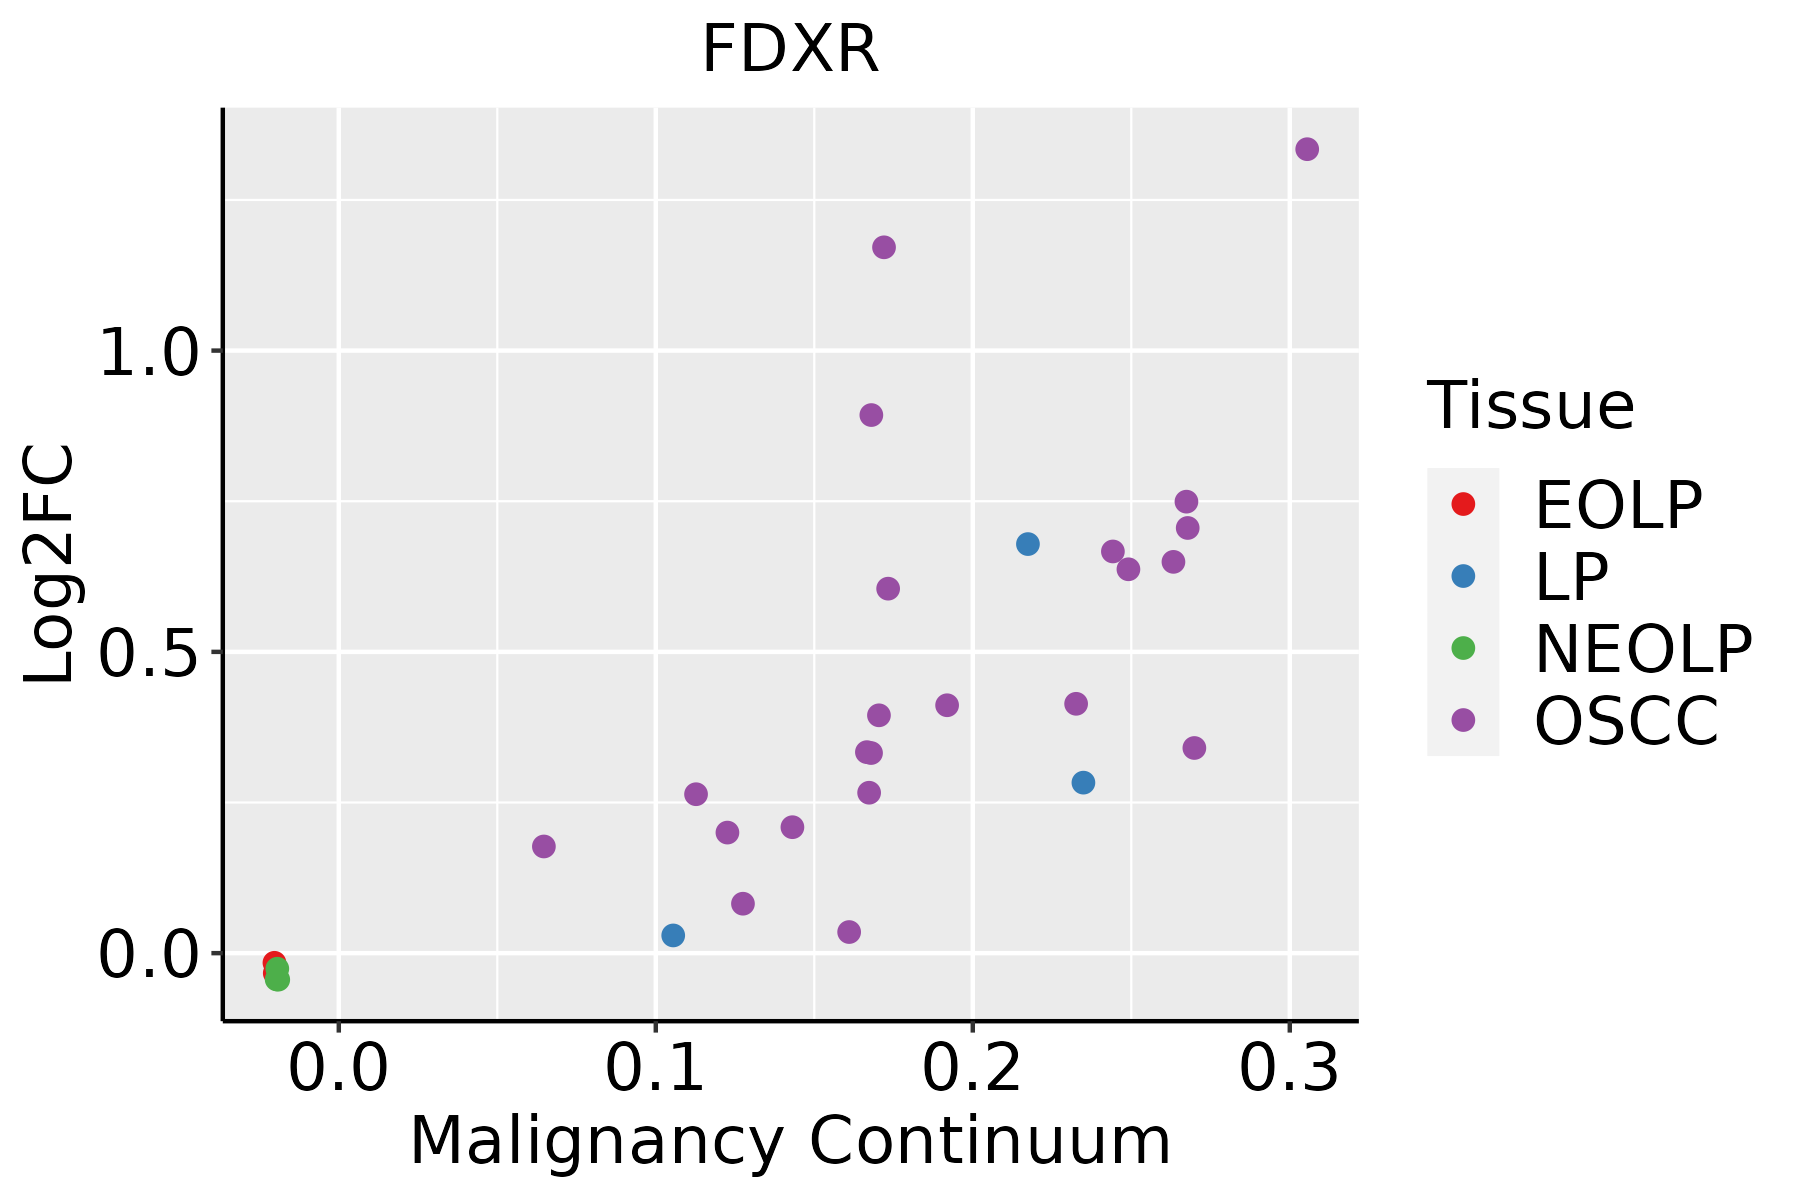 | EOLP: Erosive Oral lichen planus |
| LP: leukoplakia | ||
| NEOLP: Non-erosive oral lichen planus | ||
| OSCC: Oral squamous cell carcinoma |
| ∗log2FC in expression of this searched gene in stem-like cells from each diseased tissue sample relative to stem-like cells in normal samples in each tissue plotted against the malignancy continuum. Samples are colored based on if they are from different disease stage. |
Top |
Malignant transformation related pathway analysis |
| Find out the enriched GO biological processes and KEGG pathways involved in transition from healthy to precancer to cancer |
| Tissue | Disease Stage | Enriched GO biological Processes |
| Colorectum | AD |  |
| Colorectum | SER |  |
| Colorectum | MSS |  |
| Colorectum | MSI-H |  |
| Colorectum | FAP |  |
| ∗Top 15 enriched GO BP terms are showed in the bar plot of each disease state in each tissue. Each row represents a significant GO biological process which is colored according to the -log10(p.adjust). |
| Page: 1 2 3 4 5 6 7 8 9 |
| GO ID | Tissue | Disease Stage | Description | Gene Ratio | Bg Ratio | pvalue | p.adjust | Count |
| GO:0006091110 | Esophagus | ESCC | generation of precursor metabolites and energy | 331/8552 | 490/18723 | 3.86e-23 | 8.45e-21 | 331 |
| GO:190166112 | Esophagus | ESCC | quinone metabolic process | 34/8552 | 40/18723 | 3.00e-07 | 4.27e-06 | 34 |
| GO:00060668 | Esophagus | ESCC | alcohol metabolic process | 202/8552 | 353/18723 | 7.32e-06 | 7.26e-05 | 202 |
| GO:00067432 | Esophagus | ESCC | ubiquinone metabolic process | 17/8552 | 19/18723 | 9.02e-05 | 6.50e-04 | 17 |
| GO:00067442 | Esophagus | ESCC | ubiquinone biosynthetic process | 15/8552 | 17/18723 | 3.48e-04 | 2.03e-03 | 15 |
| GO:19016632 | Esophagus | ESCC | quinone biosynthetic process | 15/8552 | 17/18723 | 3.48e-04 | 2.03e-03 | 15 |
| GO:19026524 | Esophagus | ESCC | secondary alcohol metabolic process | 87/8552 | 147/18723 | 6.58e-04 | 3.50e-03 | 87 |
| GO:00421805 | Esophagus | ESCC | cellular ketone metabolic process | 120/8552 | 211/18723 | 6.70e-04 | 3.55e-03 | 120 |
| GO:00066946 | Esophagus | ESCC | steroid biosynthetic process | 98/8552 | 173/18723 | 2.34e-03 | 1.03e-02 | 98 |
| GO:00082034 | Esophagus | ESCC | cholesterol metabolic process | 79/8552 | 137/18723 | 3.11e-03 | 1.29e-02 | 79 |
| GO:00161254 | Esophagus | ESCC | sterol metabolic process | 86/8552 | 152/18723 | 4.37e-03 | 1.73e-02 | 86 |
| GO:000609118 | Oral cavity | OSCC | generation of precursor metabolites and energy | 286/7305 | 490/18723 | 1.45e-18 | 1.71e-16 | 286 |
| GO:19016613 | Oral cavity | OSCC | quinone metabolic process | 32/7305 | 40/18723 | 1.40e-07 | 2.34e-06 | 32 |
| GO:00060667 | Oral cavity | OSCC | alcohol metabolic process | 179/7305 | 353/18723 | 4.54e-06 | 5.21e-05 | 179 |
| GO:00421804 | Oral cavity | OSCC | cellular ketone metabolic process | 111/7305 | 211/18723 | 3.94e-05 | 3.45e-04 | 111 |
| GO:0006743 | Oral cavity | OSCC | ubiquinone metabolic process | 16/7305 | 19/18723 | 7.05e-05 | 5.60e-04 | 16 |
| GO:19026523 | Oral cavity | OSCC | secondary alcohol metabolic process | 79/7305 | 147/18723 | 1.98e-04 | 1.33e-03 | 79 |
| GO:0006744 | Oral cavity | OSCC | ubiquinone biosynthetic process | 14/7305 | 17/18723 | 3.31e-04 | 2.04e-03 | 14 |
| GO:1901663 | Oral cavity | OSCC | quinone biosynthetic process | 14/7305 | 17/18723 | 3.31e-04 | 2.04e-03 | 14 |
| GO:00066945 | Oral cavity | OSCC | steroid biosynthetic process | 89/7305 | 173/18723 | 5.77e-04 | 3.30e-03 | 89 |
| Page: 1 2 |
| Pathway ID | Tissue | Disease Stage | Description | Gene Ratio | Bg Ratio | pvalue | p.adjust | qvalue | Count |
| Page: 1 |
Top |
Cell-cell communication analysis |
| Identification of potential cell-cell interactions between two cell types and their ligand-receptor pairs for different disease states |
| Ligand | Receptor | LRpair | Pathway | Tissue | Disease Stage |
| Page: 1 |
Top |
Single-cell gene regulatory network inference analysis |
| Find out the significant the regulons (TFs) and the target genes of each regulon across cell types for different disease states |
| TF | Cell Type | Tissue | Disease Stage | Target Gene | RSS | Regulon Activity |
| ∗The dot plots of a searched regulon are shown for all cell subpopulations in each disease state of each tissue based on the regulon specific score inferred using pySCENIC and by calculating the average expression. |
| Page: 1 |
Top |
Somatic mutation of malignant transformation related genes |
| Annotation of somatic variants for genes involved in malignant transformation |
| Hugo Symbol | Variant Class | Variant Classification | dbSNP RS | HGVSc | HGVSp | HGVSp Short | SWISSPROT | BIOTYPE | SIFT | PolyPhen | Tumor Sample Barcode | Tissue | Histology | Sex | Age | Stage | Therapy Types | Drugs | Outcome |
| FDXR | SNV | Missense_Mutation | c.92N>G | p.His31Arg | p.H31R | protein_coding | tolerated(0.79) | benign(0) | TCGA-A2-A04T-01 | Breast | breast invasive carcinoma | Female | <65 | I/II | Chemotherapy | cyclophosphamide | SD | ||
| FDXR | SNV | Missense_Mutation | c.584N>A | p.Cys195Tyr | p.C195Y | protein_coding | tolerated(1) | benign(0) | TCGA-DS-A0VM-01 | Cervix | cervical & endocervical cancer | Female | <65 | I/II | Chemotherapy | cisplatin | PD | ||
| FDXR | SNV | Missense_Mutation | novel | c.740N>T | p.Arg247Ile | p.R247I | protein_coding | deleterious(0) | benign(0.062) | TCGA-AA-3984-01 | Colorectum | colon adenocarcinoma | Female | <65 | I/II | Unknown | Unknown | SD | |
| FDXR | SNV | Missense_Mutation | c.151N>G | p.Phe51Val | p.F51V | protein_coding | deleterious(0) | possibly_damaging(0.833) | TCGA-AD-6889-01 | Colorectum | colon adenocarcinoma | Male | >=65 | I/II | Chemotherapy | xeloda | PD | ||
| FDXR | SNV | Missense_Mutation | novel | c.347N>C | p.Val116Ala | p.V116A | protein_coding | deleterious(0) | benign(0.382) | TCGA-AZ-4315-01 | Colorectum | colon adenocarcinoma | Male | <65 | I/II | Unknown | Unknown | SD | |
| FDXR | SNV | Missense_Mutation | rs778860222 | c.1093N>T | p.Arg365Trp | p.R365W | protein_coding | deleterious(0) | possibly_damaging(0.828) | TCGA-AZ-6598-01 | Colorectum | colon adenocarcinoma | Female | >=65 | I/II | Unknown | Unknown | SD | |
| FDXR | SNV | Missense_Mutation | rs756259973 | c.5C>T | p.Ala2Val | p.A2V | protein_coding | deleterious_low_confidence(0.03) | benign(0.037) | TCGA-F4-6570-01 | Colorectum | colon adenocarcinoma | Female | >=65 | I/II | Unknown | Unknown | SD | |
| FDXR | SNV | Missense_Mutation | novel | c.800N>T | p.Trp267Leu | p.W267L | protein_coding | tolerated(0.36) | benign(0.006) | TCGA-AG-A015-01 | Colorectum | rectum adenocarcinoma | Female | <65 | I/II | Unknown | Unknown | PD | |
| FDXR | SNV | Missense_Mutation | novel | c.987N>T | p.Glu329Asp | p.E329D | protein_coding | tolerated(0.11) | benign(0.007) | TCGA-A5-A0G2-01 | Endometrium | uterine corpus endometrioid carcinoma | Female | <65 | III/IV | Unknown | Unknown | SD | |
| FDXR | SNV | Missense_Mutation | c.688N>A | p.Val230Met | p.V230M | protein_coding | deleterious(0) | probably_damaging(0.992) | TCGA-A5-A0VP-01 | Endometrium | uterine corpus endometrioid carcinoma | Female | >=65 | I/II | Unknown | Unknown | SD |
| Page: 1 2 3 4 5 |
Top |
Related drugs of malignant transformation related genes |
| Identification of chemicals and drugs interact with genes involved in malignant transfromation |
| (DGIdb 4.0) |
| Entrez ID | Symbol | Category | Interaction Types | Drug Claim Name | Drug Name | PMIDs |
| Page: 1 |

Copyright 2023-Present -The University of Texas Health Science Center at Houston |