
|
|||||
|
 | |
| |
| |
| |
| |
| |
|
Gene: FDX1 |
Gene summary for FDX1 |
| Gene information | Species | Human | Gene symbol | FDX1 | Gene ID | 2230 |
| Gene name | ferredoxin 1 | |
| Gene Alias | ADX | |
| Cytomap | 11q22.3 | |
| Gene Type | protein-coding | GO ID | GO:0006066 | UniProtAcc | P10109 |
Top |
Malignant transformation analysis |
| Identification of the aberrant gene expression in precancerous and cancerous lesions by comparing the gene expression of stem-like cells in diseased tissues with normal stem cells |
| Entrez ID | Symbol | Replicates | Species | Organ | Tissue | Adj P-value | Log2FC | Malignancy |
| 2230 | FDX1 | HTA11_347_2000001011 | Human | Colorectum | AD | 1.23e-07 | 2.66e-01 | -0.1954 |
| 2230 | FDX1 | A015-C-203 | Human | Colorectum | FAP | 1.13e-08 | -2.19e-01 | -0.1294 |
| 2230 | FDX1 | A001-C-108 | Human | Colorectum | FAP | 1.56e-03 | -1.79e-01 | -0.0272 |
| 2230 | FDX1 | A001-C-104 | Human | Colorectum | FAP | 4.19e-02 | -1.82e-01 | 0.0184 |
| 2230 | FDX1 | A015-C-106 | Human | Colorectum | FAP | 1.43e-03 | -1.78e-01 | -0.0511 |
| 2230 | FDX1 | A015-C-104 | Human | Colorectum | FAP | 7.36e-09 | -2.26e-01 | -0.1899 |
| 2230 | FDX1 | A002-C-016 | Human | Colorectum | FAP | 6.66e-03 | -1.58e-01 | 0.0521 |
| 2230 | FDX1 | A002-C-116 | Human | Colorectum | FAP | 4.76e-06 | -1.98e-01 | -0.0452 |
| 2230 | FDX1 | F034 | Human | Colorectum | FAP | 4.70e-04 | -1.85e-01 | -0.0665 |
| 2230 | FDX1 | LZE4T | Human | Esophagus | ESCC | 1.53e-07 | 6.67e-02 | 0.0811 |
| 2230 | FDX1 | LZE20T | Human | Esophagus | ESCC | 1.86e-03 | 2.35e-01 | 0.0662 |
| 2230 | FDX1 | LZE24T | Human | Esophagus | ESCC | 5.93e-36 | 1.30e+00 | 0.0596 |
| 2230 | FDX1 | LZE21T | Human | Esophagus | ESCC | 2.42e-03 | 1.08e-01 | 0.0655 |
| 2230 | FDX1 | P1T-E | Human | Esophagus | ESCC | 2.10e-08 | 4.96e-01 | 0.0875 |
| 2230 | FDX1 | P2T-E | Human | Esophagus | ESCC | 4.02e-31 | 5.87e-01 | 0.1177 |
| 2230 | FDX1 | P4T-E | Human | Esophagus | ESCC | 7.14e-60 | 1.53e+00 | 0.1323 |
| 2230 | FDX1 | P5T-E | Human | Esophagus | ESCC | 4.17e-57 | 1.15e+00 | 0.1327 |
| 2230 | FDX1 | P8T-E | Human | Esophagus | ESCC | 1.01e-22 | 4.01e-01 | 0.0889 |
| 2230 | FDX1 | P9T-E | Human | Esophagus | ESCC | 5.60e-17 | 5.93e-01 | 0.1131 |
| 2230 | FDX1 | P10T-E | Human | Esophagus | ESCC | 1.56e-41 | 6.36e-01 | 0.116 |
| Page: 1 2 3 4 5 6 7 |
| Tissue | Expression Dynamics | Abbreviation |
| Colorectum (GSE201348) |  | FAP: Familial adenomatous polyposis |
| CRC: Colorectal cancer | ||
| Colorectum (HTA11) | 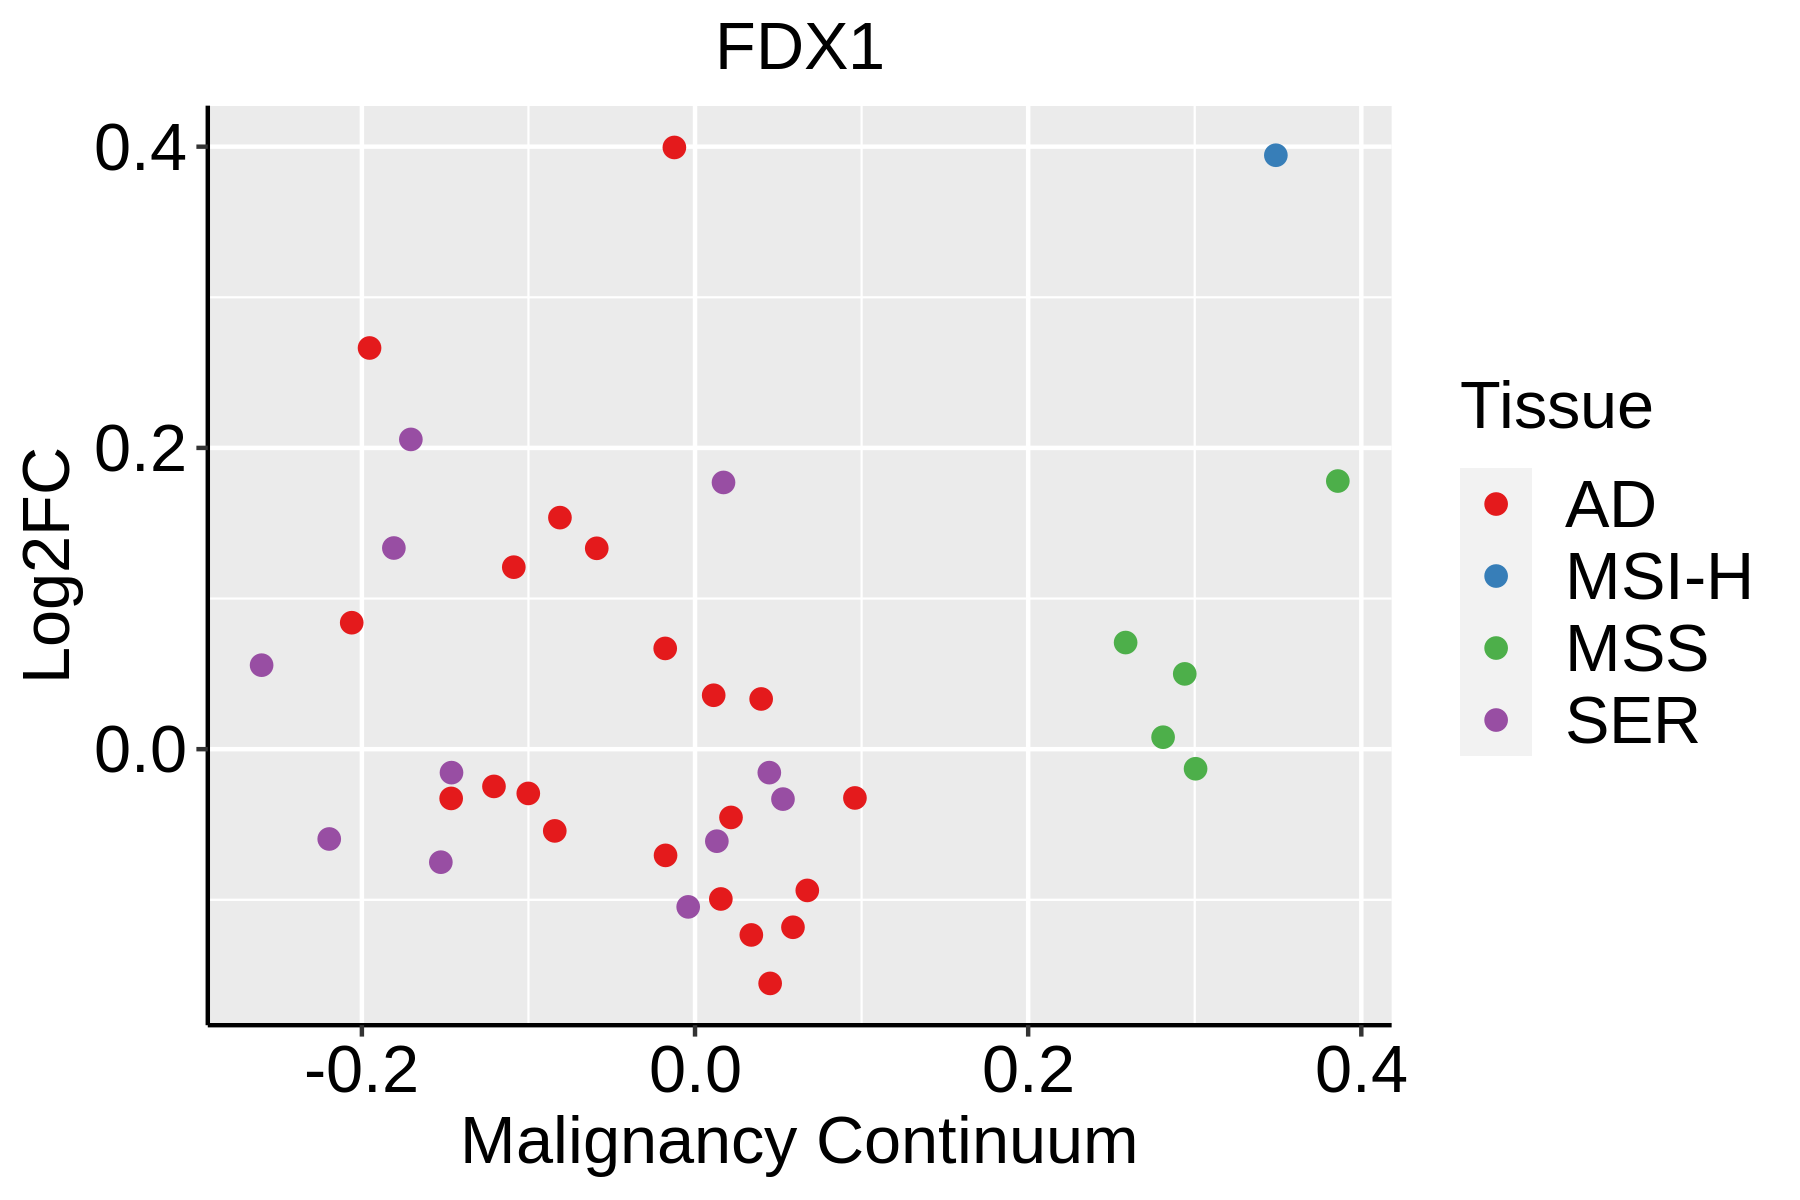 | AD: Adenomas |
| SER: Sessile serrated lesions | ||
| MSI-H: Microsatellite-high colorectal cancer | ||
| MSS: Microsatellite stable colorectal cancer | ||
| Esophagus | 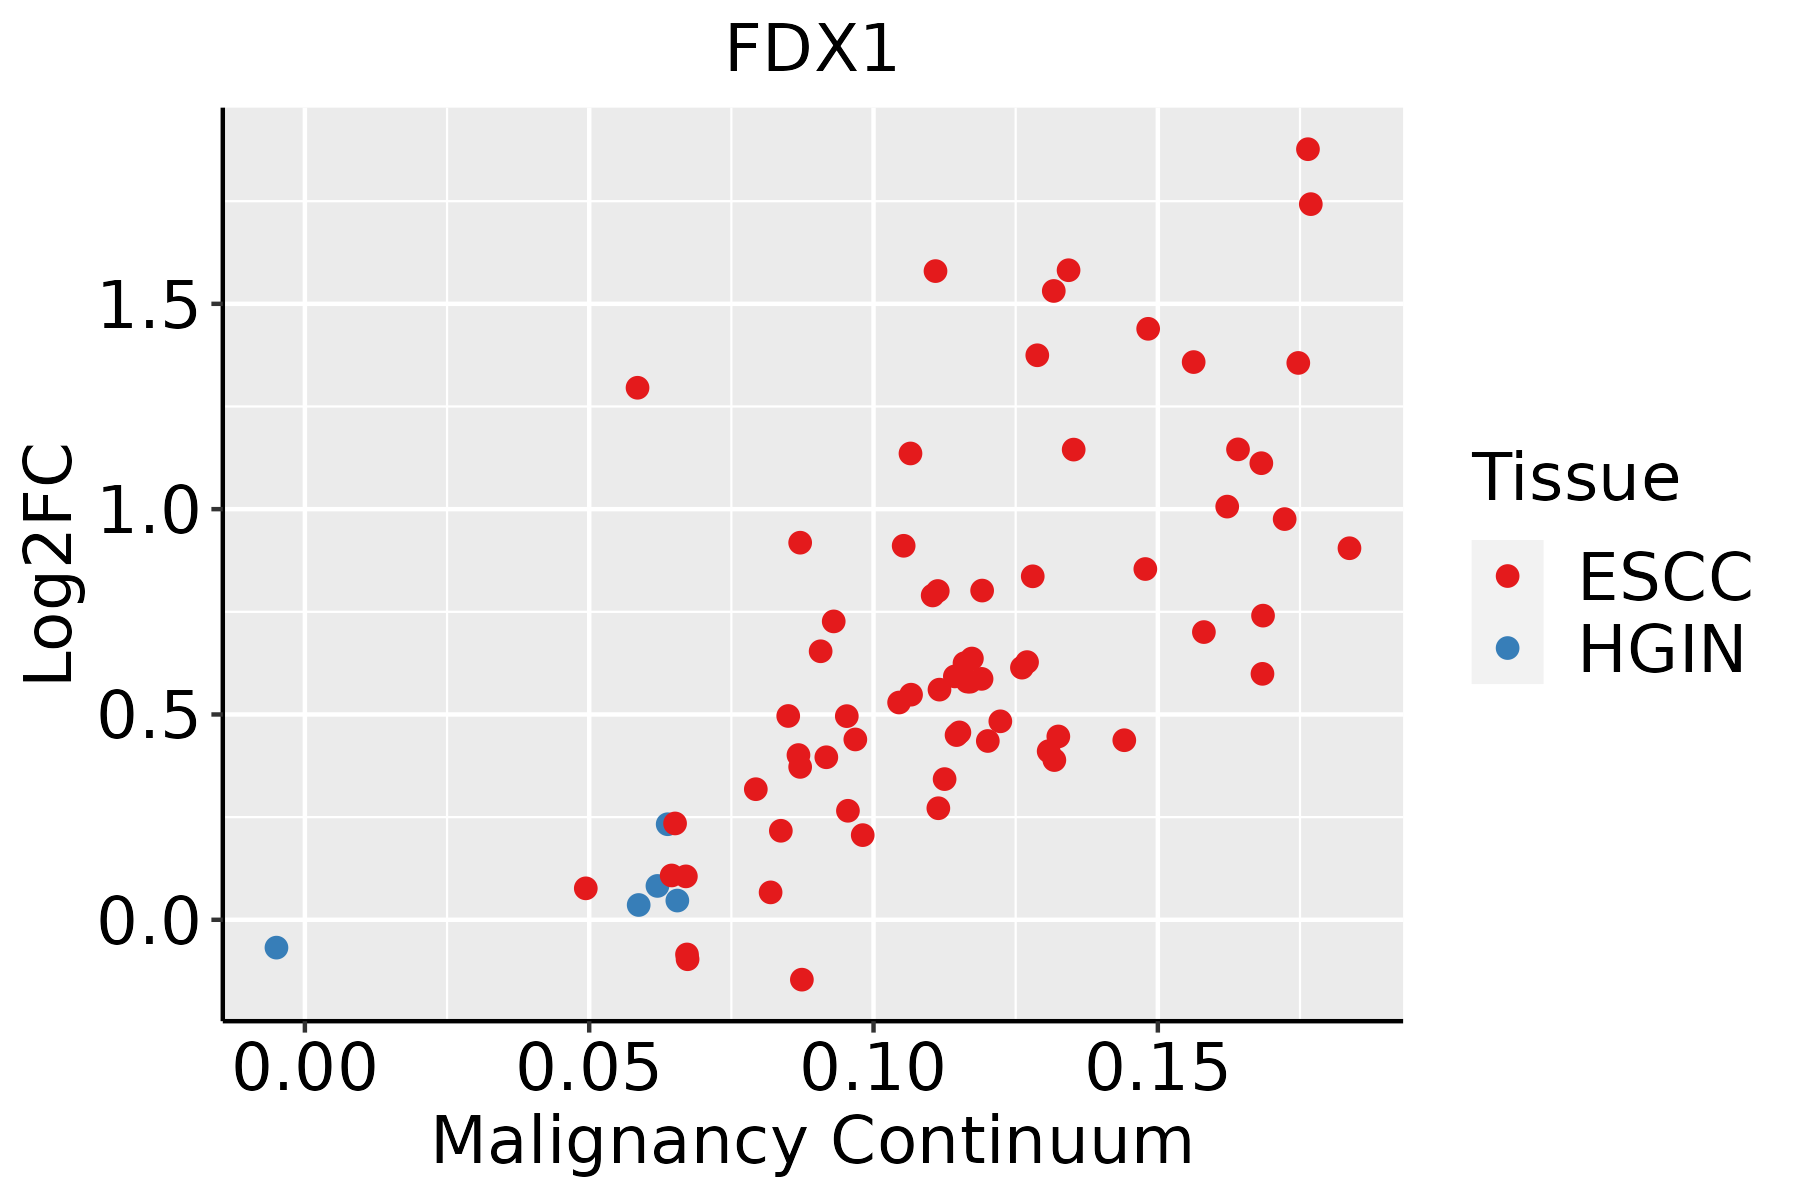 | ESCC: Esophageal squamous cell carcinoma |
| HGIN: High-grade intraepithelial neoplasias | ||
| LGIN: Low-grade intraepithelial neoplasias | ||
| Liver | 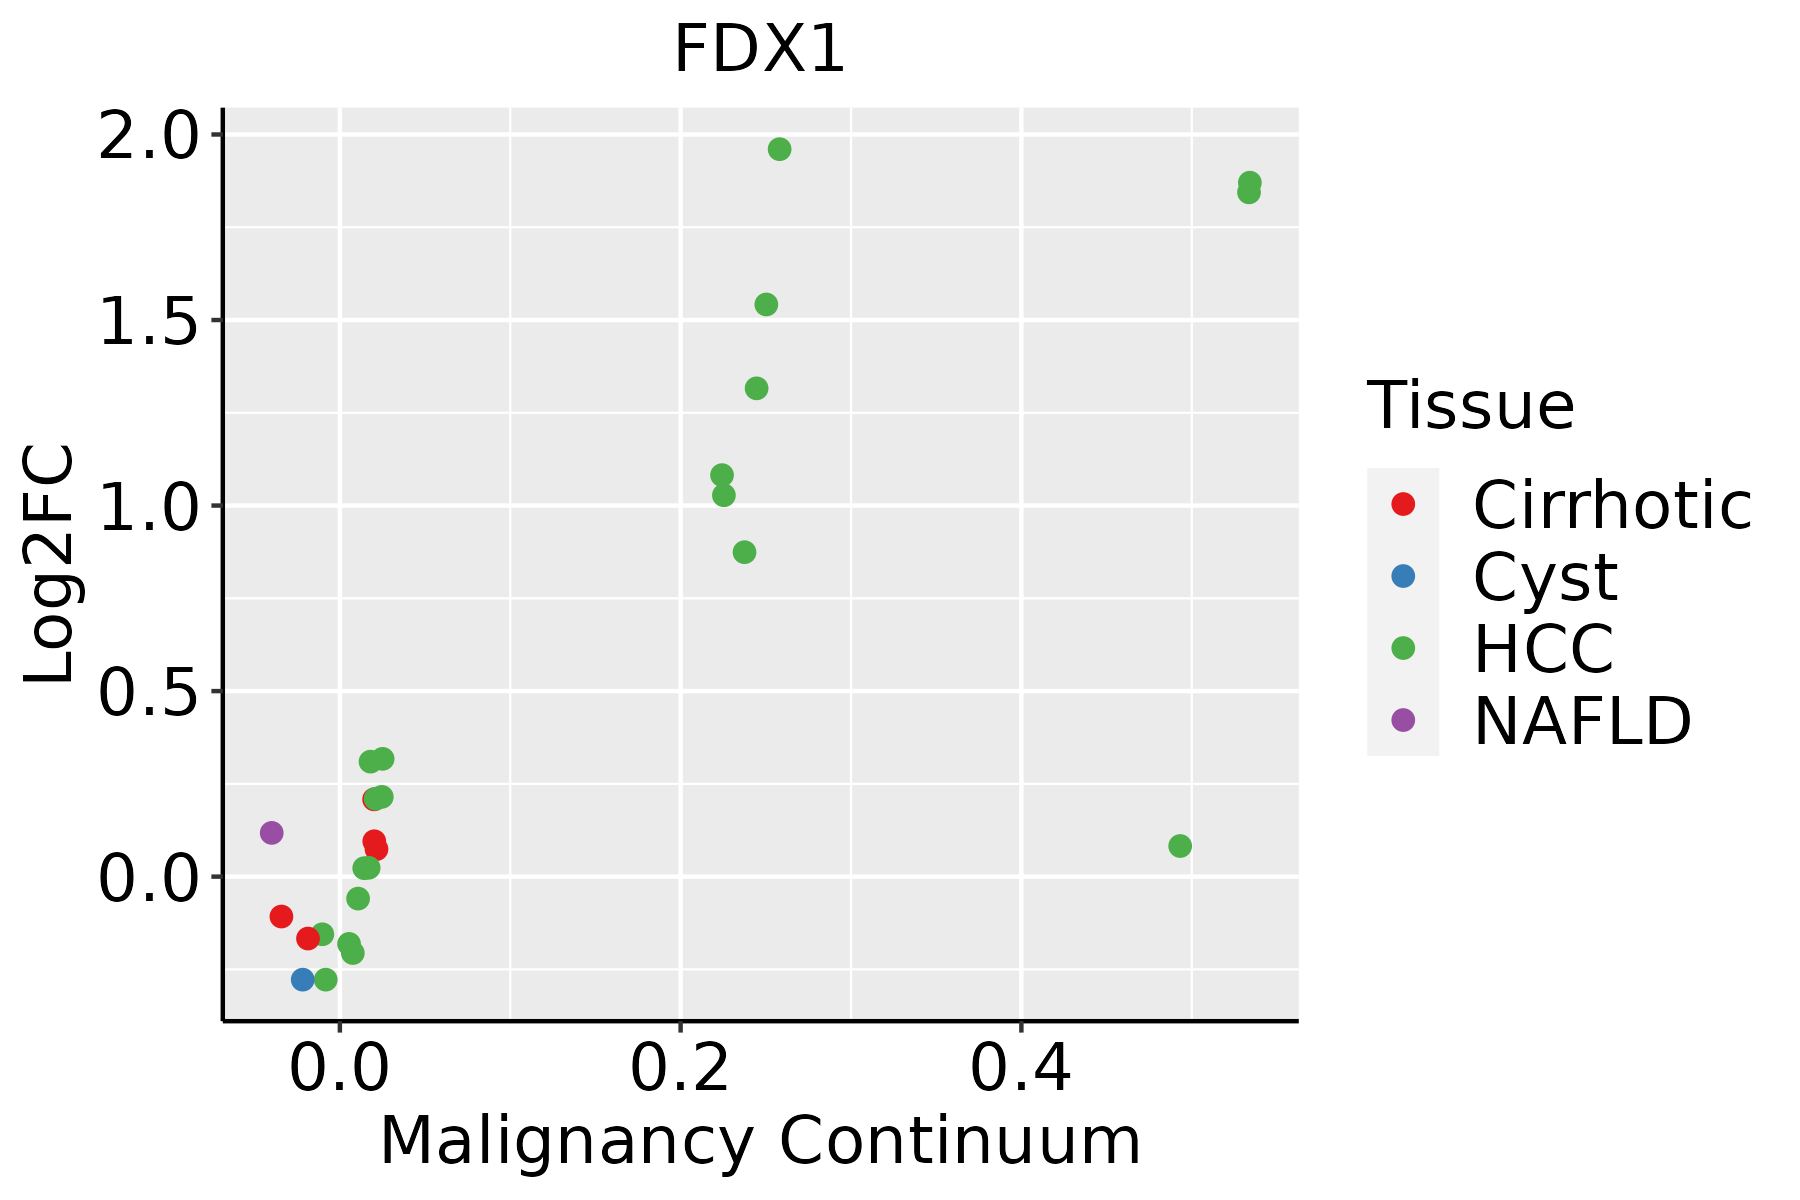 | HCC: Hepatocellular carcinoma |
| NAFLD: Non-alcoholic fatty liver disease | ||
| Oral Cavity |  | EOLP: Erosive Oral lichen planus |
| LP: leukoplakia | ||
| NEOLP: Non-erosive oral lichen planus | ||
| OSCC: Oral squamous cell carcinoma | ||
| Skin |  | AK: Actinic keratosis |
| cSCC: Cutaneous squamous cell carcinoma | ||
| SCCIS:squamous cell carcinoma in situ | ||
| Thyroid | 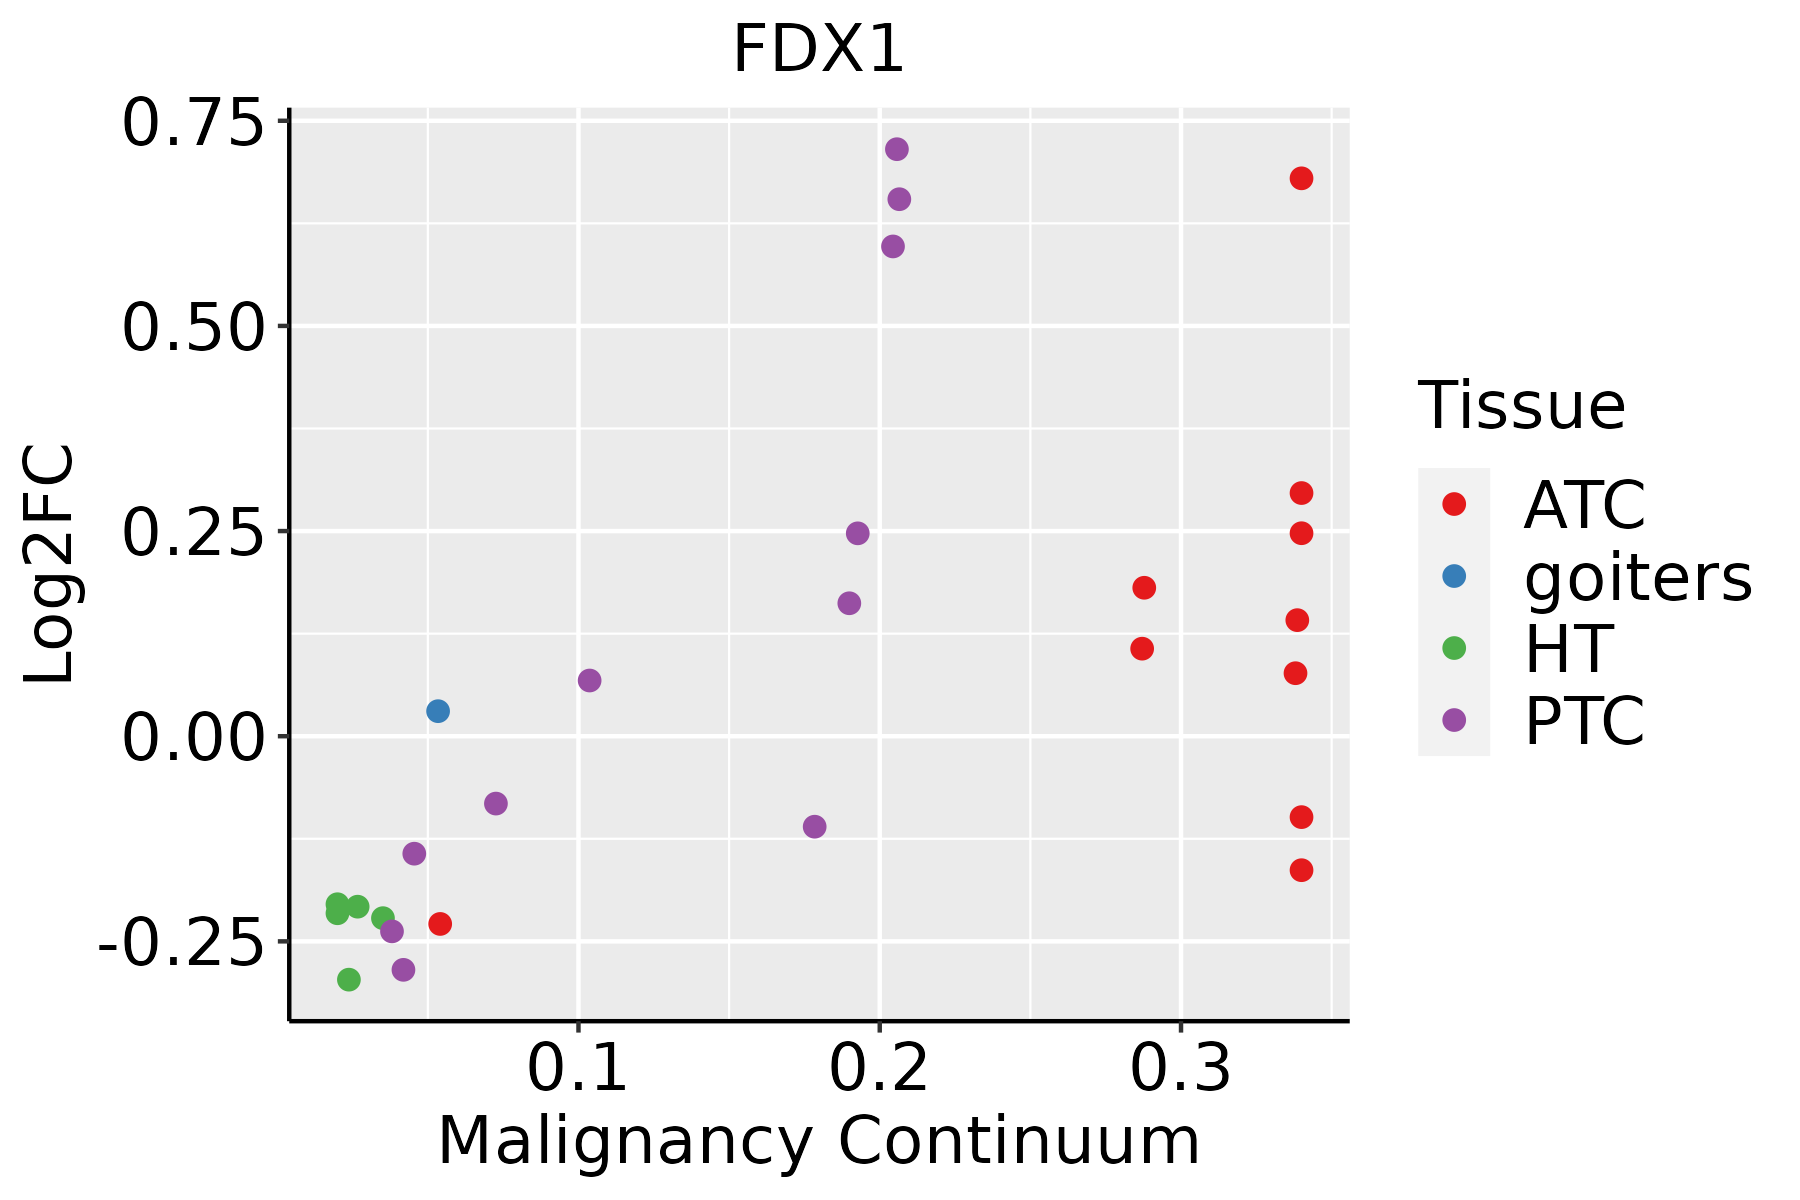 | ATC: Anaplastic thyroid cancer |
| HT: Hashimoto's thyroiditis | ||
| PTC: Papillary thyroid cancer |
| ∗log2FC in expression of this searched gene in stem-like cells from each diseased tissue sample relative to stem-like cells in normal samples in each tissue plotted against the malignancy continuum. Samples are colored based on if they are from different disease stage. |
Top |
Malignant transformation related pathway analysis |
| Find out the enriched GO biological processes and KEGG pathways involved in transition from healthy to precancer to cancer |
| Tissue | Disease Stage | Enriched GO biological Processes |
| Colorectum | AD |  |
| Colorectum | SER |  |
| Colorectum | MSS |  |
| Colorectum | MSI-H |  |
| Colorectum | FAP |  |
| ∗Top 15 enriched GO BP terms are showed in the bar plot of each disease state in each tissue. Each row represents a significant GO biological process which is colored according to the -log10(p.adjust). |
| Page: 1 2 3 4 5 6 7 8 9 |
| GO ID | Tissue | Disease Stage | Description | Gene Ratio | Bg Ratio | pvalue | p.adjust | Count |
| GO:0006091 | Colorectum | AD | generation of precursor metabolites and energy | 209/3918 | 490/18723 | 3.17e-28 | 6.61e-25 | 209 |
| GO:0022900 | Colorectum | AD | electron transport chain | 89/3918 | 175/18723 | 1.42e-18 | 8.91e-16 | 89 |
| GO:0006066 | Colorectum | AD | alcohol metabolic process | 106/3918 | 353/18723 | 3.02e-05 | 5.57e-04 | 106 |
| GO:1901654 | Colorectum | AD | response to ketone | 59/3918 | 194/18723 | 1.14e-03 | 1.04e-02 | 59 |
| GO:0051591 | Colorectum | AD | response to cAMP | 31/3918 | 93/18723 | 3.59e-03 | 2.58e-02 | 31 |
| GO:0071320 | Colorectum | AD | cellular response to cAMP | 20/3918 | 53/18723 | 3.71e-03 | 2.62e-02 | 20 |
| GO:0097305 | Colorectum | AD | response to alcohol | 71/3918 | 253/18723 | 4.01e-03 | 2.80e-02 | 71 |
| GO:0008202 | Colorectum | AD | steroid metabolic process | 85/3918 | 319/18723 | 8.07e-03 | 4.75e-02 | 85 |
| GO:00060914 | Colorectum | FAP | generation of precursor metabolites and energy | 128/2622 | 490/18723 | 5.58e-13 | 4.28e-10 | 128 |
| GO:00229004 | Colorectum | FAP | electron transport chain | 51/2622 | 175/18723 | 1.44e-07 | 9.03e-06 | 51 |
| GO:00515911 | Colorectum | FAP | response to cAMP | 27/2622 | 93/18723 | 1.26e-04 | 2.03e-03 | 27 |
| GO:19016544 | Colorectum | FAP | response to ketone | 45/2622 | 194/18723 | 3.67e-04 | 4.63e-03 | 45 |
| GO:0046683 | Colorectum | FAP | response to organophosphorus | 33/2622 | 131/18723 | 4.61e-04 | 5.39e-03 | 33 |
| GO:00973053 | Colorectum | FAP | response to alcohol | 55/2622 | 253/18723 | 5.05e-04 | 5.78e-03 | 55 |
| GO:00713202 | Colorectum | FAP | cellular response to cAMP | 17/2622 | 53/18723 | 6.20e-04 | 6.82e-03 | 17 |
| GO:0097306 | Colorectum | FAP | cellular response to alcohol | 25/2622 | 93/18723 | 7.87e-04 | 8.29e-03 | 25 |
| GO:0014074 | Colorectum | FAP | response to purine-containing compound | 35/2622 | 148/18723 | 1.09e-03 | 1.05e-02 | 35 |
| GO:00060663 | Colorectum | FAP | alcohol metabolic process | 69/2622 | 353/18723 | 2.29e-03 | 1.85e-02 | 69 |
| GO:0006091110 | Esophagus | ESCC | generation of precursor metabolites and energy | 331/8552 | 490/18723 | 3.86e-23 | 8.45e-21 | 331 |
| GO:0022900110 | Esophagus | ESCC | electron transport chain | 133/8552 | 175/18723 | 2.18e-16 | 1.67e-14 | 133 |
| Page: 1 2 3 4 5 |
| Pathway ID | Tissue | Disease Stage | Description | Gene Ratio | Bg Ratio | pvalue | p.adjust | qvalue | Count |
| Page: 1 |
Top |
Cell-cell communication analysis |
| Identification of potential cell-cell interactions between two cell types and their ligand-receptor pairs for different disease states |
| Ligand | Receptor | LRpair | Pathway | Tissue | Disease Stage |
| Page: 1 |
Top |
Single-cell gene regulatory network inference analysis |
| Find out the significant the regulons (TFs) and the target genes of each regulon across cell types for different disease states |
| TF | Cell Type | Tissue | Disease Stage | Target Gene | RSS | Regulon Activity |
| ∗The dot plots of a searched regulon are shown for all cell subpopulations in each disease state of each tissue based on the regulon specific score inferred using pySCENIC and by calculating the average expression. |
| Page: 1 |
Top |
Somatic mutation of malignant transformation related genes |
| Annotation of somatic variants for genes involved in malignant transformation |
| Hugo Symbol | Variant Class | Variant Classification | dbSNP RS | HGVSc | HGVSp | HGVSp Short | SWISSPROT | BIOTYPE | SIFT | PolyPhen | Tumor Sample Barcode | Tissue | Histology | Sex | Age | Stage | Therapy Types | Drugs | Outcome |
| FDX1 | SNV | Missense_Mutation | novel | c.485A>G | p.Asn162Ser | p.N162S | P10109 | protein_coding | deleterious(0.01) | benign(0.022) | TCGA-AZ-4315-01 | Colorectum | colon adenocarcinoma | Male | <65 | I/II | Unknown | Unknown | SD |
| FDX1 | SNV | Missense_Mutation | novel | c.446N>A | p.Arg149Gln | p.R149Q | P10109 | protein_coding | deleterious(0.01) | probably_damaging(1) | TCGA-AX-A1CE-01 | Endometrium | uterine corpus endometrioid carcinoma | Female | <65 | I/II | Unspecific | Paclitaxel | SD |
| FDX1 | SNV | Missense_Mutation | rs367844705 | c.546G>T | p.Lys182Asn | p.K182N | P10109 | protein_coding | deleterious_low_confidence(0.02) | possibly_damaging(0.672) | TCGA-D1-A103-01 | Endometrium | uterine corpus endometrioid carcinoma | Female | >=65 | I/II | Unknown | Unknown | SD |
| FDX1 | SNV | Missense_Mutation | novel | c.514N>A | p.Ala172Thr | p.A172T | P10109 | protein_coding | tolerated(0.44) | benign(0.018) | TCGA-DI-A1BU-01 | Endometrium | uterine corpus endometrioid carcinoma | Female | <65 | I/II | Chemotherapy | paclitaxel | SD |
| FDX1 | SNV | Missense_Mutation | c.399N>T | p.Glu133Asp | p.E133D | P10109 | protein_coding | deleterious(0.03) | benign(0.09) | TCGA-44-6778-01 | Lung | lung adenocarcinoma | Male | <65 | I/II | Unknown | Unknown | SD | |
| FDX1 | SNV | Missense_Mutation | c.418N>G | p.Leu140Val | p.L140V | P10109 | protein_coding | deleterious(0) | possibly_damaging(0.808) | TCGA-55-7994-01 | Lung | lung adenocarcinoma | Male | >=65 | I/II | Chemotherapy | carboplatin | CR | |
| FDX1 | SNV | Missense_Mutation | novel | c.491C>G | p.Thr164Ser | p.T164S | P10109 | protein_coding | deleterious(0.01) | benign(0.242) | TCGA-69-8255-01 | Lung | lung adenocarcinoma | Male | >=65 | I/II | Unknown | Unknown | SD |
| FDX1 | SNV | Missense_Mutation | novel | c.422C>A | p.Ala141Glu | p.A141E | P10109 | protein_coding | deleterious(0) | probably_damaging(0.999) | TCGA-CQ-6218-01 | Oral cavity | head & neck squamous cell carcinoma | Female | <65 | I/II | Chemotherapy | cisplatin | SD |
| FDX1 | SNV | Missense_Mutation | novel | c.326C>G | p.Thr109Ser | p.T109S | P10109 | protein_coding | deleterious(0) | benign(0.165) | TCGA-CR-6484-01 | Oral cavity | head & neck squamous cell carcinoma | Female | >=65 | I/II | Chemotherapy | carboplatin | SD |
| FDX1 | SNV | Missense_Mutation | novel | c.263N>T | p.Ser88Phe | p.S88F | P10109 | protein_coding | deleterious(0) | probably_damaging(0.996) | TCGA-CV-7427-01 | Oral cavity | head & neck squamous cell carcinoma | Female | >=65 | I/II | Unknown | Unknown | PD |
| Page: 1 2 |
Top |
Related drugs of malignant transformation related genes |
| Identification of chemicals and drugs interact with genes involved in malignant transfromation |
| (DGIdb 4.0) |
| Entrez ID | Symbol | Category | Interaction Types | Drug Claim Name | Drug Name | PMIDs |
| Page: 1 |

Copyright 2023-Present -The University of Texas Health Science Center at Houston |