
|
|||||
|
 | |
| |
| |
| |
| |
| |
|
Gene: FDFT1 |
Gene summary for FDFT1 |
| Gene information | Species | Human | Gene symbol | FDFT1 | Gene ID | 2222 |
| Gene name | farnesyl-diphosphate farnesyltransferase 1 | |
| Gene Alias | DGPT | |
| Cytomap | 8p23.1 | |
| Gene Type | protein-coding | GO ID | GO:0006066 | UniProtAcc | P37268 |
Top |
Malignant transformation analysis |
| Identification of the aberrant gene expression in precancerous and cancerous lesions by comparing the gene expression of stem-like cells in diseased tissues with normal stem cells |
| Entrez ID | Symbol | Replicates | Species | Organ | Tissue | Adj P-value | Log2FC | Malignancy |
| 2222 | FDFT1 | HTA11_2487_2000001011 | Human | Colorectum | SER | 1.46e-07 | 7.69e-01 | -0.1808 |
| 2222 | FDFT1 | HTA11_78_2000001011 | Human | Colorectum | AD | 3.28e-08 | 6.89e-01 | -0.1088 |
| 2222 | FDFT1 | HTA11_347_2000001011 | Human | Colorectum | AD | 1.16e-09 | 5.62e-01 | -0.1954 |
| 2222 | FDFT1 | HTA11_411_2000001011 | Human | Colorectum | SER | 1.80e-07 | 1.58e+00 | -0.2602 |
| 2222 | FDFT1 | HTA11_2112_2000001011 | Human | Colorectum | SER | 1.65e-06 | 1.27e+00 | -0.2196 |
| 2222 | FDFT1 | HTA11_696_2000001011 | Human | Colorectum | AD | 5.94e-14 | 8.40e-01 | -0.1464 |
| 2222 | FDFT1 | HTA11_1391_2000001011 | Human | Colorectum | AD | 1.81e-08 | 7.70e-01 | -0.059 |
| 2222 | FDFT1 | HTA11_2992_2000001011 | Human | Colorectum | SER | 4.83e-02 | 7.55e-01 | -0.1706 |
| 2222 | FDFT1 | HTA11_866_3004761011 | Human | Colorectum | AD | 3.83e-03 | 4.46e-01 | 0.096 |
| 2222 | FDFT1 | HTA11_99999970781_79442 | Human | Colorectum | MSS | 1.99e-15 | 8.41e-01 | 0.294 |
| 2222 | FDFT1 | HTA11_99999965062_69753 | Human | Colorectum | MSI-H | 2.50e-03 | 1.22e+00 | 0.3487 |
| 2222 | FDFT1 | A001-C-207 | Human | Colorectum | FAP | 9.65e-03 | -3.00e-01 | 0.1278 |
| 2222 | FDFT1 | A015-C-203 | Human | Colorectum | FAP | 1.77e-18 | -4.48e-01 | -0.1294 |
| 2222 | FDFT1 | A015-C-204 | Human | Colorectum | FAP | 2.89e-06 | -3.94e-01 | -0.0228 |
| 2222 | FDFT1 | A014-C-040 | Human | Colorectum | FAP | 3.77e-02 | -4.28e-01 | -0.1184 |
| 2222 | FDFT1 | A002-C-201 | Human | Colorectum | FAP | 4.39e-10 | -3.66e-01 | 0.0324 |
| 2222 | FDFT1 | A001-C-119 | Human | Colorectum | FAP | 3.76e-07 | -4.62e-01 | -0.1557 |
| 2222 | FDFT1 | A001-C-108 | Human | Colorectum | FAP | 9.44e-10 | -3.46e-01 | -0.0272 |
| 2222 | FDFT1 | A002-C-205 | Human | Colorectum | FAP | 1.13e-12 | -3.91e-01 | -0.1236 |
| 2222 | FDFT1 | A001-C-104 | Human | Colorectum | FAP | 8.58e-08 | -3.97e-01 | 0.0184 |
| Page: 1 2 3 4 5 6 7 8 9 10 |
| Tissue | Expression Dynamics | Abbreviation |
| Colorectum (GSE201348) |  | FAP: Familial adenomatous polyposis |
| CRC: Colorectal cancer | ||
| Colorectum (HTA11) |  | AD: Adenomas |
| SER: Sessile serrated lesions | ||
| MSI-H: Microsatellite-high colorectal cancer | ||
| MSS: Microsatellite stable colorectal cancer | ||
| Esophagus | 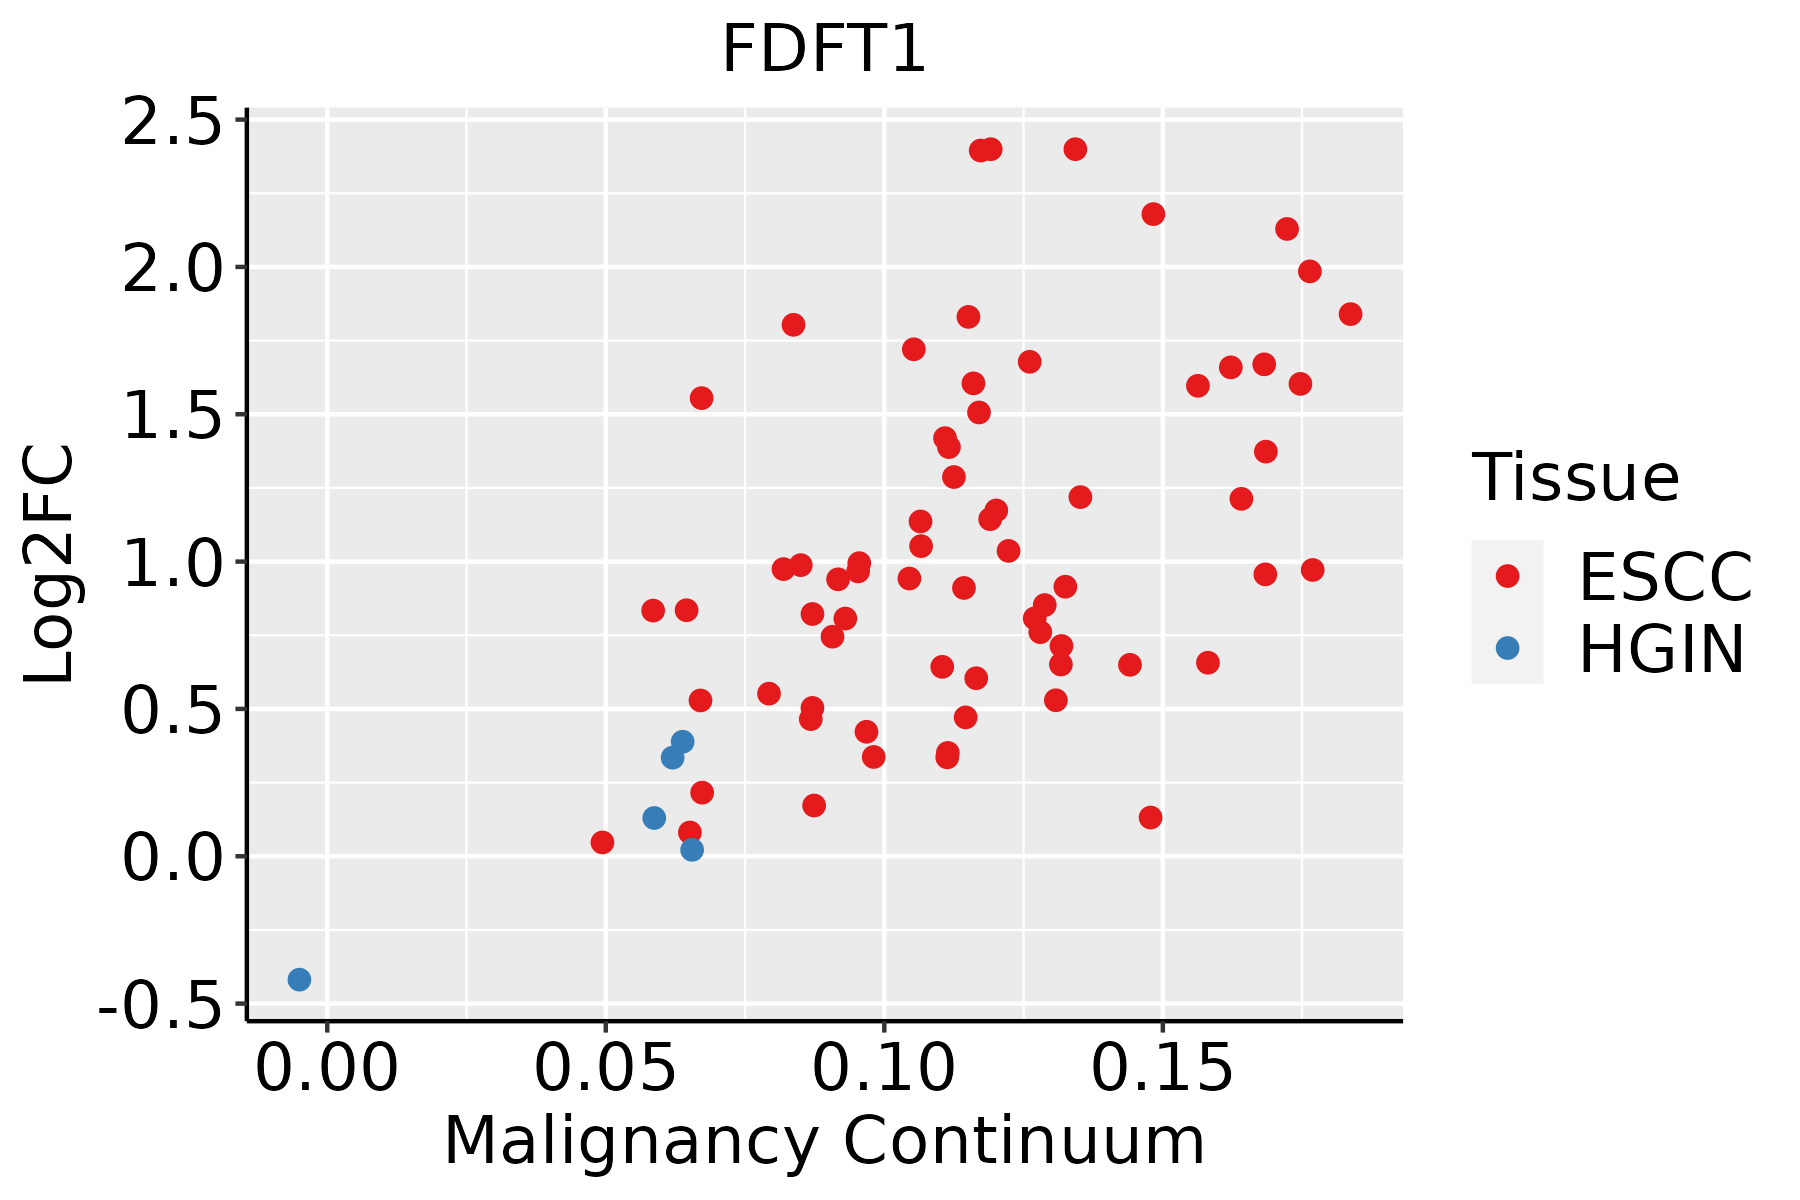 | ESCC: Esophageal squamous cell carcinoma |
| HGIN: High-grade intraepithelial neoplasias | ||
| LGIN: Low-grade intraepithelial neoplasias | ||
| GC | 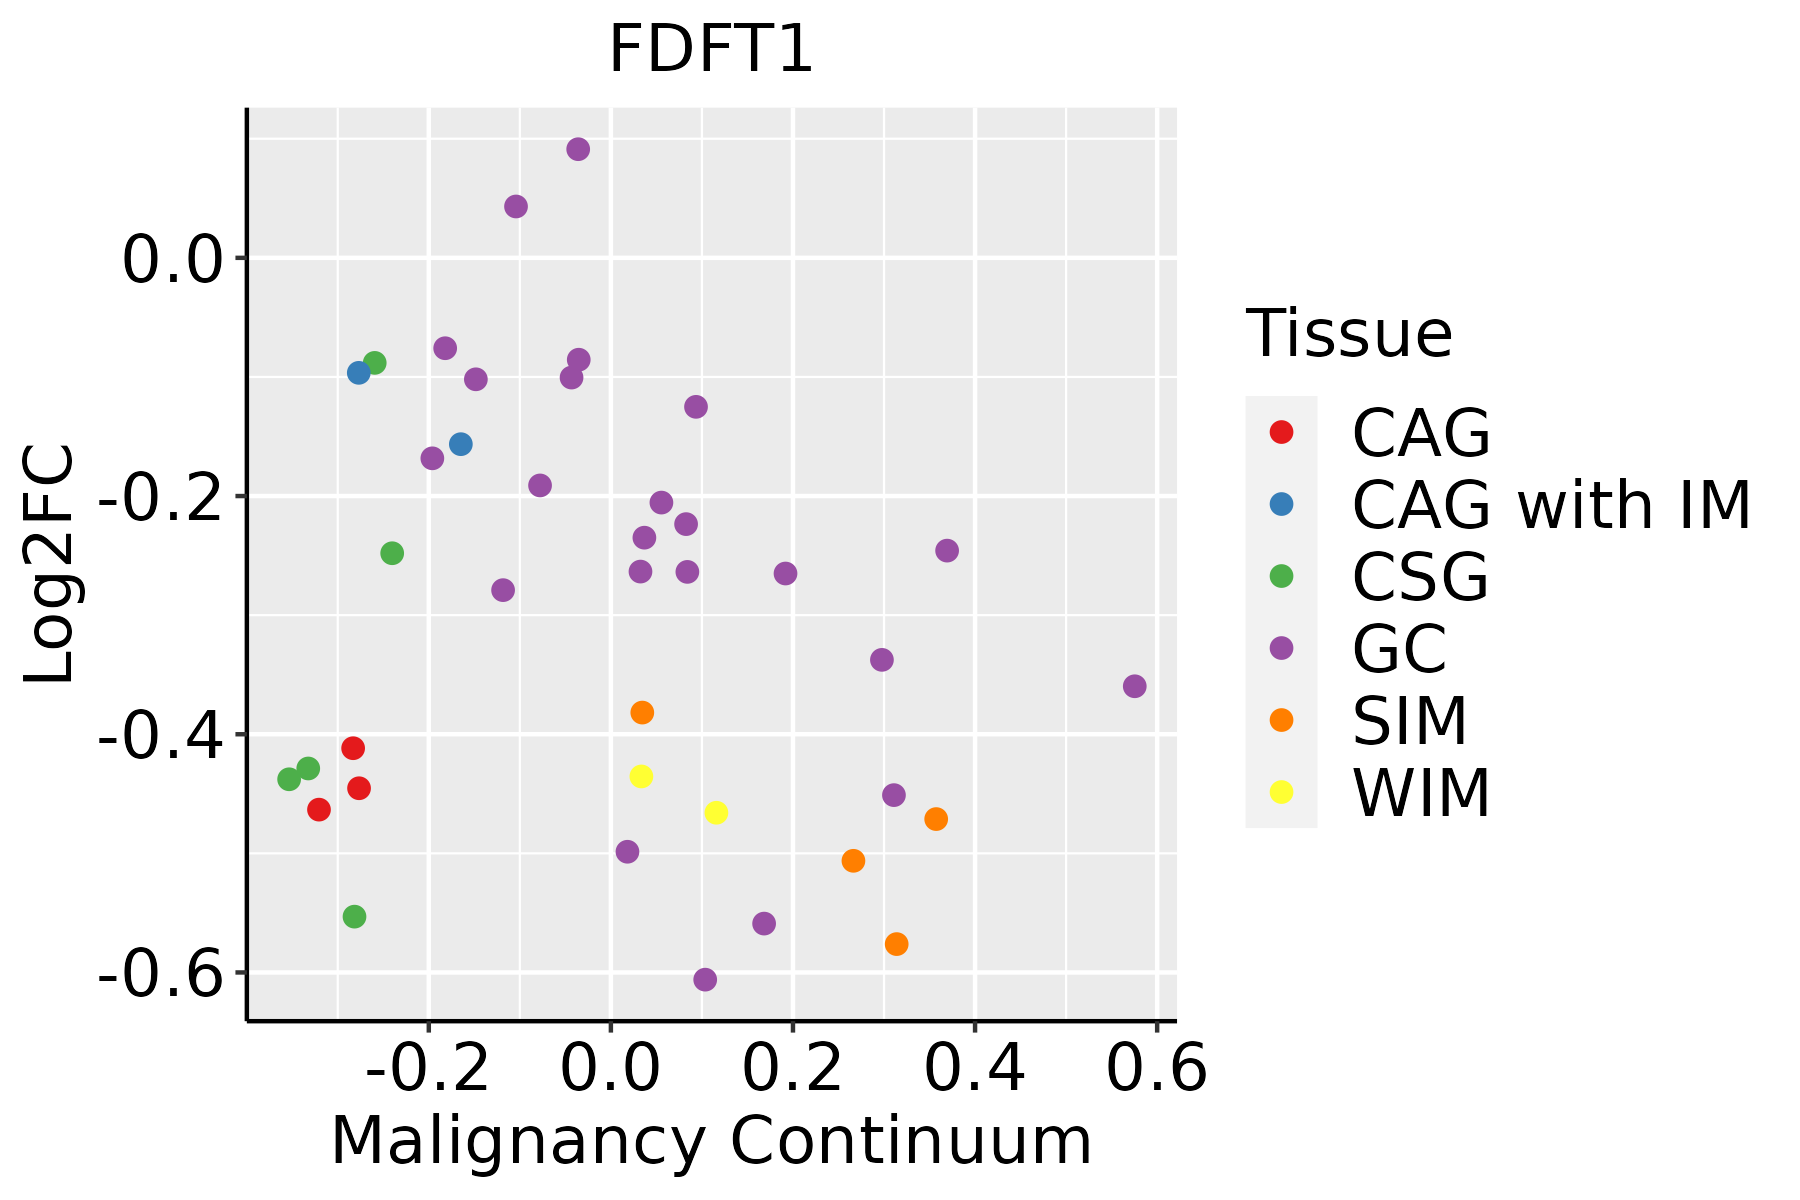 | CAG: Chronic atrophic gastritis |
| CAG with IM: Chronic atrophic gastritis with intestinal metaplasia | ||
| CSG: Chronic superficial gastritis | ||
| GC: Gastric cancer | ||
| SIM: Severe intestinal metaplasia | ||
| WIM: Wild intestinal metaplasia | ||
| Liver | 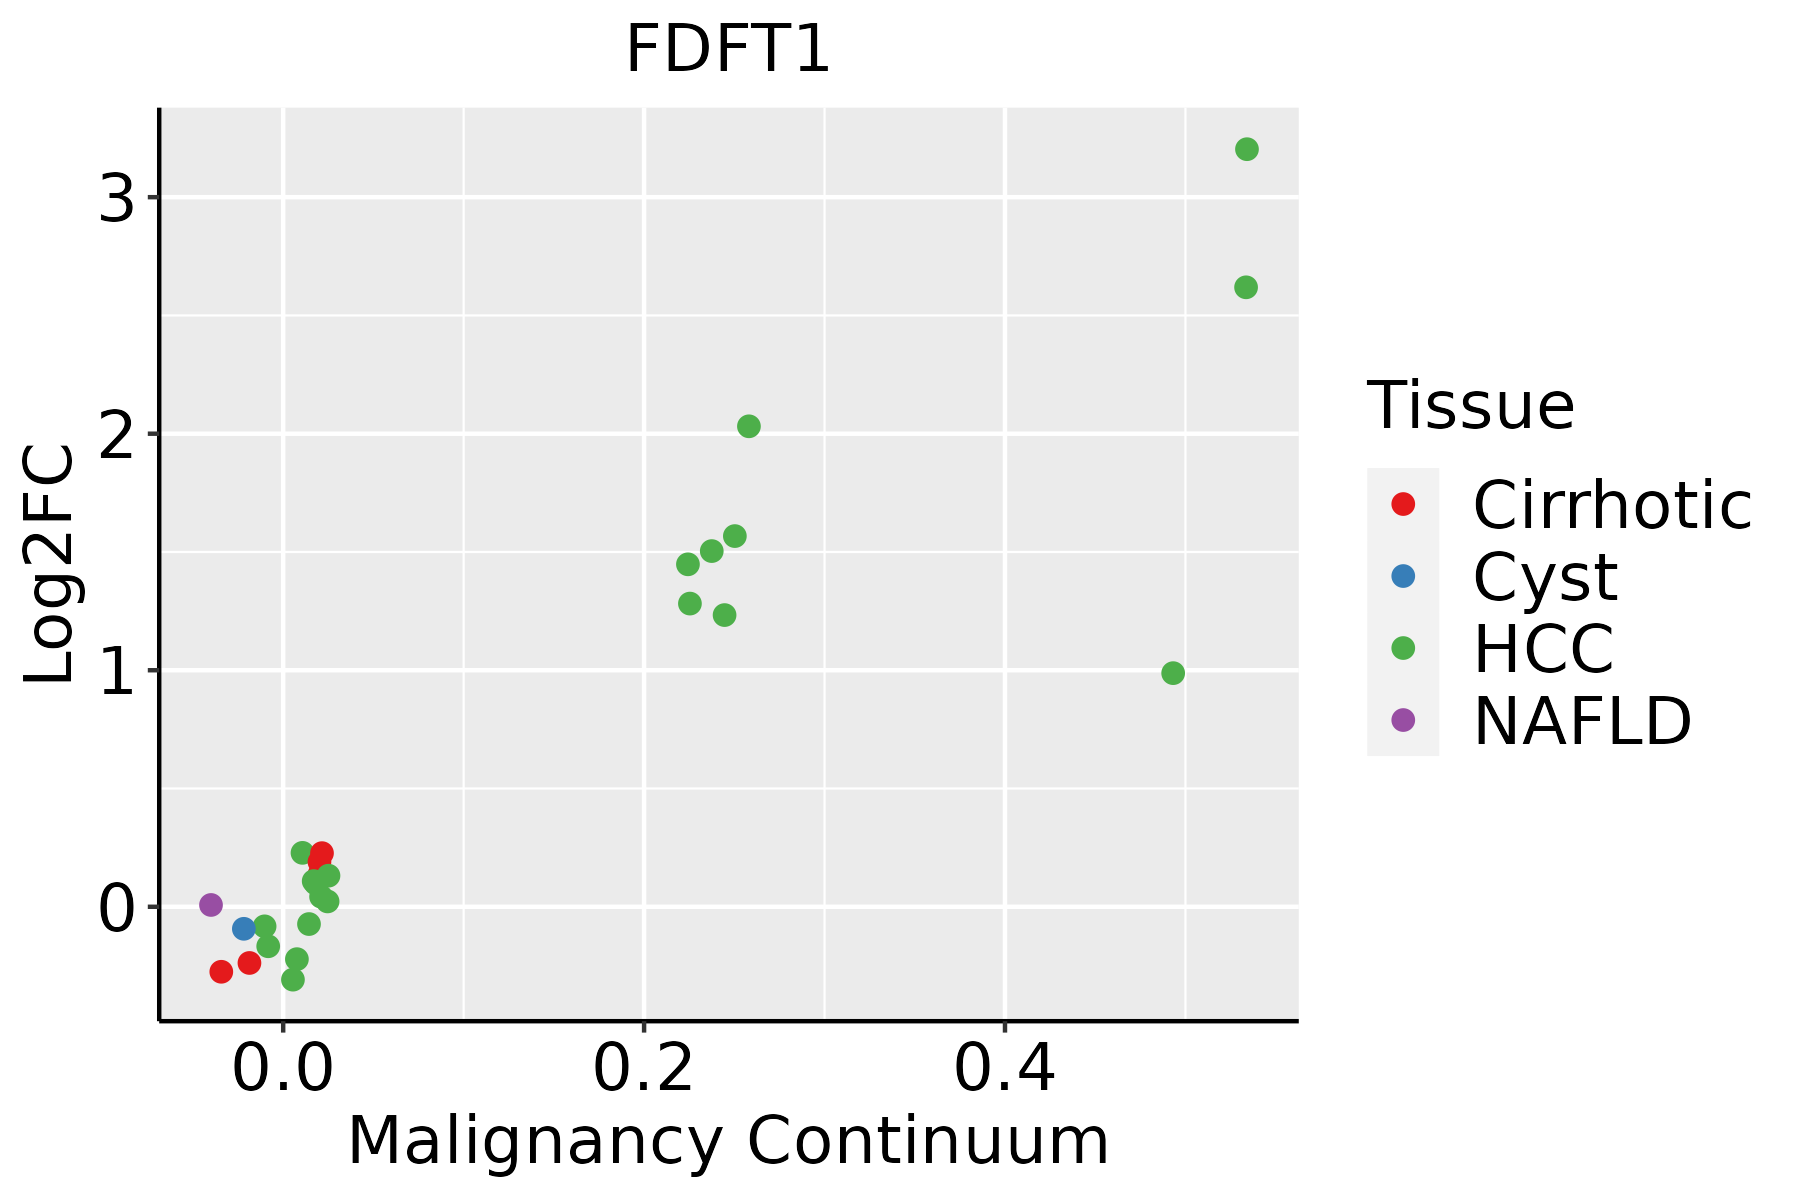 | HCC: Hepatocellular carcinoma |
| NAFLD: Non-alcoholic fatty liver disease | ||
| Oral Cavity | 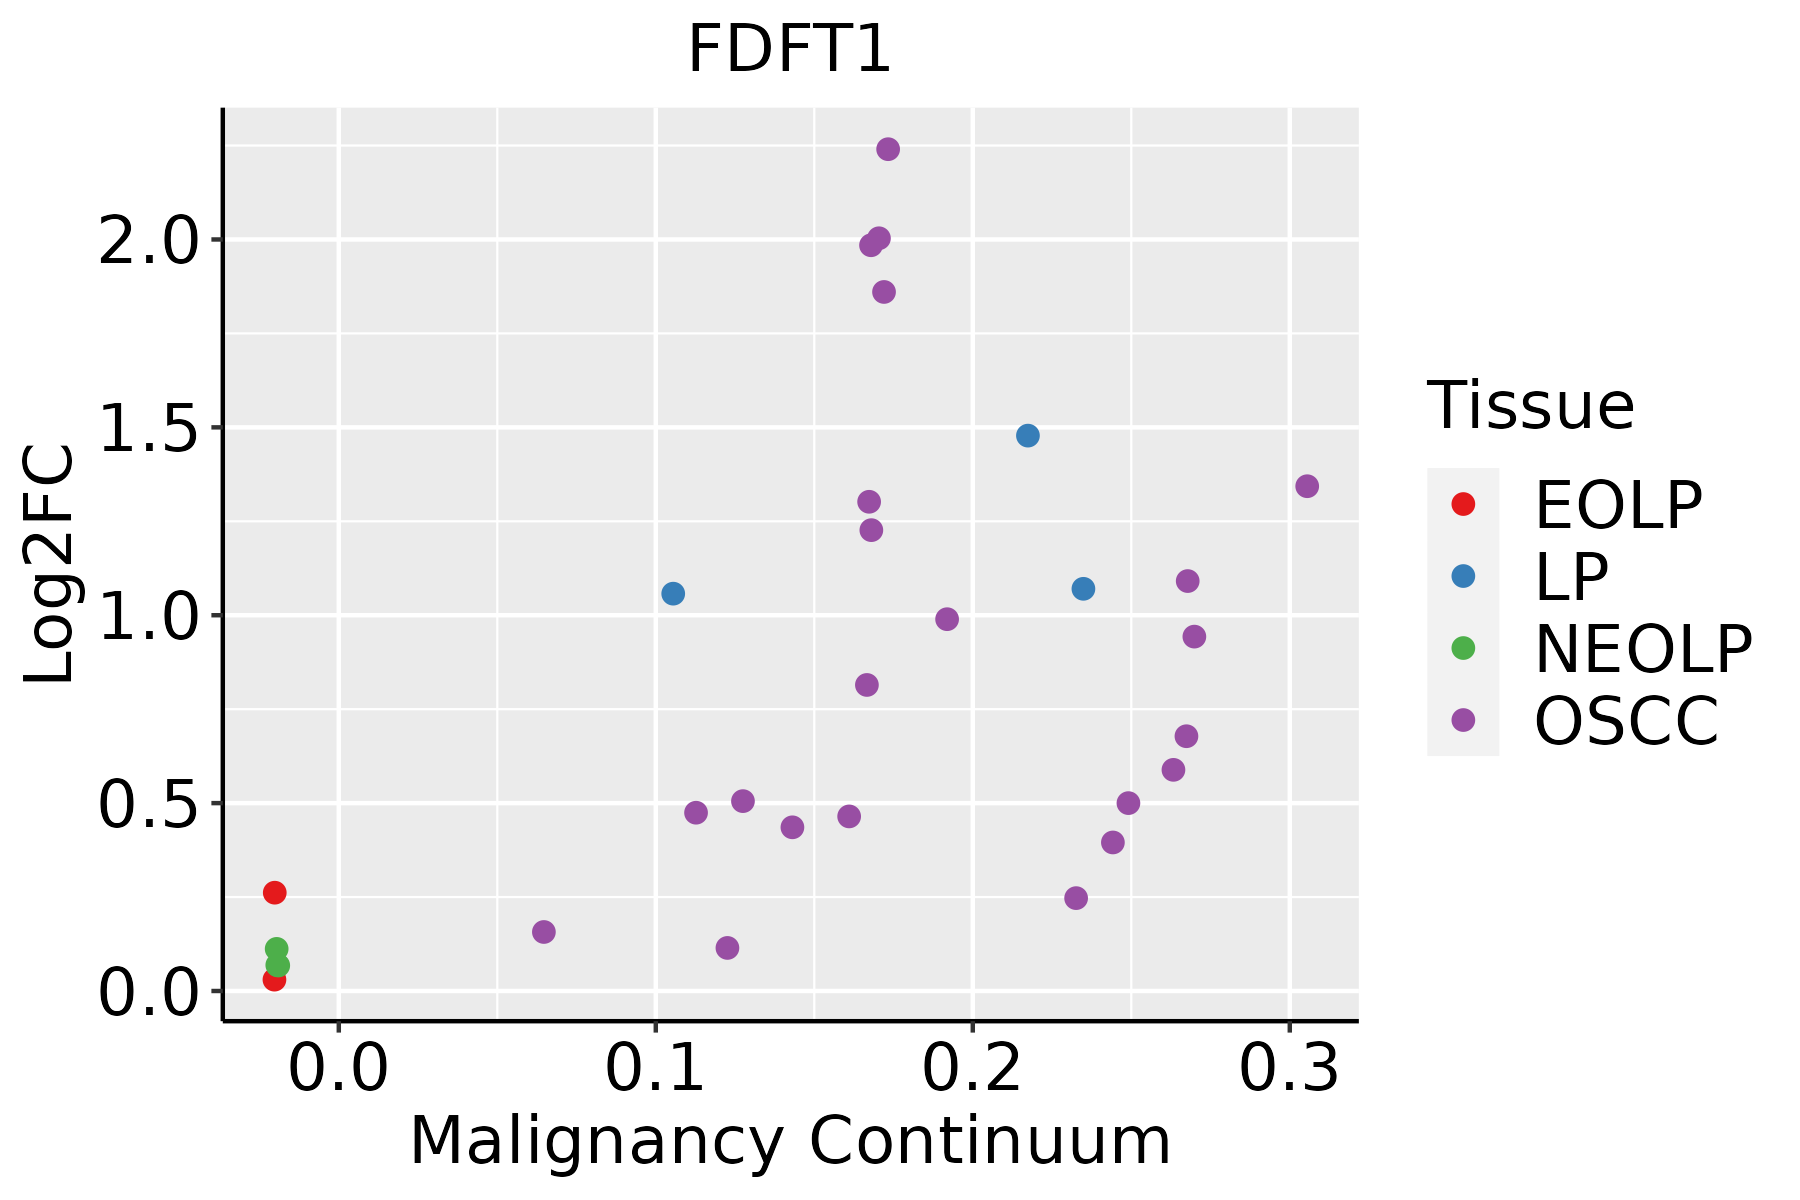 | EOLP: Erosive Oral lichen planus |
| LP: leukoplakia | ||
| NEOLP: Non-erosive oral lichen planus | ||
| OSCC: Oral squamous cell carcinoma | ||
| Prostate | 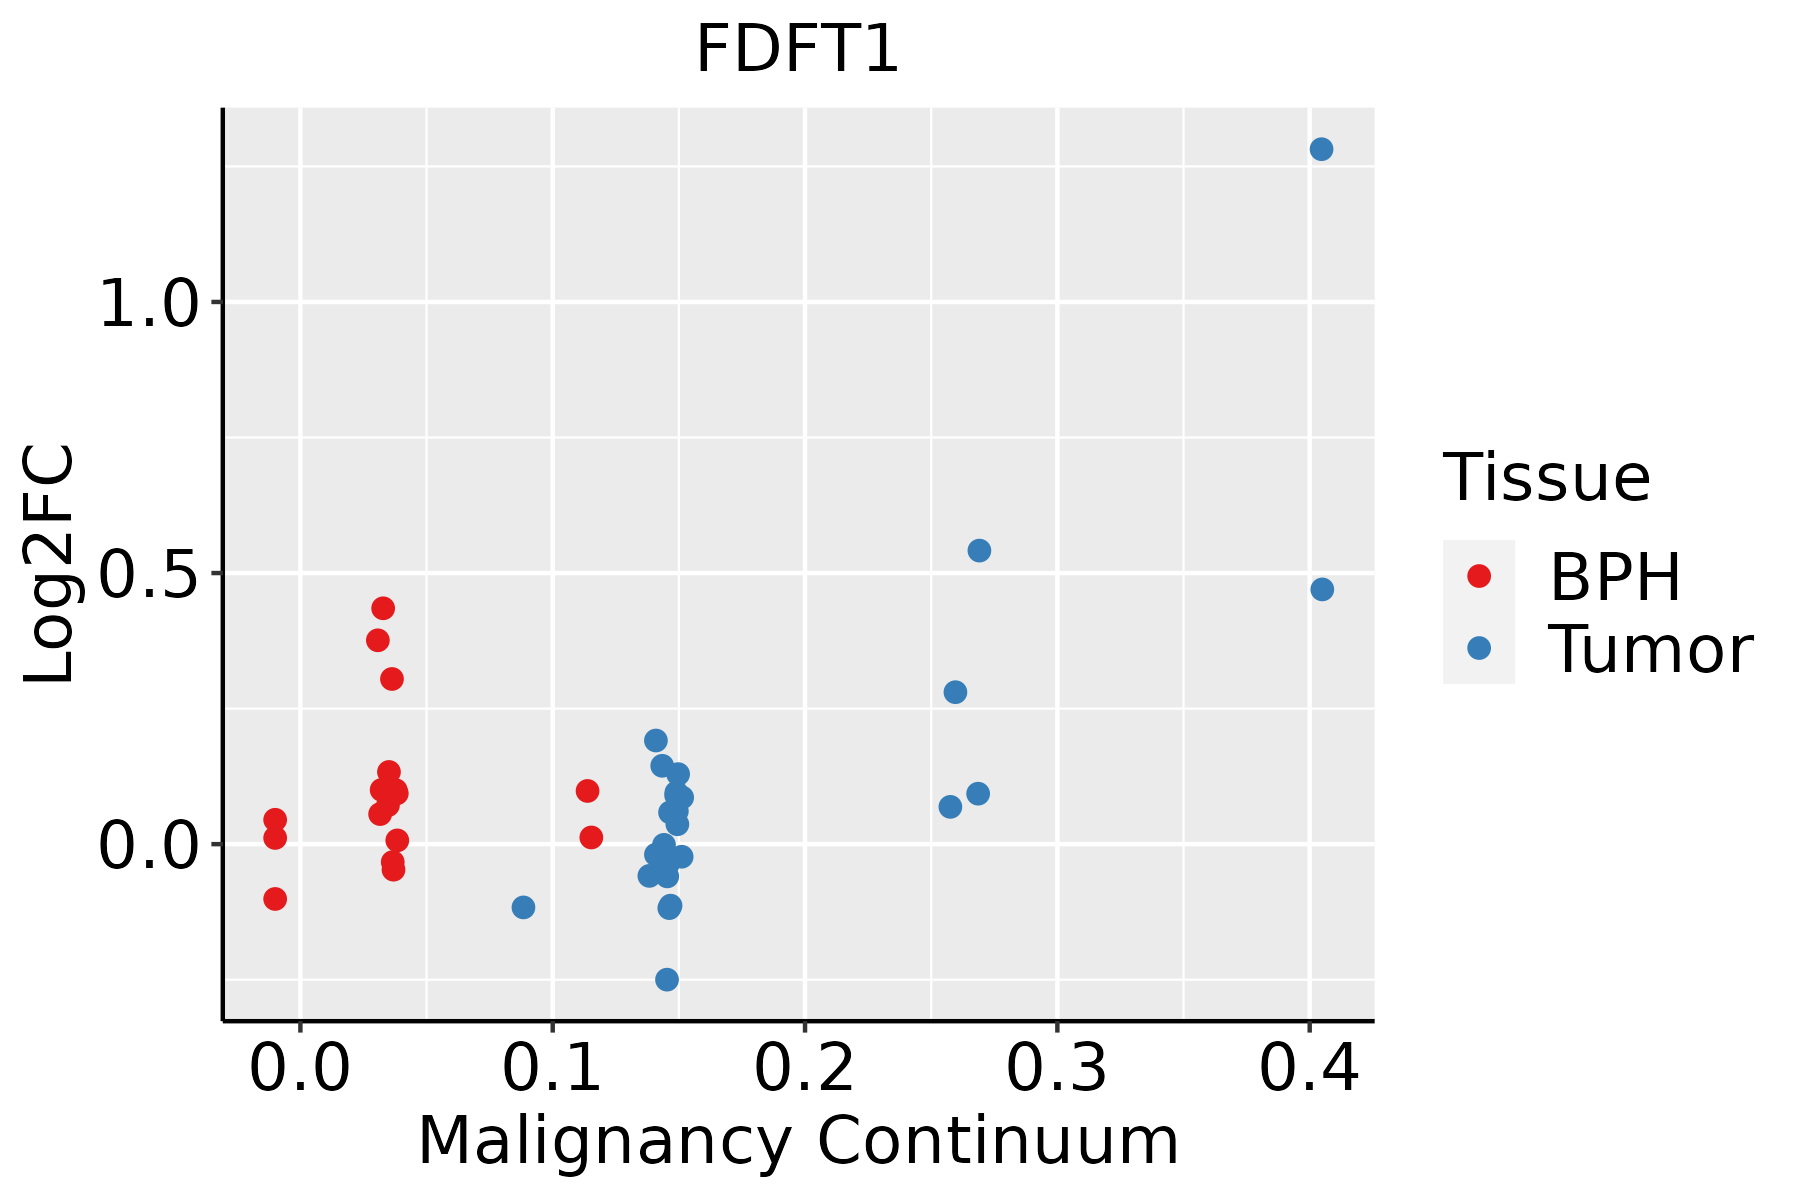 | BPH: Benign Prostatic Hyperplasia |
| Skin |  | AK: Actinic keratosis |
| cSCC: Cutaneous squamous cell carcinoma | ||
| SCCIS:squamous cell carcinoma in situ | ||
| Thyroid | 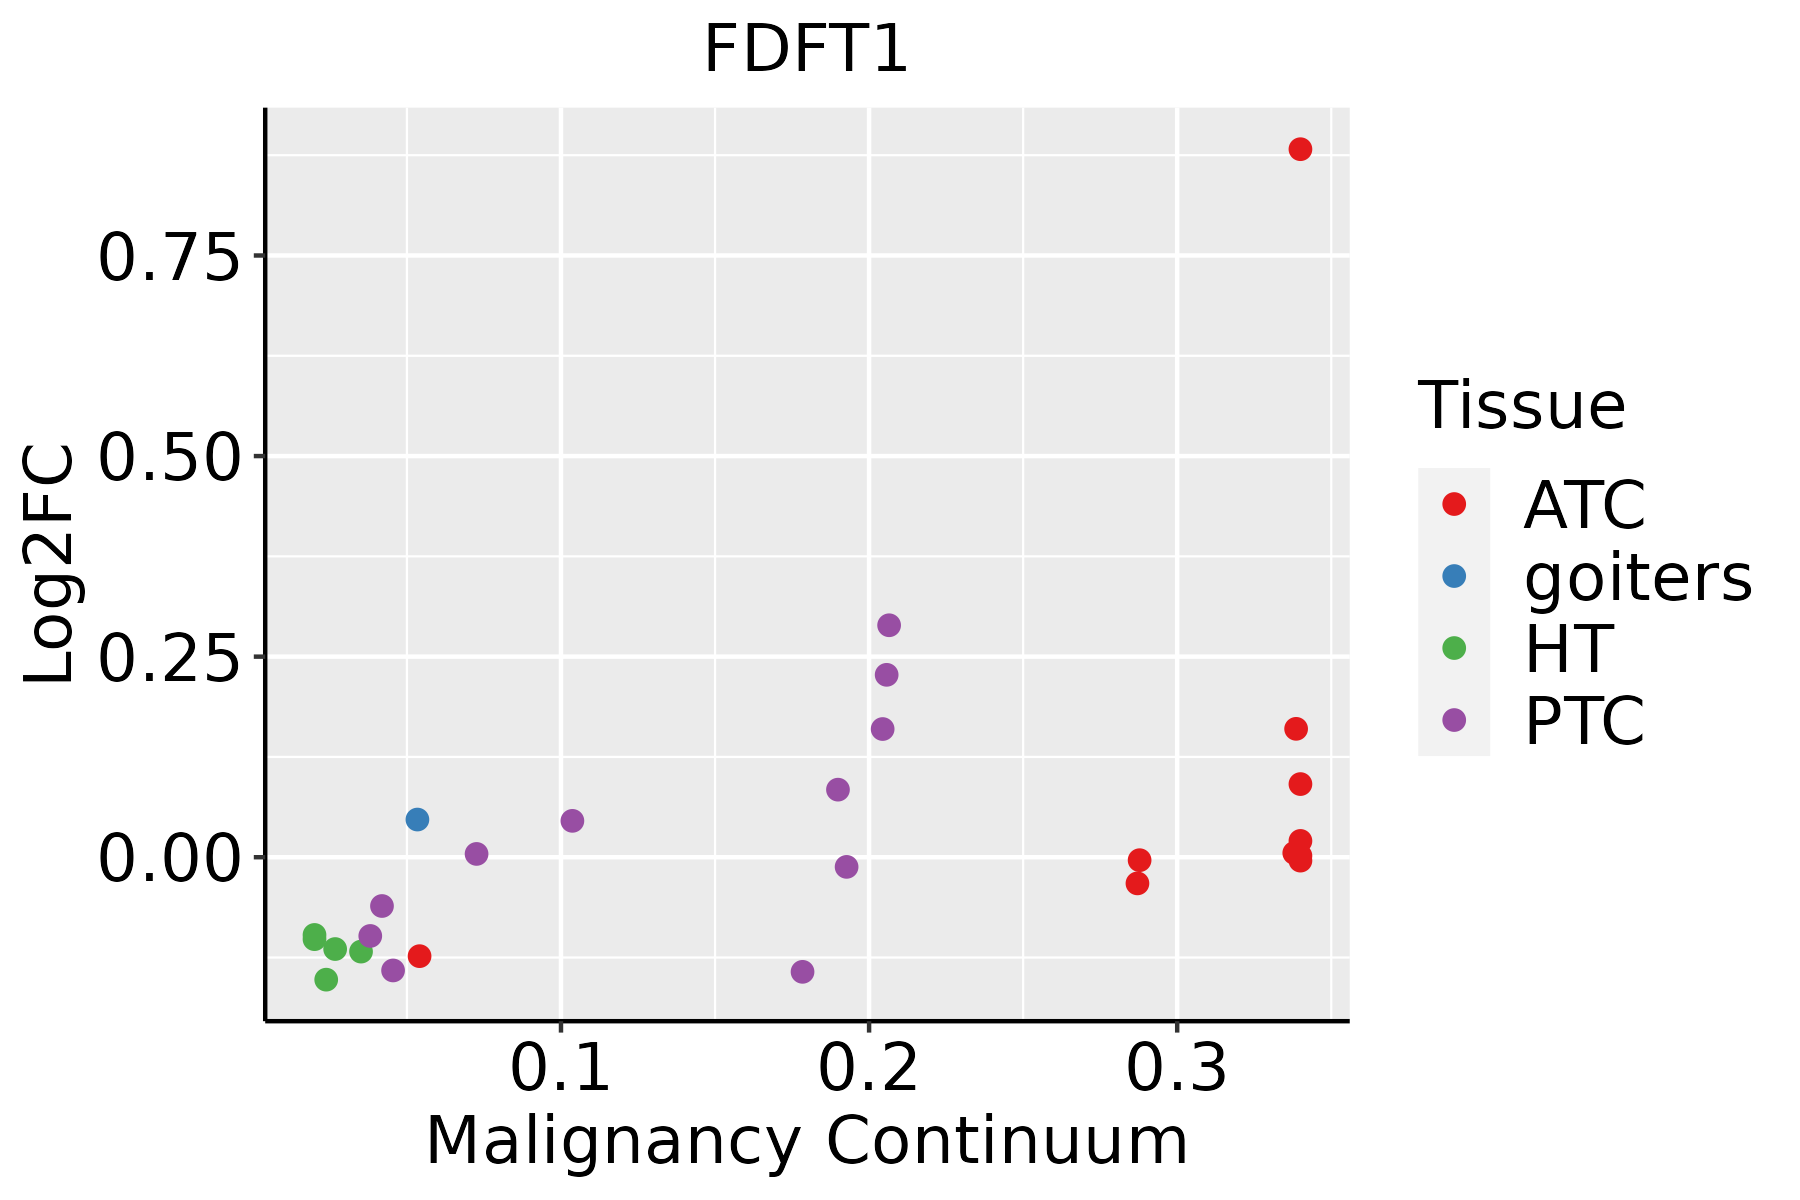 | ATC: Anaplastic thyroid cancer |
| HT: Hashimoto's thyroiditis | ||
| PTC: Papillary thyroid cancer |
| ∗log2FC in expression of this searched gene in stem-like cells from each diseased tissue sample relative to stem-like cells in normal samples in each tissue plotted against the malignancy continuum. Samples are colored based on if they are from different disease stage. |
Top |
Malignant transformation related pathway analysis |
| Find out the enriched GO biological processes and KEGG pathways involved in transition from healthy to precancer to cancer |
| Tissue | Disease Stage | Enriched GO biological Processes |
| Colorectum | AD |  |
| Colorectum | SER |  |
| Colorectum | MSS |  |
| Colorectum | MSI-H |  |
| Colorectum | FAP |  |
| ∗Top 15 enriched GO BP terms are showed in the bar plot of each disease state in each tissue. Each row represents a significant GO biological process which is colored according to the -log10(p.adjust). |
| Page: 1 2 3 4 5 6 7 8 9 |
| GO ID | Tissue | Disease Stage | Description | Gene Ratio | Bg Ratio | pvalue | p.adjust | Count |
| GO:0006066 | Colorectum | AD | alcohol metabolic process | 106/3918 | 353/18723 | 3.02e-05 | 5.57e-04 | 106 |
| GO:0006644 | Colorectum | AD | phospholipid metabolic process | 101/3918 | 383/18723 | 5.80e-03 | 3.67e-02 | 101 |
| GO:0008202 | Colorectum | AD | steroid metabolic process | 85/3918 | 319/18723 | 8.07e-03 | 4.75e-02 | 85 |
| GO:00060661 | Colorectum | SER | alcohol metabolic process | 79/2897 | 353/18723 | 3.50e-04 | 5.50e-03 | 79 |
| GO:00066441 | Colorectum | SER | phospholipid metabolic process | 79/2897 | 383/18723 | 3.94e-03 | 3.24e-02 | 79 |
| GO:00060662 | Colorectum | MSS | alcohol metabolic process | 92/3467 | 353/18723 | 2.57e-04 | 3.46e-03 | 92 |
| GO:00066442 | Colorectum | FAP | phospholipid metabolic process | 74/2622 | 383/18723 | 2.24e-03 | 1.83e-02 | 74 |
| GO:00060663 | Colorectum | FAP | alcohol metabolic process | 69/2622 | 353/18723 | 2.29e-03 | 1.85e-02 | 69 |
| GO:00066443 | Colorectum | CRC | phospholipid metabolic process | 65/2078 | 383/18723 | 3.21e-04 | 4.95e-03 | 65 |
| GO:00060664 | Colorectum | CRC | alcohol metabolic process | 57/2078 | 353/18723 | 2.37e-03 | 2.27e-02 | 57 |
| GO:00066446 | Esophagus | ESCC | phospholipid metabolic process | 218/8552 | 383/18723 | 5.37e-06 | 5.59e-05 | 218 |
| GO:00060668 | Esophagus | ESCC | alcohol metabolic process | 202/8552 | 353/18723 | 7.32e-06 | 7.26e-05 | 202 |
| GO:00161263 | Esophagus | ESCC | sterol biosynthetic process | 46/8552 | 64/18723 | 1.91e-05 | 1.67e-04 | 46 |
| GO:00066953 | Esophagus | ESCC | cholesterol biosynthetic process | 41/8552 | 57/18723 | 5.25e-05 | 4.06e-04 | 41 |
| GO:19026533 | Esophagus | ESCC | secondary alcohol biosynthetic process | 41/8552 | 57/18723 | 5.25e-05 | 4.06e-04 | 41 |
| GO:19026524 | Esophagus | ESCC | secondary alcohol metabolic process | 87/8552 | 147/18723 | 6.58e-04 | 3.50e-03 | 87 |
| GO:00461653 | Esophagus | ESCC | alcohol biosynthetic process | 83/8552 | 140/18723 | 8.04e-04 | 4.16e-03 | 83 |
| GO:00066946 | Esophagus | ESCC | steroid biosynthetic process | 98/8552 | 173/18723 | 2.34e-03 | 1.03e-02 | 98 |
| GO:00082034 | Esophagus | ESCC | cholesterol metabolic process | 79/8552 | 137/18723 | 3.11e-03 | 1.29e-02 | 79 |
| GO:00161254 | Esophagus | ESCC | sterol metabolic process | 86/8552 | 152/18723 | 4.37e-03 | 1.73e-02 | 86 |
| Page: 1 2 3 4 5 |
| Pathway ID | Tissue | Disease Stage | Description | Gene Ratio | Bg Ratio | pvalue | p.adjust | qvalue | Count |
| hsa001005 | Esophagus | ESCC | Steroid biosynthesis | 18/4205 | 20/8465 | 1.78e-04 | 6.79e-04 | 3.48e-04 | 18 |
| hsa0010012 | Esophagus | ESCC | Steroid biosynthesis | 18/4205 | 20/8465 | 1.78e-04 | 6.79e-04 | 3.48e-04 | 18 |
| hsa00100 | Liver | Cirrhotic | Steroid biosynthesis | 12/2530 | 20/8465 | 4.92e-03 | 1.76e-02 | 1.09e-02 | 12 |
| hsa001001 | Liver | Cirrhotic | Steroid biosynthesis | 12/2530 | 20/8465 | 4.92e-03 | 1.76e-02 | 1.09e-02 | 12 |
| hsa001002 | Liver | HCC | Steroid biosynthesis | 15/4020 | 20/8465 | 1.17e-02 | 2.97e-02 | 1.65e-02 | 15 |
| hsa001003 | Liver | HCC | Steroid biosynthesis | 15/4020 | 20/8465 | 1.17e-02 | 2.97e-02 | 1.65e-02 | 15 |
| hsa001004 | Oral cavity | OSCC | Steroid biosynthesis | 15/3704 | 20/8465 | 4.62e-03 | 1.13e-02 | 5.75e-03 | 15 |
| hsa0010011 | Oral cavity | OSCC | Steroid biosynthesis | 15/3704 | 20/8465 | 4.62e-03 | 1.13e-02 | 5.75e-03 | 15 |
| hsa0010021 | Oral cavity | LP | Steroid biosynthesis | 11/2418 | 20/8465 | 1.16e-02 | 3.91e-02 | 2.52e-02 | 11 |
| hsa0010031 | Oral cavity | LP | Steroid biosynthesis | 11/2418 | 20/8465 | 1.16e-02 | 3.91e-02 | 2.52e-02 | 11 |
| Page: 1 |
Top |
Cell-cell communication analysis |
| Identification of potential cell-cell interactions between two cell types and their ligand-receptor pairs for different disease states |
| Ligand | Receptor | LRpair | Pathway | Tissue | Disease Stage |
| Page: 1 |
Top |
Single-cell gene regulatory network inference analysis |
| Find out the significant the regulons (TFs) and the target genes of each regulon across cell types for different disease states |
| TF | Cell Type | Tissue | Disease Stage | Target Gene | RSS | Regulon Activity |
| ∗The dot plots of a searched regulon are shown for all cell subpopulations in each disease state of each tissue based on the regulon specific score inferred using pySCENIC and by calculating the average expression. |
| Page: 1 |
Top |
Somatic mutation of malignant transformation related genes |
| Annotation of somatic variants for genes involved in malignant transformation |
| Hugo Symbol | Variant Class | Variant Classification | dbSNP RS | HGVSc | HGVSp | HGVSp Short | SWISSPROT | BIOTYPE | SIFT | PolyPhen | Tumor Sample Barcode | Tissue | Histology | Sex | Age | Stage | Therapy Types | Drugs | Outcome |
| FDFT1 | SNV | Missense_Mutation | rs766941596 | c.203C>T | p.Ala68Val | p.A68V | P37268 | protein_coding | tolerated(0.06) | possibly_damaging(0.879) | TCGA-AC-A5XS-01 | Breast | breast invasive carcinoma | Female | >=65 | I/II | Hormone Therapy | femara | SD |
| FDFT1 | SNV | Missense_Mutation | rs556051417 | c.380N>T | p.Thr127Met | p.T127M | P37268 | protein_coding | tolerated(0.21) | probably_damaging(0.99) | TCGA-PL-A8LZ-01 | Breast | breast invasive carcinoma | Female | <65 | III/IV | Chemotherapy | paclitaxel | SD |
| FDFT1 | deletion | Frame_Shift_Del | c.418_421delNNNN | p.Thr141Ter | p.T141* | P37268 | protein_coding | TCGA-A8-A09Z-01 | Breast | breast invasive carcinoma | Female | >=65 | I/II | Unknown | Unknown | SD | |||
| FDFT1 | insertion | Frame_Shift_Ins | novel | c.1125_1126insAGGGAGGA | p.Leu376ArgfsTer4 | p.L376Rfs*4 | P37268 | protein_coding | TCGA-A8-A0AD-01 | Breast | breast invasive carcinoma | Female | >=65 | I/II | Hormone Therapy | tamoxiphen | SD | ||
| FDFT1 | insertion | Frame_Shift_Ins | novel | c.1126_1127insTCCAGGG | p.Ile377GlnfsTer78 | p.I377Qfs*78 | P37268 | protein_coding | TCGA-A8-A0AD-01 | Breast | breast invasive carcinoma | Female | >=65 | I/II | Hormone Therapy | tamoxiphen | SD | ||
| FDFT1 | insertion | Frame_Shift_Ins | novel | c.361_362insCTTTTCTATT | p.Val121AlafsTer14 | p.V121Afs*14 | P37268 | protein_coding | TCGA-BH-A0B8-01 | Breast | breast invasive carcinoma | Female | <65 | I/II | Hormone Therapy | arimidex | SD | ||
| FDFT1 | SNV | Missense_Mutation | rs779354465 | c.1136G>A | p.Arg379Gln | p.R379Q | P37268 | protein_coding | tolerated(0.05) | benign(0.023) | TCGA-C5-A2LX-01 | Cervix | cervical & endocervical cancer | Female | <65 | I/II | Chemotherapy | cisplatin | SD |
| FDFT1 | SNV | Missense_Mutation | c.1043N>C | p.Arg348Thr | p.R348T | P37268 | protein_coding | deleterious(0.02) | benign(0.015) | TCGA-EK-A3GK-01 | Cervix | cervical & endocervical cancer | Female | <65 | I/II | Unknown | Unknown | SD | |
| FDFT1 | SNV | Missense_Mutation | rs139230476 | c.521N>G | p.Tyr174Cys | p.Y174C | P37268 | protein_coding | deleterious(0) | probably_damaging(1) | TCGA-AA-3848-01 | Colorectum | colon adenocarcinoma | Female | >=65 | III/IV | Unknown | Unknown | PD |
| FDFT1 | SNV | Missense_Mutation | rs755672538 | c.1103C>T | p.Thr368Met | p.T368M | P37268 | protein_coding | tolerated(0.14) | benign(0.001) | TCGA-AA-3966-01 | Colorectum | colon adenocarcinoma | Female | >=65 | I/II | Unknown | Unknown | SD |
| Page: 1 2 3 4 |
Top |
Related drugs of malignant transformation related genes |
| Identification of chemicals and drugs interact with genes involved in malignant transfromation |
| (DGIdb 4.0) |
| Entrez ID | Symbol | Category | Interaction Types | Drug Claim Name | Drug Name | PMIDs |
| 2222 | FDFT1 | DRUGGABLE GENOME, ENZYME | inhibitor | CHEMBL435224 | LAPAQUISTAT ACETATE | |
| 2222 | FDFT1 | DRUGGABLE GENOME, ENZYME | inhibitor | 135649794 | ||
| 2222 | FDFT1 | DRUGGABLE GENOME, ENZYME | inhibitor | 135649735 | ||
| 2222 | FDFT1 | DRUGGABLE GENOME, ENZYME | inhibitor | 135649656 | ||
| 2222 | FDFT1 | DRUGGABLE GENOME, ENZYME | inhibitor | 223365913 | ||
| 2222 | FDFT1 | DRUGGABLE GENOME, ENZYME | inhibitor | 135649715 | ||
| 2222 | FDFT1 | DRUGGABLE GENOME, ENZYME | inhibitor | 135649789 | ||
| 2222 | FDFT1 | DRUGGABLE GENOME, ENZYME | inhibitor | 135649665 | ||
| 2222 | FDFT1 | DRUGGABLE GENOME, ENZYME | inhibitor | 135649788 | ||
| 2222 | FDFT1 | DRUGGABLE GENOME, ENZYME | inhibitor | 135650240 |
| Page: 1 2 3 |

Copyright 2023-Present -The University of Texas Health Science Center at Houston |