
|
|||||
|
 | |
| |
| |
| |
| |
| |
|
Gene: FDCSP |
Gene summary for FDCSP |
| Gene information | Species | Human | Gene symbol | FDCSP | Gene ID | 260436 |
| Gene name | follicular dendritic cell secreted protein | |
| Gene Alias | C4orf7 | |
| Cytomap | 4q13.3 | |
| Gene Type | protein-coding | GO ID | GO:0005575 | UniProtAcc | Q540F3 |
Top |
Malignant transformation analysis |
| Identification of the aberrant gene expression in precancerous and cancerous lesions by comparing the gene expression of stem-like cells in diseased tissues with normal stem cells |
| Entrez ID | Symbol | Replicates | Species | Organ | Tissue | Adj P-value | Log2FC | Malignancy |
| 260436 | FDCSP | GSM4909282 | Human | Breast | IDC | 1.27e-43 | 1.12e+00 | -0.0288 |
| 260436 | FDCSP | GSM4909285 | Human | Breast | IDC | 3.51e-04 | -1.75e-01 | 0.21 |
| 260436 | FDCSP | GSM4909286 | Human | Breast | IDC | 7.43e-04 | -1.75e-01 | 0.1081 |
| 260436 | FDCSP | GSM4909290 | Human | Breast | IDC | 2.64e-02 | -1.75e-01 | 0.2096 |
| 260436 | FDCSP | GSM4909300 | Human | Breast | IDC | 7.71e-04 | 6.34e-01 | 0.0334 |
| 260436 | FDCSP | GSM4909301 | Human | Breast | IDC | 3.32e-03 | -1.75e-01 | 0.1577 |
| 260436 | FDCSP | GSM4909304 | Human | Breast | IDC | 1.57e-03 | -1.75e-01 | 0.1636 |
| 260436 | FDCSP | GSM4909308 | Human | Breast | IDC | 2.12e-03 | -1.75e-01 | 0.158 |
| 260436 | FDCSP | GSM4909311 | Human | Breast | IDC | 3.51e-04 | -1.75e-01 | 0.1534 |
| 260436 | FDCSP | GSM4909312 | Human | Breast | IDC | 3.51e-04 | -1.75e-01 | 0.1552 |
| 260436 | FDCSP | GSM4909315 | Human | Breast | IDC | 1.57e-03 | -1.75e-01 | 0.21 |
| 260436 | FDCSP | GSM4909319 | Human | Breast | IDC | 1.57e-03 | -1.75e-01 | 0.1563 |
| 260436 | FDCSP | GSM4909321 | Human | Breast | IDC | 1.57e-03 | -1.75e-01 | 0.1559 |
| 260436 | FDCSP | brca2 | Human | Breast | Precancer | 2.72e-18 | 4.41e-01 | -0.024 |
| 260436 | FDCSP | brca3 | Human | Breast | Precancer | 2.41e-36 | 6.25e-01 | -0.0263 |
| 260436 | FDCSP | brca10 | Human | Breast | Precancer | 3.27e-03 | -1.75e-01 | -0.0029 |
| 260436 | FDCSP | NCCBC5 | Human | Breast | DCIS | 1.56e-02 | -1.75e-01 | 0.2046 |
| 260436 | FDCSP | P1 | Human | Breast | IDC | 8.42e-03 | -1.75e-01 | 0.1527 |
| 260436 | FDCSP | LZE4T | Human | Esophagus | ESCC | 2.38e-04 | -6.18e-01 | 0.0811 |
| 260436 | FDCSP | LZE8T | Human | Esophagus | ESCC | 9.53e-04 | -6.18e-01 | 0.067 |
| Page: 1 2 3 4 5 |
| Tissue | Expression Dynamics | Abbreviation |
| Breast | 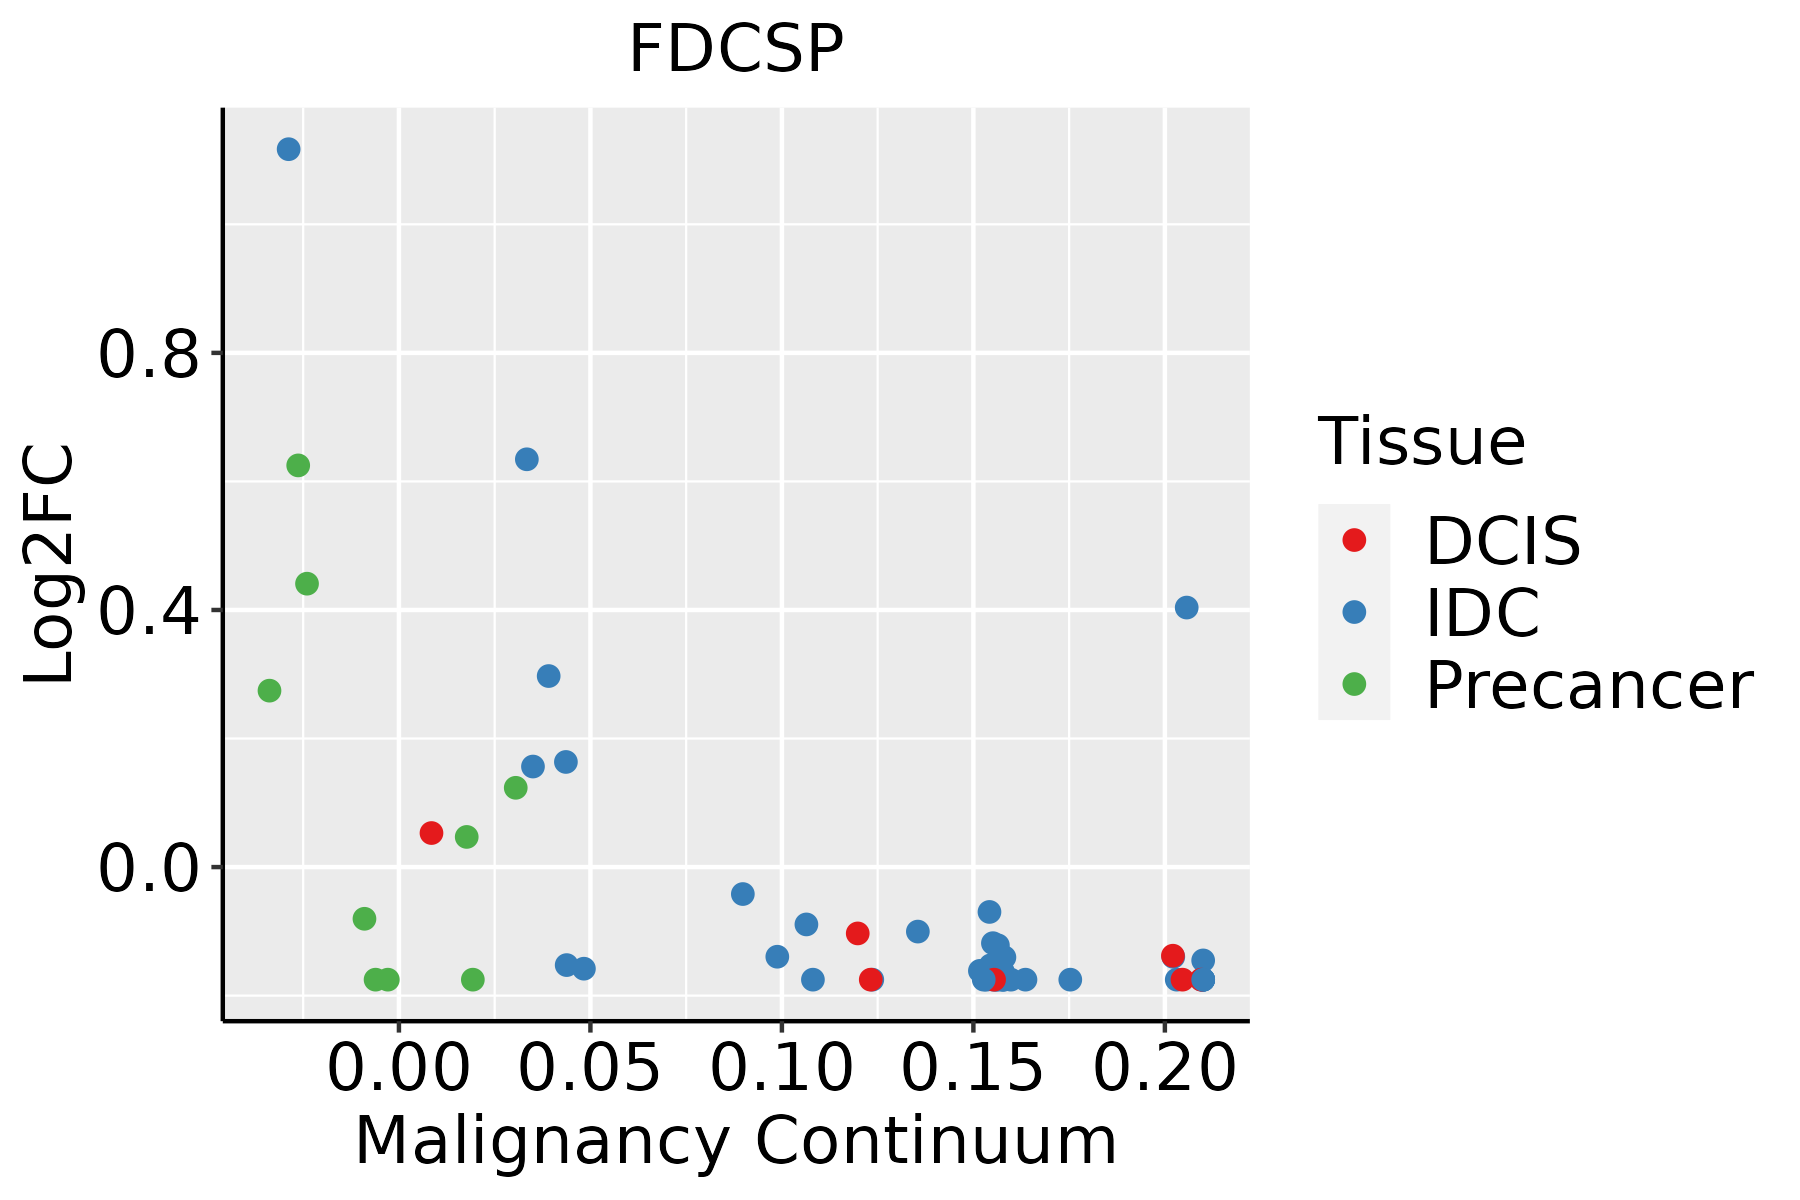 | IDC: Invasive ductal carcinoma |
| DCIS: Ductal carcinoma in situ | ||
| Precancer(BRCA1-mut): Precancerous lesion from BRCA1 mutation carriers | ||
| Esophagus |  | ESCC: Esophageal squamous cell carcinoma |
| HGIN: High-grade intraepithelial neoplasias | ||
| LGIN: Low-grade intraepithelial neoplasias | ||
| Oral Cavity |  | EOLP: Erosive Oral lichen planus |
| LP: leukoplakia | ||
| NEOLP: Non-erosive oral lichen planus | ||
| OSCC: Oral squamous cell carcinoma |
| ∗log2FC in expression of this searched gene in stem-like cells from each diseased tissue sample relative to stem-like cells in normal samples in each tissue plotted against the malignancy continuum. Samples are colored based on if they are from different disease stage. |
Top |
Malignant transformation related pathway analysis |
| Find out the enriched GO biological processes and KEGG pathways involved in transition from healthy to precancer to cancer |
| Tissue | Disease Stage | Enriched GO biological Processes |
| Colorectum | AD |  |
| Colorectum | SER |  |
| Colorectum | MSS |  |
| Colorectum | MSI-H |  |
| Colorectum | FAP |  |
| ∗Top 15 enriched GO BP terms are showed in the bar plot of each disease state in each tissue. Each row represents a significant GO biological process which is colored according to the -log10(p.adjust). |
| Page: 1 2 3 4 5 6 7 8 9 |
| GO ID | Tissue | Disease Stage | Description | Gene Ratio | Bg Ratio | pvalue | p.adjust | Count |
| Page: 1 |
| Pathway ID | Tissue | Disease Stage | Description | Gene Ratio | Bg Ratio | pvalue | p.adjust | qvalue | Count |
| Page: 1 |
Top |
Cell-cell communication analysis |
| Identification of potential cell-cell interactions between two cell types and their ligand-receptor pairs for different disease states |
| Ligand | Receptor | LRpair | Pathway | Tissue | Disease Stage |
| Page: 1 |
Top |
Single-cell gene regulatory network inference analysis |
| Find out the significant the regulons (TFs) and the target genes of each regulon across cell types for different disease states |
| TF | Cell Type | Tissue | Disease Stage | Target Gene | RSS | Regulon Activity |
| ∗The dot plots of a searched regulon are shown for all cell subpopulations in each disease state of each tissue based on the regulon specific score inferred using pySCENIC and by calculating the average expression. |
| Page: 1 |
Top |
Somatic mutation of malignant transformation related genes |
| Annotation of somatic variants for genes involved in malignant transformation |
| Hugo Symbol | Variant Class | Variant Classification | dbSNP RS | HGVSc | HGVSp | HGVSp Short | SWISSPROT | BIOTYPE | SIFT | PolyPhen | Tumor Sample Barcode | Tissue | Histology | Sex | Age | Stage | Therapy Types | Drugs | Outcome |
| FDCSP | SNV | Missense_Mutation | c.86G>A | p.Arg29Lys | p.R29K | Q8NFU4 | protein_coding | deleterious_low_confidence(0) | possibly_damaging(0.747) | TCGA-AN-A046-01 | Breast | breast invasive carcinoma | Female | >=65 | I/II | Unknown | Unknown | SD | |
| FDCSP | SNV | Missense_Mutation | c.86G>C | p.Arg29Thr | p.R29T | Q8NFU4 | protein_coding | deleterious_low_confidence(0) | probably_damaging(0.948) | TCGA-D8-A27G-01 | Breast | breast invasive carcinoma | Female | >=65 | I/II | Unknown | Unknown | SD | |
| FDCSP | SNV | Missense_Mutation | rs768557922 | c.151N>T | p.Arg51Cys | p.R51C | Q8NFU4 | protein_coding | tolerated_low_confidence(0.11) | possibly_damaging(0.458) | TCGA-AA-3984-01 | Colorectum | colon adenocarcinoma | Female | <65 | I/II | Unknown | Unknown | SD |
| FDCSP | SNV | Missense_Mutation | novel | c.209T>G | p.Ile70Ser | p.I70S | Q8NFU4 | protein_coding | deleterious_low_confidence(0.03) | benign(0.395) | TCGA-AZ-6599-01 | Colorectum | colon adenocarcinoma | Male | >=65 | I/II | Unknown | Unknown | SD |
| FDCSP | insertion | In_Frame_Ins | novel | c.207_208insTCTTGTTTACTTTTCGCTAGGAAGGGG | p.Pro69_Ile70insSerCysLeuLeuPheAlaArgLysGly | p.P69_I70insSCLLFARKG | Q8NFU4 | protein_coding | TCGA-AZ-6599-01 | Colorectum | colon adenocarcinoma | Male | >=65 | I/II | Unknown | Unknown | SD | ||
| FDCSP | SNV | Missense_Mutation | c.100N>C | p.Ser34Arg | p.S34R | Q8NFU4 | protein_coding | deleterious_low_confidence(0) | probably_damaging(0.981) | TCGA-B5-A0JY-01 | Endometrium | uterine corpus endometrioid carcinoma | Female | <65 | III/IV | Chemotherapy | doxorubicin | SD | |
| FDCSP | SNV | Missense_Mutation | c.179G>T | p.Arg60Ile | p.R60I | Q8NFU4 | protein_coding | tolerated_low_confidence(0.07) | possibly_damaging(0.605) | TCGA-B5-A11E-01 | Endometrium | uterine corpus endometrioid carcinoma | Female | <65 | I/II | Unknown | Unknown | SD | |
| FDCSP | SNV | Missense_Mutation | novel | c.220N>A | p.Glu74Lys | p.E74K | Q8NFU4 | protein_coding | tolerated_low_confidence(0.35) | benign(0.114) | TCGA-DF-A2KU-01 | Endometrium | uterine corpus endometrioid carcinoma | Female | Unknown | I/II | Unknown | Unknown | SD |
| FDCSP | SNV | Missense_Mutation | rs768557922 | c.151C>T | p.Arg51Cys | p.R51C | Q8NFU4 | protein_coding | tolerated_low_confidence(0.11) | possibly_damaging(0.458) | TCGA-E6-A1LX-01 | Endometrium | uterine corpus endometrioid carcinoma | Female | <65 | I/II | Unknown | Unknown | SD |
| FDCSP | SNV | Missense_Mutation | rs752862647 | c.170N>T | p.Pro57Leu | p.P57L | Q8NFU4 | protein_coding | tolerated_low_confidence(0.16) | benign(0) | TCGA-EO-A3AY-01 | Endometrium | uterine corpus endometrioid carcinoma | Female | <65 | I/II | Unknown | Unknown | PD |
| Page: 1 2 |
Top |
Related drugs of malignant transformation related genes |
| Identification of chemicals and drugs interact with genes involved in malignant transfromation |
| (DGIdb 4.0) |
| Entrez ID | Symbol | Category | Interaction Types | Drug Claim Name | Drug Name | PMIDs |
| Page: 1 |

Copyright 2023-Present -The University of Texas Health Science Center at Houston |