
|
|||||
|
 | |
| |
| |
| |
| |
| |
|
Gene: FCHSD2 |
Gene summary for FCHSD2 |
| Gene information | Species | Human | Gene symbol | FCHSD2 | Gene ID | 9873 |
| Gene name | FCH and double SH3 domains 2 | |
| Gene Alias | NWK | |
| Cytomap | 11q13.4 | |
| Gene Type | protein-coding | GO ID | GO:0006810 | UniProtAcc | O94868 |
Top |
Malignant transformation analysis |
| Identification of the aberrant gene expression in precancerous and cancerous lesions by comparing the gene expression of stem-like cells in diseased tissues with normal stem cells |
| Entrez ID | Symbol | Replicates | Species | Organ | Tissue | Adj P-value | Log2FC | Malignancy |
| 9873 | FCHSD2 | CA_HPV_1 | Human | Cervix | CC | 2.21e-12 | 5.04e-01 | 0.0264 |
| 9873 | FCHSD2 | CCI_1 | Human | Cervix | CC | 1.17e-02 | 5.58e-01 | 0.528 |
| 9873 | FCHSD2 | CCI_2 | Human | Cervix | CC | 1.30e-03 | 6.26e-01 | 0.5249 |
| 9873 | FCHSD2 | CCI_3 | Human | Cervix | CC | 3.92e-12 | 8.33e-01 | 0.516 |
| 9873 | FCHSD2 | AEH-subject1 | Human | Endometrium | AEH | 2.00e-18 | 4.65e-01 | -0.3059 |
| 9873 | FCHSD2 | AEH-subject4 | Human | Endometrium | AEH | 3.74e-11 | 4.95e-01 | -0.2657 |
| 9873 | FCHSD2 | AEH-subject5 | Human | Endometrium | AEH | 5.12e-10 | 4.09e-01 | -0.2953 |
| 9873 | FCHSD2 | EEC-subject1 | Human | Endometrium | EEC | 3.25e-09 | 3.81e-01 | -0.2682 |
| 9873 | FCHSD2 | EEC-subject2 | Human | Endometrium | EEC | 1.90e-10 | 4.12e-01 | -0.2607 |
| 9873 | FCHSD2 | EEC-subject4 | Human | Endometrium | EEC | 2.20e-05 | 3.23e-01 | -0.2571 |
| 9873 | FCHSD2 | EEC-subject5 | Human | Endometrium | EEC | 1.42e-08 | 3.42e-01 | -0.249 |
| 9873 | FCHSD2 | GSM6177622_NYU_UCEC3_lib2_lib2 | Human | Endometrium | EEC | 7.36e-03 | 1.25e-01 | -0.1916 |
| 9873 | FCHSD2 | LZE4T | Human | Esophagus | ESCC | 1.19e-03 | 8.49e-02 | 0.0811 |
| 9873 | FCHSD2 | LZE20T | Human | Esophagus | ESCC | 1.43e-02 | 1.40e-01 | 0.0662 |
| 9873 | FCHSD2 | LZE22T | Human | Esophagus | ESCC | 4.78e-02 | 2.44e-01 | 0.068 |
| 9873 | FCHSD2 | LZE24T | Human | Esophagus | ESCC | 2.87e-07 | 2.03e-01 | 0.0596 |
| 9873 | FCHSD2 | P2T-E | Human | Esophagus | ESCC | 2.62e-30 | 6.30e-01 | 0.1177 |
| 9873 | FCHSD2 | P4T-E | Human | Esophagus | ESCC | 1.81e-11 | 2.62e-01 | 0.1323 |
| 9873 | FCHSD2 | P5T-E | Human | Esophagus | ESCC | 2.07e-07 | 6.77e-02 | 0.1327 |
| 9873 | FCHSD2 | P8T-E | Human | Esophagus | ESCC | 1.10e-09 | 1.65e-01 | 0.0889 |
| Page: 1 2 3 4 5 6 |
| Tissue | Expression Dynamics | Abbreviation |
| Cervix | 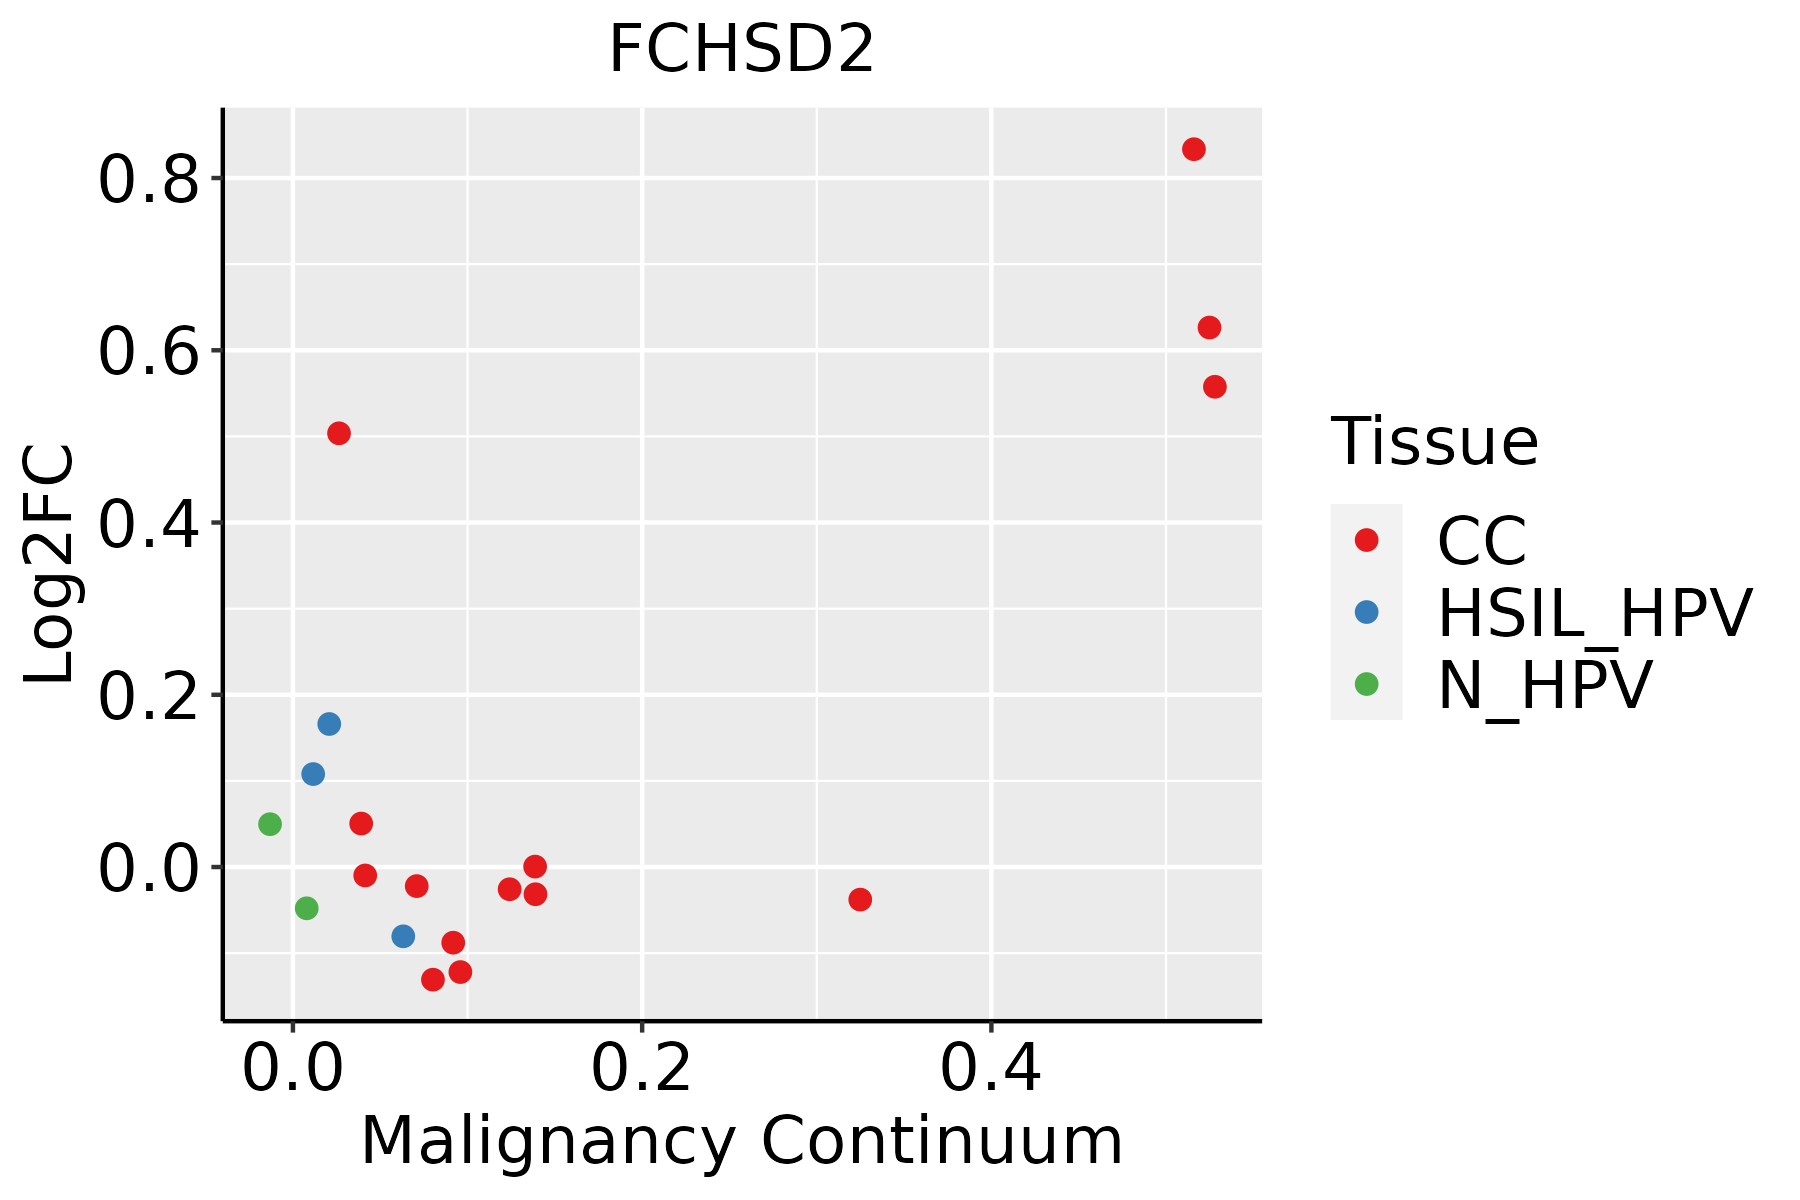 | CC: Cervix cancer |
| HSIL_HPV: HPV-infected high-grade squamous intraepithelial lesions | ||
| N_HPV: HPV-infected normal cervix | ||
| Endometrium | 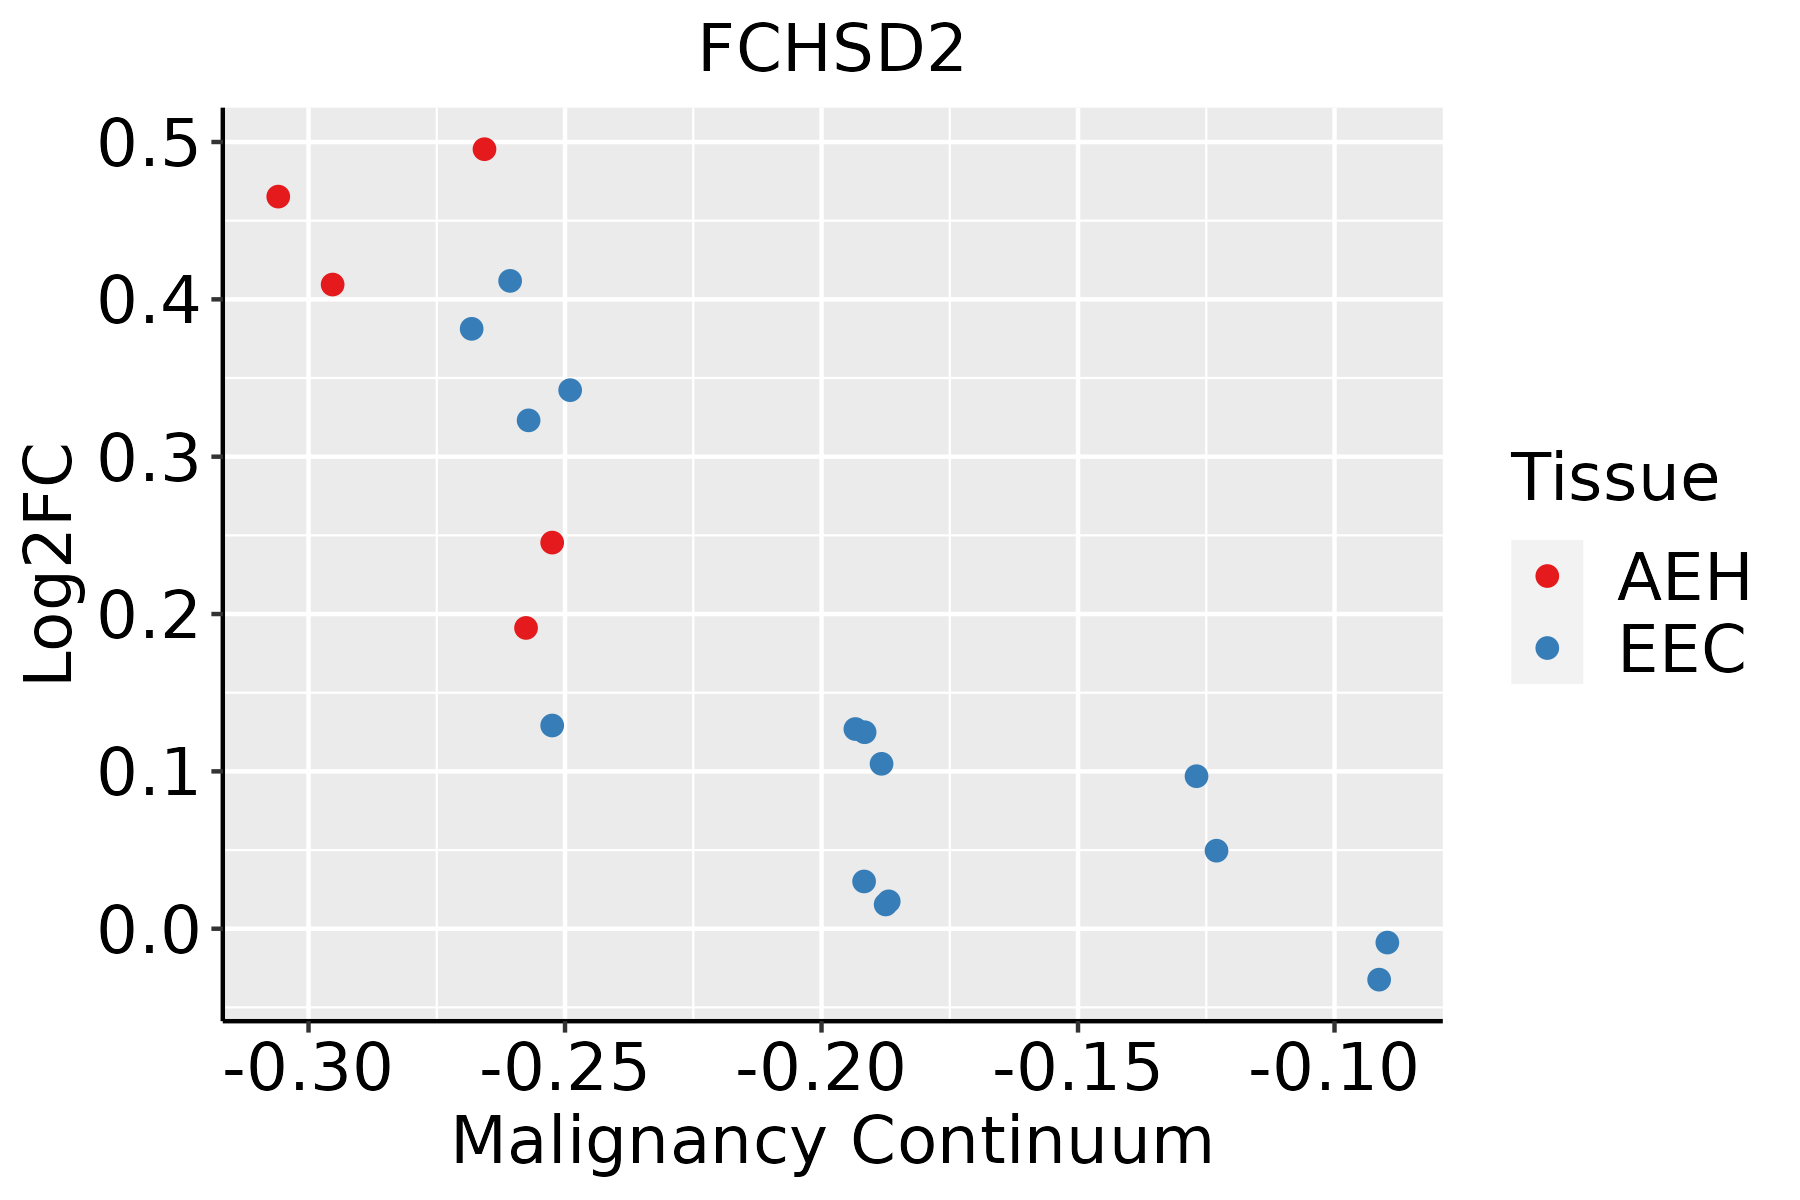 | AEH: Atypical endometrial hyperplasia |
| EEC: Endometrioid Cancer | ||
| Esophagus |  | ESCC: Esophageal squamous cell carcinoma |
| HGIN: High-grade intraepithelial neoplasias | ||
| LGIN: Low-grade intraepithelial neoplasias | ||
| Liver | 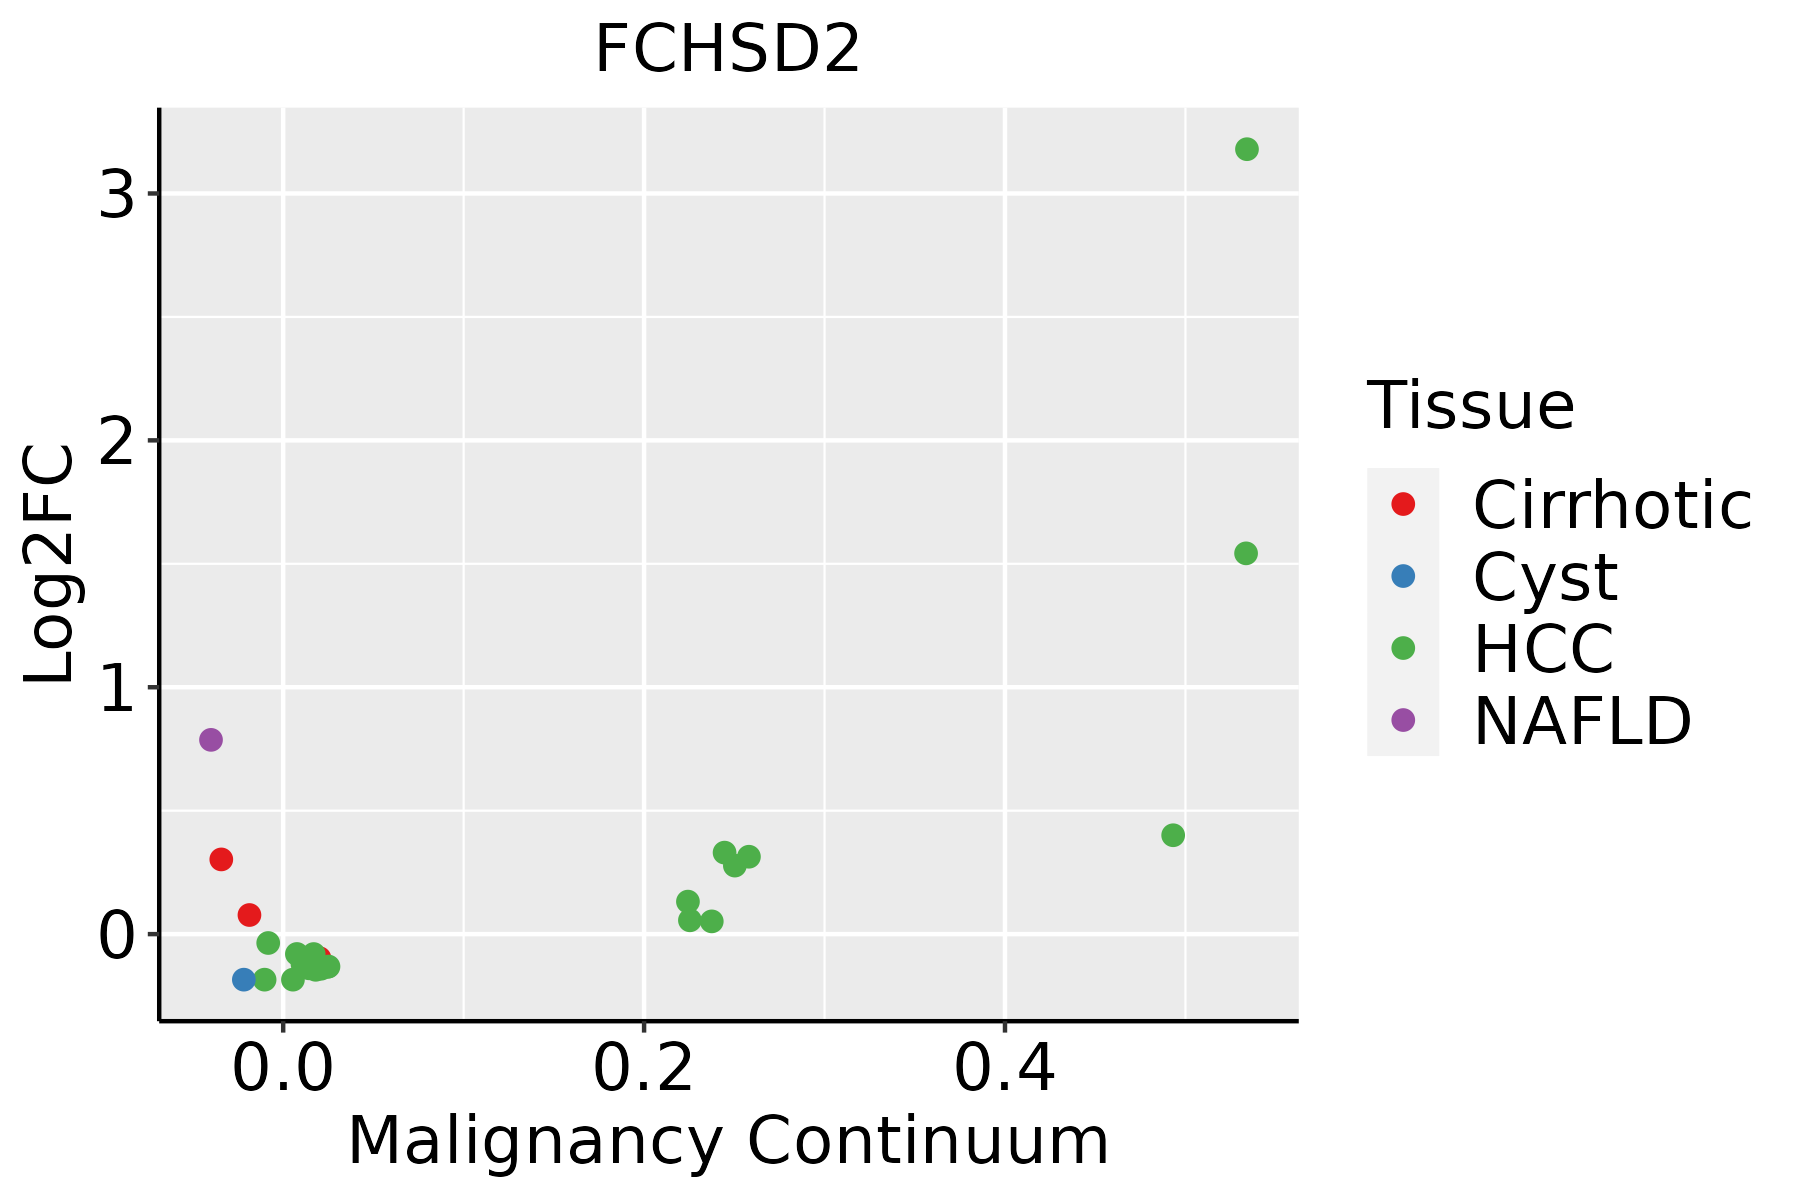 | HCC: Hepatocellular carcinoma |
| NAFLD: Non-alcoholic fatty liver disease | ||
| Lung | 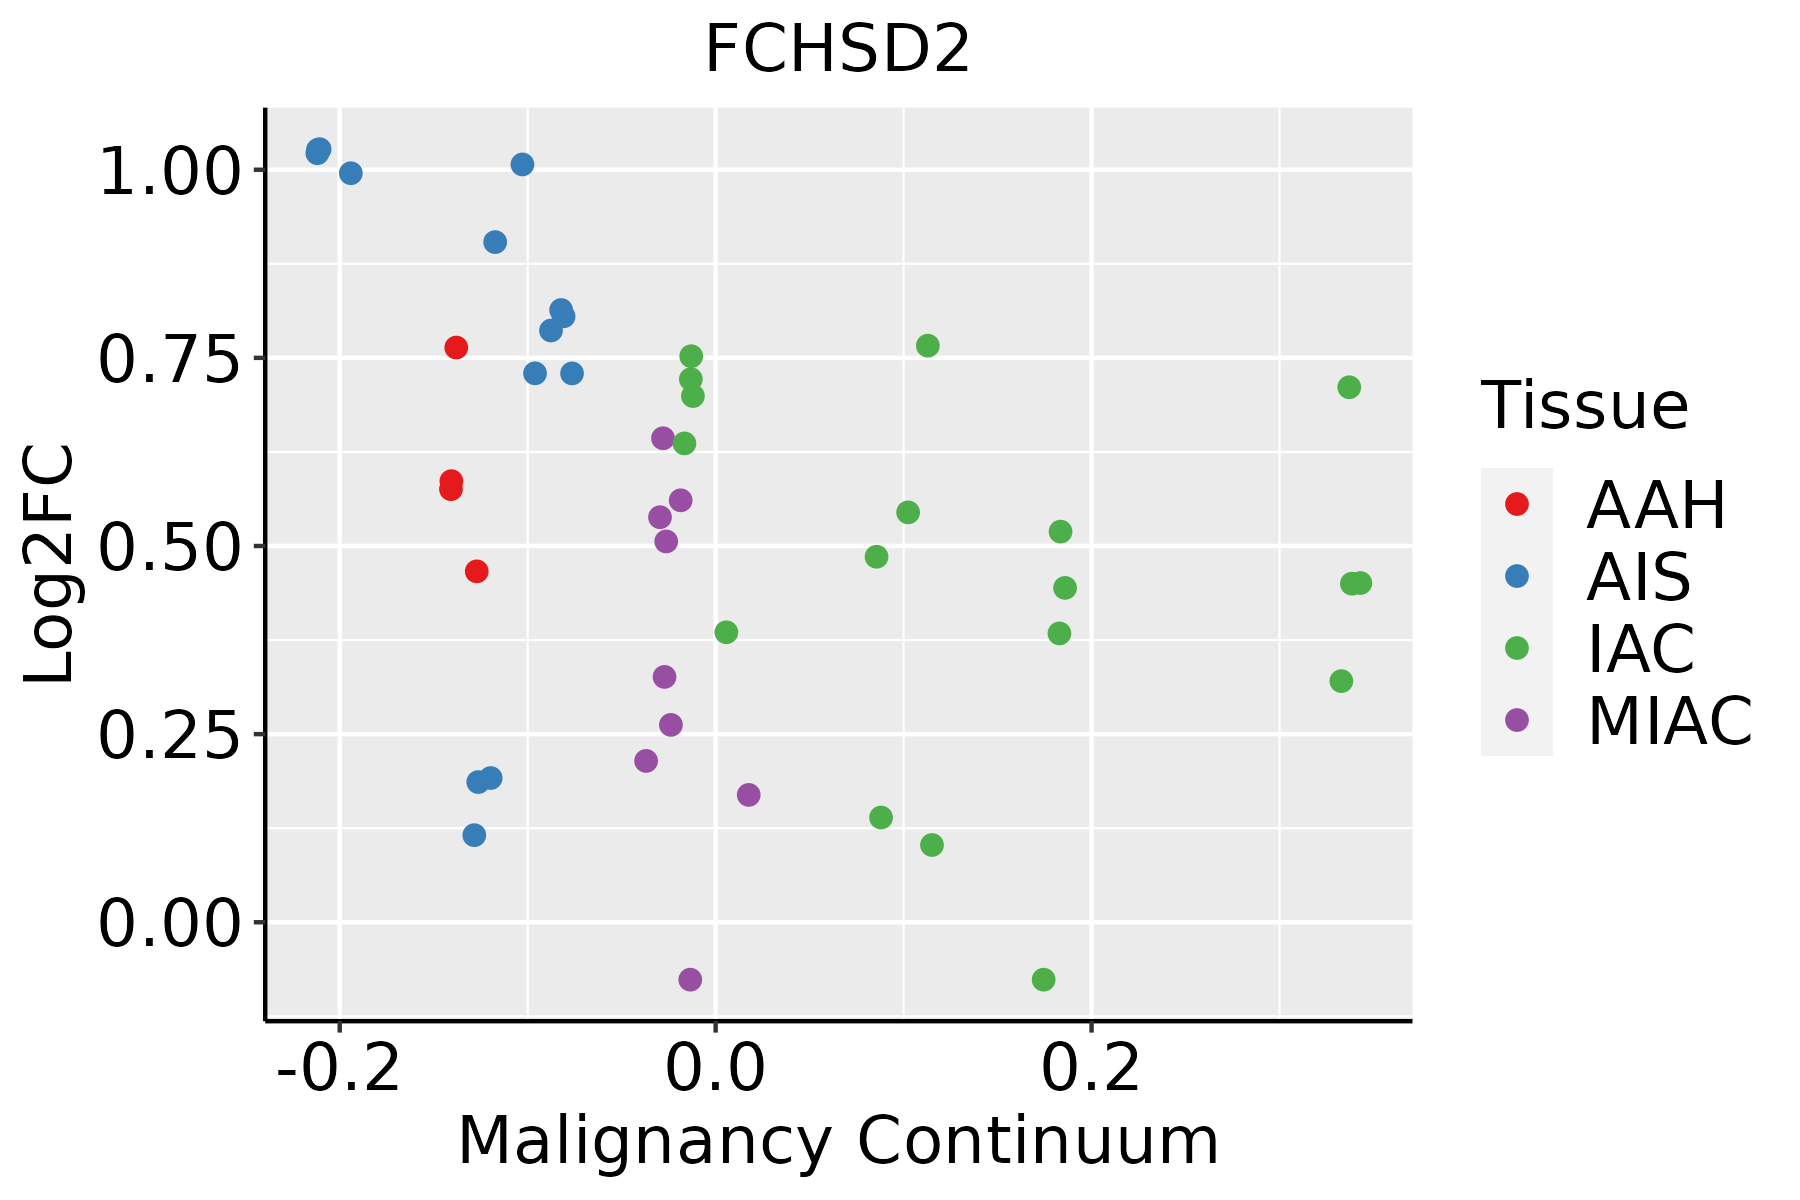 | AAH: Atypical adenomatous hyperplasia |
| AIS: Adenocarcinoma in situ | ||
| IAC: Invasive lung adenocarcinoma | ||
| MIA: Minimally invasive adenocarcinoma | ||
| Oral Cavity |  | EOLP: Erosive Oral lichen planus |
| LP: leukoplakia | ||
| NEOLP: Non-erosive oral lichen planus | ||
| OSCC: Oral squamous cell carcinoma | ||
| Prostate | 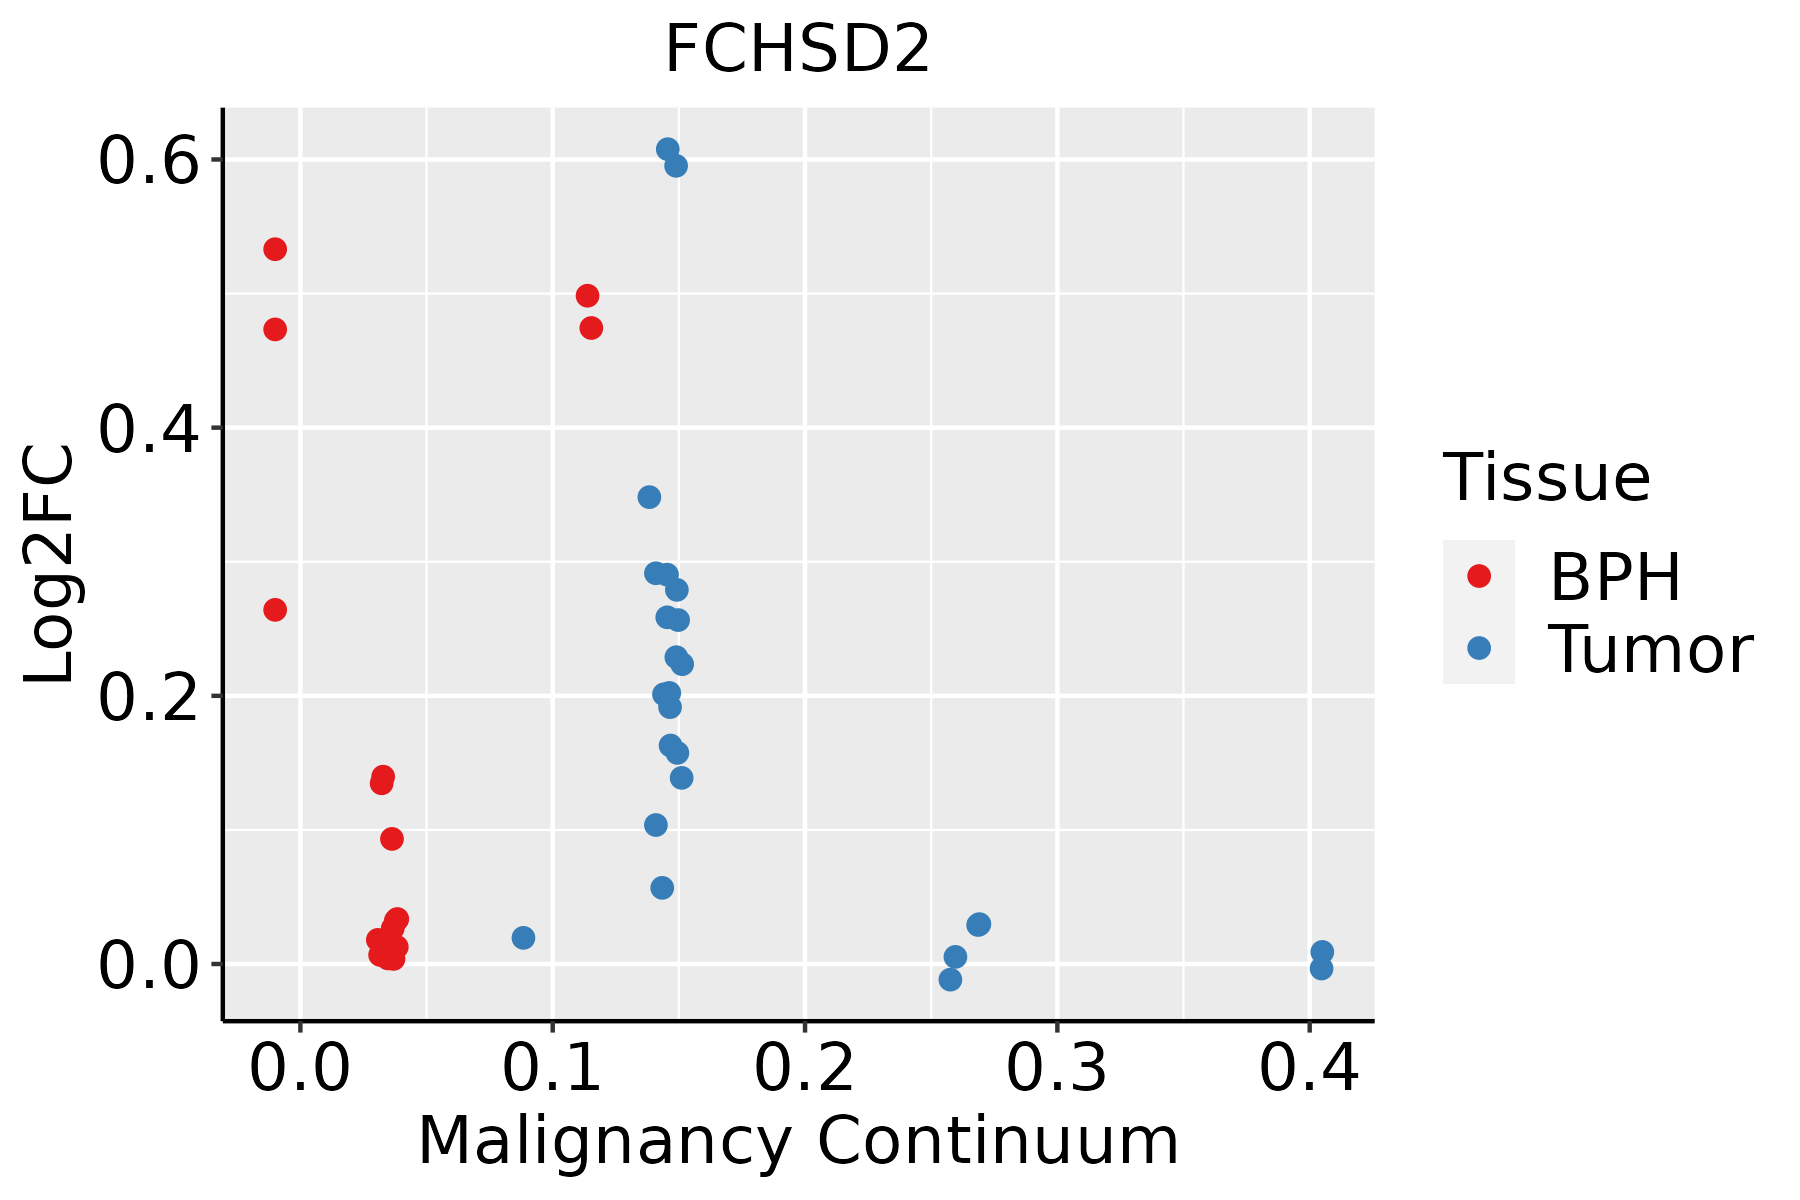 | BPH: Benign Prostatic Hyperplasia |
| ∗log2FC in expression of this searched gene in stem-like cells from each diseased tissue sample relative to stem-like cells in normal samples in each tissue plotted against the malignancy continuum. Samples are colored based on if they are from different disease stage. |
Top |
Malignant transformation related pathway analysis |
| Find out the enriched GO biological processes and KEGG pathways involved in transition from healthy to precancer to cancer |
| Tissue | Disease Stage | Enriched GO biological Processes |
| Colorectum | AD |  |
| Colorectum | SER |  |
| Colorectum | MSS |  |
| Colorectum | MSI-H |  |
| Colorectum | FAP |  |
| ∗Top 15 enriched GO BP terms are showed in the bar plot of each disease state in each tissue. Each row represents a significant GO biological process which is colored according to the -log10(p.adjust). |
| Page: 1 2 3 4 5 6 7 8 9 |
| GO ID | Tissue | Disease Stage | Description | Gene Ratio | Bg Ratio | pvalue | p.adjust | Count |
| GO:000701510 | Cervix | CC | actin filament organization | 109/2311 | 442/18723 | 4.92e-13 | 2.45e-10 | 109 |
| GO:003297010 | Cervix | CC | regulation of actin filament-based process | 96/2311 | 397/18723 | 4.00e-11 | 8.54e-09 | 96 |
| GO:190290310 | Cervix | CC | regulation of supramolecular fiber organization | 92/2311 | 383/18723 | 1.49e-10 | 2.48e-08 | 92 |
| GO:003295610 | Cervix | CC | regulation of actin cytoskeleton organization | 86/2311 | 358/18723 | 5.90e-10 | 7.51e-08 | 86 |
| GO:004325410 | Cervix | CC | regulation of protein-containing complex assembly | 96/2311 | 428/18723 | 2.91e-09 | 3.05e-07 | 96 |
| GO:011005310 | Cervix | CC | regulation of actin filament organization | 67/2311 | 278/18723 | 4.01e-08 | 2.54e-06 | 67 |
| GO:005125810 | Cervix | CC | protein polymerization | 70/2311 | 297/18723 | 5.20e-08 | 3.11e-06 | 70 |
| GO:003227110 | Cervix | CC | regulation of protein polymerization | 57/2311 | 233/18723 | 2.37e-07 | 1.03e-05 | 57 |
| GO:003133410 | Cervix | CC | positive regulation of protein-containing complex assembly | 55/2311 | 237/18723 | 2.25e-06 | 6.73e-05 | 55 |
| GO:190290510 | Cervix | CC | positive regulation of supramolecular fiber organization | 50/2311 | 209/18723 | 2.55e-06 | 7.54e-05 | 50 |
| GO:00081549 | Cervix | CC | actin polymerization or depolymerization | 51/2311 | 218/18723 | 4.05e-06 | 1.05e-04 | 51 |
| GO:00300419 | Cervix | CC | actin filament polymerization | 45/2311 | 191/18723 | 1.20e-05 | 2.54e-04 | 45 |
| GO:00325359 | Cervix | CC | regulation of cellular component size | 76/2311 | 383/18723 | 1.66e-05 | 3.21e-04 | 76 |
| GO:00068987 | Cervix | CC | receptor-mediated endocytosis | 53/2311 | 244/18723 | 2.52e-05 | 4.29e-04 | 53 |
| GO:005149510 | Cervix | CC | positive regulation of cytoskeleton organization | 50/2311 | 226/18723 | 2.53e-05 | 4.29e-04 | 50 |
| GO:00308339 | Cervix | CC | regulation of actin filament polymerization | 40/2311 | 172/18723 | 4.90e-05 | 7.40e-04 | 40 |
| GO:00080649 | Cervix | CC | regulation of actin polymerization or depolymerization | 42/2311 | 188/18723 | 8.60e-05 | 1.15e-03 | 42 |
| GO:00725836 | Cervix | CC | clathrin-dependent endocytosis | 16/2311 | 47/18723 | 9.56e-05 | 1.25e-03 | 16 |
| GO:00308328 | Cervix | CC | regulation of actin filament length | 42/2311 | 189/18723 | 9.76e-05 | 1.27e-03 | 42 |
| GO:003227310 | Cervix | CC | positive regulation of protein polymerization | 33/2311 | 138/18723 | 1.23e-04 | 1.53e-03 | 33 |
| Page: 1 2 3 4 5 6 7 8 9 10 11 12 13 14 15 16 |
| Pathway ID | Tissue | Disease Stage | Description | Gene Ratio | Bg Ratio | pvalue | p.adjust | qvalue | Count |
| Page: 1 |
Top |
Cell-cell communication analysis |
| Identification of potential cell-cell interactions between two cell types and their ligand-receptor pairs for different disease states |
| Ligand | Receptor | LRpair | Pathway | Tissue | Disease Stage |
| Page: 1 |
Top |
Single-cell gene regulatory network inference analysis |
| Find out the significant the regulons (TFs) and the target genes of each regulon across cell types for different disease states |
| TF | Cell Type | Tissue | Disease Stage | Target Gene | RSS | Regulon Activity |
| ∗The dot plots of a searched regulon are shown for all cell subpopulations in each disease state of each tissue based on the regulon specific score inferred using pySCENIC and by calculating the average expression. |
| Page: 1 |
Top |
Somatic mutation of malignant transformation related genes |
| Annotation of somatic variants for genes involved in malignant transformation |
| Hugo Symbol | Variant Class | Variant Classification | dbSNP RS | HGVSc | HGVSp | HGVSp Short | SWISSPROT | BIOTYPE | SIFT | PolyPhen | Tumor Sample Barcode | Tissue | Histology | Sex | Age | Stage | Therapy Types | Drugs | Outcome |
| FCHSD2 | SNV | Missense_Mutation | novel | c.559N>A | p.Gln187Lys | p.Q187K | O94868 | protein_coding | tolerated(0.06) | benign(0.039) | TCGA-A2-A04Y-01 | Breast | breast invasive carcinoma | Female | <65 | I/II | Chemotherapy | cytoxan | SD |
| FCHSD2 | SNV | Missense_Mutation | c.653N>G | p.Ala218Gly | p.A218G | O94868 | protein_coding | deleterious(0) | possibly_damaging(0.787) | TCGA-A8-A09A-01 | Breast | breast invasive carcinoma | Female | <65 | I/II | Hormone Therapy | tamoxiphen | SD | |
| FCHSD2 | deletion | Frame_Shift_Del | c.1568delN | p.Lys523SerfsTer12 | p.K523Sfs*12 | O94868 | protein_coding | TCGA-AO-A128-01 | Breast | breast invasive carcinoma | Female | <65 | I/II | Chemotherapy | doxorubicin | SD | |||
| FCHSD2 | deletion | Frame_Shift_Del | c.1091delN | p.Arg364GlnfsTer4 | p.R364Qfs*4 | O94868 | protein_coding | TCGA-D8-A27V-01 | Breast | breast invasive carcinoma | Female | <65 | I/II | Hormone Therapy | tamoxiphen | SD | |||
| FCHSD2 | SNV | Missense_Mutation | novel | c.1807N>A | p.Asp603Asn | p.D603N | O94868 | protein_coding | tolerated(0.16) | benign(0.412) | TCGA-C5-A2LZ-01 | Cervix | cervical & endocervical cancer | Female | >=65 | III/IV | Unknown | Unknown | PD |
| FCHSD2 | SNV | Missense_Mutation | c.2068N>T | p.His690Tyr | p.H690Y | O94868 | protein_coding | tolerated(0.12) | benign(0.027) | TCGA-EK-A2R8-01 | Cervix | cervical & endocervical cancer | Female | <65 | I/II | Unknown | Unknown | SD | |
| FCHSD2 | SNV | Missense_Mutation | c.2101N>G | p.Arg701Gly | p.R701G | O94868 | protein_coding | deleterious(0.03) | benign(0.015) | TCGA-A6-3809-01 | Colorectum | colon adenocarcinoma | Female | >=65 | I/II | Unknown | Unknown | SD | |
| FCHSD2 | SNV | Missense_Mutation | c.1351N>A | p.Asp451Asn | p.D451N | O94868 | protein_coding | deleterious(0.02) | possibly_damaging(0.494) | TCGA-AA-3972-01 | Colorectum | colon adenocarcinoma | Male | >=65 | III/IV | Chemotherapy | capecitabine | PD | |
| FCHSD2 | SNV | Missense_Mutation | c.509N>G | p.Asp170Gly | p.D170G | O94868 | protein_coding | deleterious(0) | possibly_damaging(0.629) | TCGA-AA-A010-01 | Colorectum | colon adenocarcinoma | Female | <65 | I/II | Chemotherapy | folinic | CR | |
| FCHSD2 | SNV | Missense_Mutation | c.908N>T | p.Pro303Leu | p.P303L | O94868 | protein_coding | tolerated(0.19) | probably_damaging(0.997) | TCGA-F4-6856-01 | Colorectum | colon adenocarcinoma | Male | <65 | I/II | Ancillary | leucovorin | CR |
| Page: 1 2 3 4 5 6 |
Top |
Related drugs of malignant transformation related genes |
| Identification of chemicals and drugs interact with genes involved in malignant transfromation |
| (DGIdb 4.0) |
| Entrez ID | Symbol | Category | Interaction Types | Drug Claim Name | Drug Name | PMIDs |
| Page: 1 |

Copyright 2023-Present -The University of Texas Health Science Center at Houston |