
|
|||||
|
 | |
| |
| |
| |
| |
| |
|
Gene: FCGRT |
Gene summary for FCGRT |
| Gene information | Species | Human | Gene symbol | FCGRT | Gene ID | 2217 |
| Gene name | Fc fragment of IgG receptor and transporter | |
| Gene Alias | FCRN | |
| Cytomap | 19q13.33 | |
| Gene Type | protein-coding | GO ID | GO:0002376 | UniProtAcc | A0A024QZI2 |
Top |
Malignant transformation analysis |
| Identification of the aberrant gene expression in precancerous and cancerous lesions by comparing the gene expression of stem-like cells in diseased tissues with normal stem cells |
| Entrez ID | Symbol | Replicates | Species | Organ | Tissue | Adj P-value | Log2FC | Malignancy |
| 2217 | FCGRT | GSM4909282 | Human | Breast | IDC | 6.04e-03 | -2.15e-01 | -0.0288 |
| 2217 | FCGRT | GSM4909286 | Human | Breast | IDC | 2.23e-08 | 2.44e-01 | 0.1081 |
| 2217 | FCGRT | GSM4909290 | Human | Breast | IDC | 2.47e-06 | -3.02e-01 | 0.2096 |
| 2217 | FCGRT | GSM4909291 | Human | Breast | IDC | 3.93e-14 | 6.61e-01 | 0.1753 |
| 2217 | FCGRT | GSM4909292 | Human | Breast | IDC | 3.45e-02 | -4.07e-01 | 0.1236 |
| 2217 | FCGRT | GSM4909294 | Human | Breast | IDC | 2.20e-14 | -3.34e-01 | 0.2022 |
| 2217 | FCGRT | GSM4909296 | Human | Breast | IDC | 8.23e-12 | -3.37e-01 | 0.1524 |
| 2217 | FCGRT | GSM4909297 | Human | Breast | IDC | 5.64e-07 | -6.26e-03 | 0.1517 |
| 2217 | FCGRT | GSM4909298 | Human | Breast | IDC | 1.54e-03 | 2.70e-01 | 0.1551 |
| 2217 | FCGRT | GSM4909302 | Human | Breast | IDC | 2.40e-04 | -1.79e-01 | 0.1545 |
| 2217 | FCGRT | GSM4909308 | Human | Breast | IDC | 9.32e-04 | 3.39e-01 | 0.158 |
| 2217 | FCGRT | GSM4909311 | Human | Breast | IDC | 9.88e-20 | -5.64e-02 | 0.1534 |
| 2217 | FCGRT | GSM4909312 | Human | Breast | IDC | 1.57e-04 | 9.45e-02 | 0.1552 |
| 2217 | FCGRT | GSM4909313 | Human | Breast | IDC | 9.23e-03 | 2.79e-01 | 0.0391 |
| 2217 | FCGRT | GSM4909315 | Human | Breast | IDC | 6.82e-22 | -4.03e-01 | 0.21 |
| 2217 | FCGRT | GSM4909316 | Human | Breast | IDC | 8.46e-08 | -4.07e-01 | 0.21 |
| 2217 | FCGRT | GSM4909317 | Human | Breast | IDC | 4.03e-08 | 5.14e-01 | 0.1355 |
| 2217 | FCGRT | GSM4909318 | Human | Breast | IDC | 2.81e-04 | 5.26e-01 | 0.2031 |
| 2217 | FCGRT | GSM4909319 | Human | Breast | IDC | 2.20e-28 | -4.96e-02 | 0.1563 |
| 2217 | FCGRT | GSM4909321 | Human | Breast | IDC | 2.53e-09 | 1.59e-01 | 0.1559 |
| Page: 1 2 3 4 5 6 7 8 9 10 11 12 13 14 |
| Tissue | Expression Dynamics | Abbreviation |
| Breast |  | IDC: Invasive ductal carcinoma |
| DCIS: Ductal carcinoma in situ | ||
| Precancer(BRCA1-mut): Precancerous lesion from BRCA1 mutation carriers | ||
| Cervix | 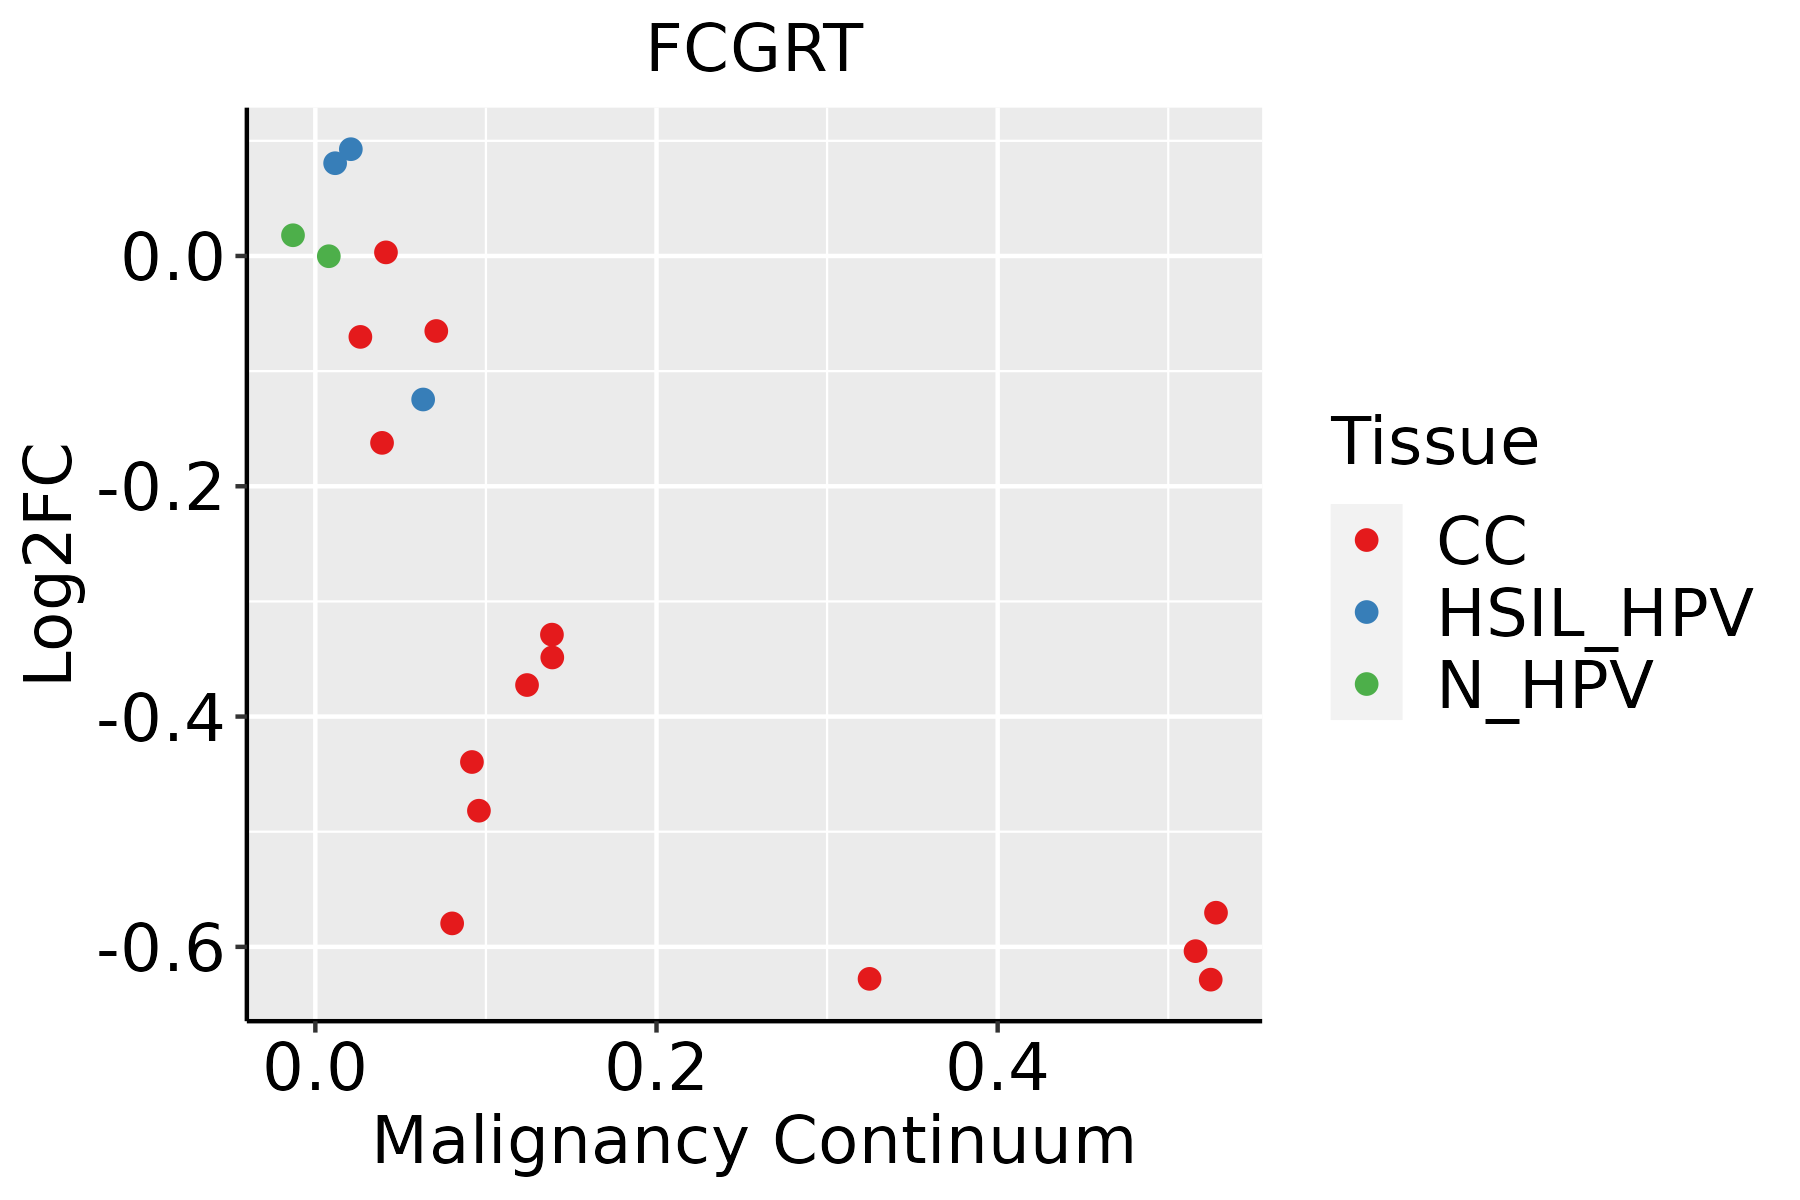 | CC: Cervix cancer |
| HSIL_HPV: HPV-infected high-grade squamous intraepithelial lesions | ||
| N_HPV: HPV-infected normal cervix | ||
| Colorectum (GSE201348) | 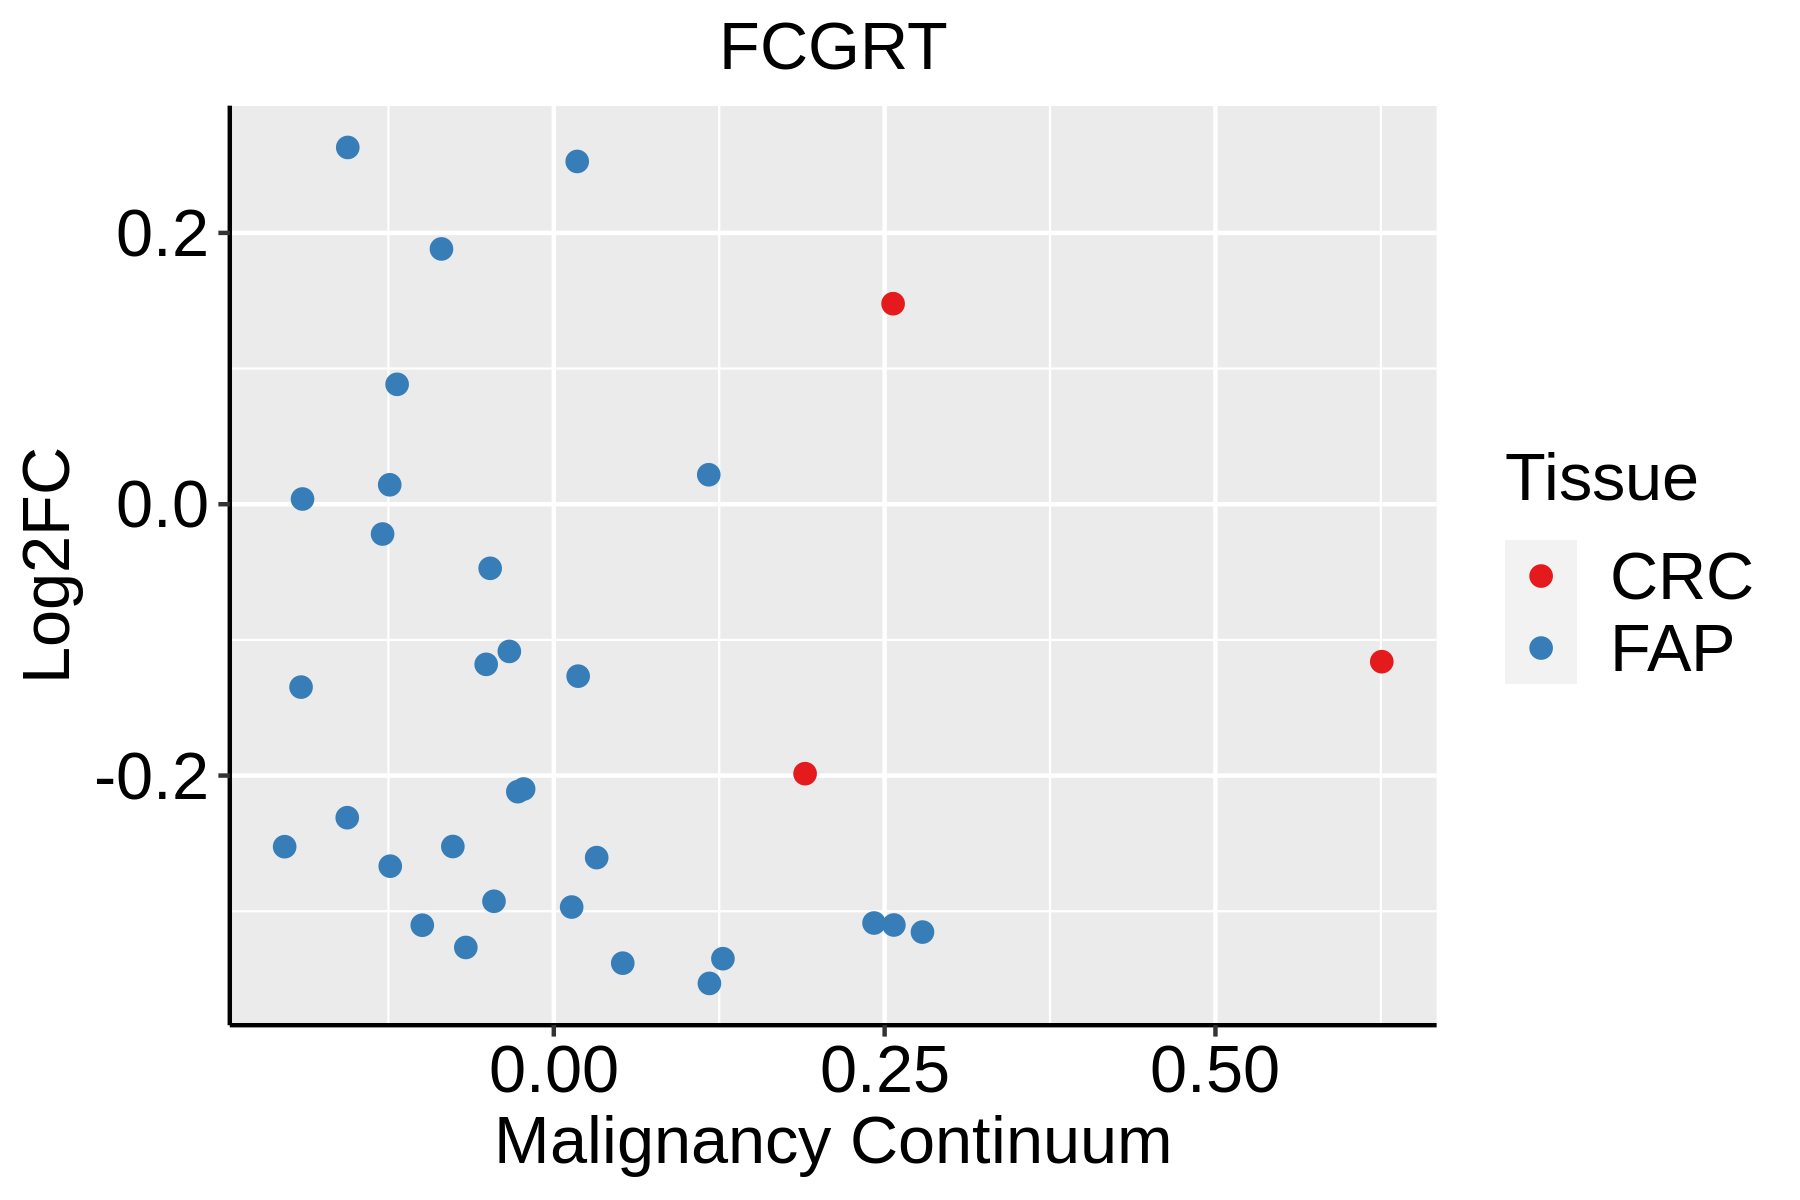 | FAP: Familial adenomatous polyposis |
| CRC: Colorectal cancer | ||
| Colorectum (HTA11) |  | AD: Adenomas |
| SER: Sessile serrated lesions | ||
| MSI-H: Microsatellite-high colorectal cancer | ||
| MSS: Microsatellite stable colorectal cancer | ||
| Endometrium | 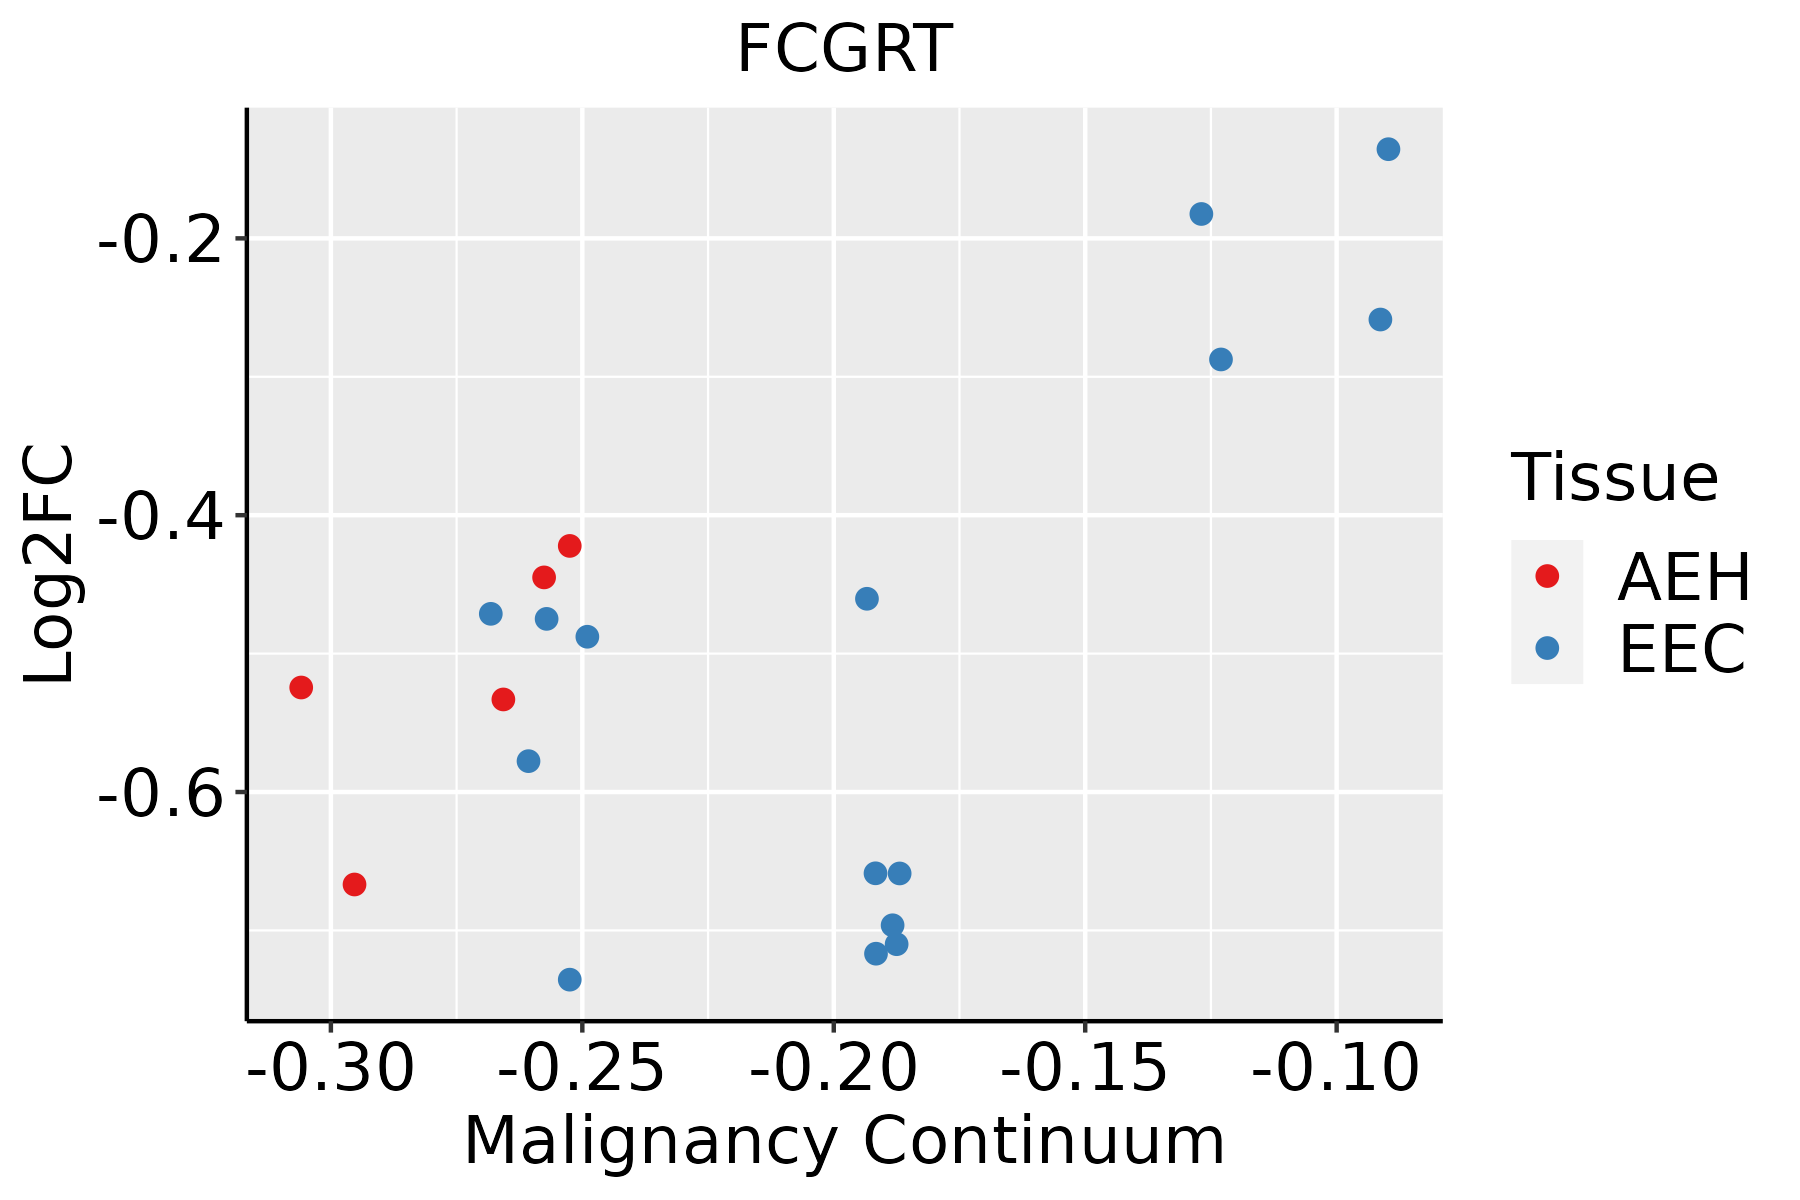 | AEH: Atypical endometrial hyperplasia |
| EEC: Endometrioid Cancer | ||
| Esophagus | 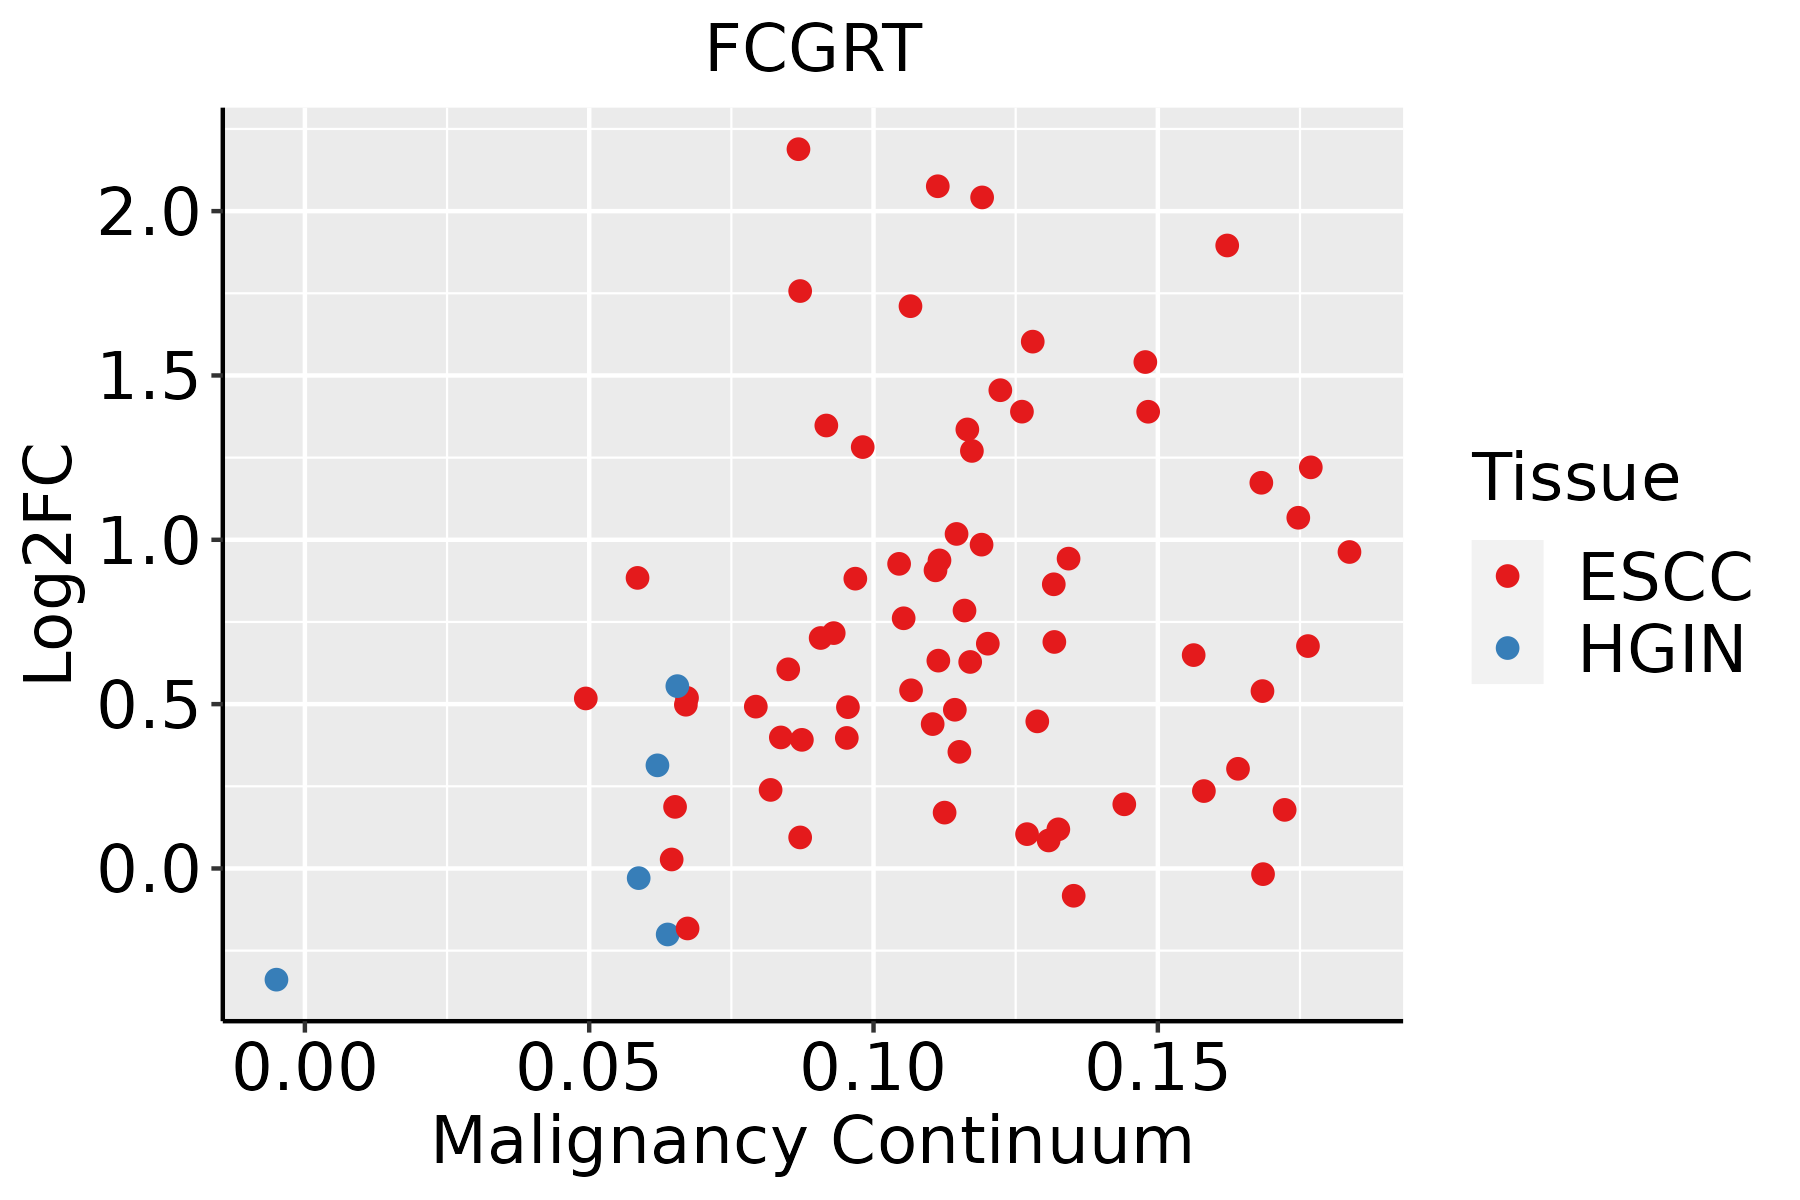 | ESCC: Esophageal squamous cell carcinoma |
| HGIN: High-grade intraepithelial neoplasias | ||
| LGIN: Low-grade intraepithelial neoplasias | ||
| GC | 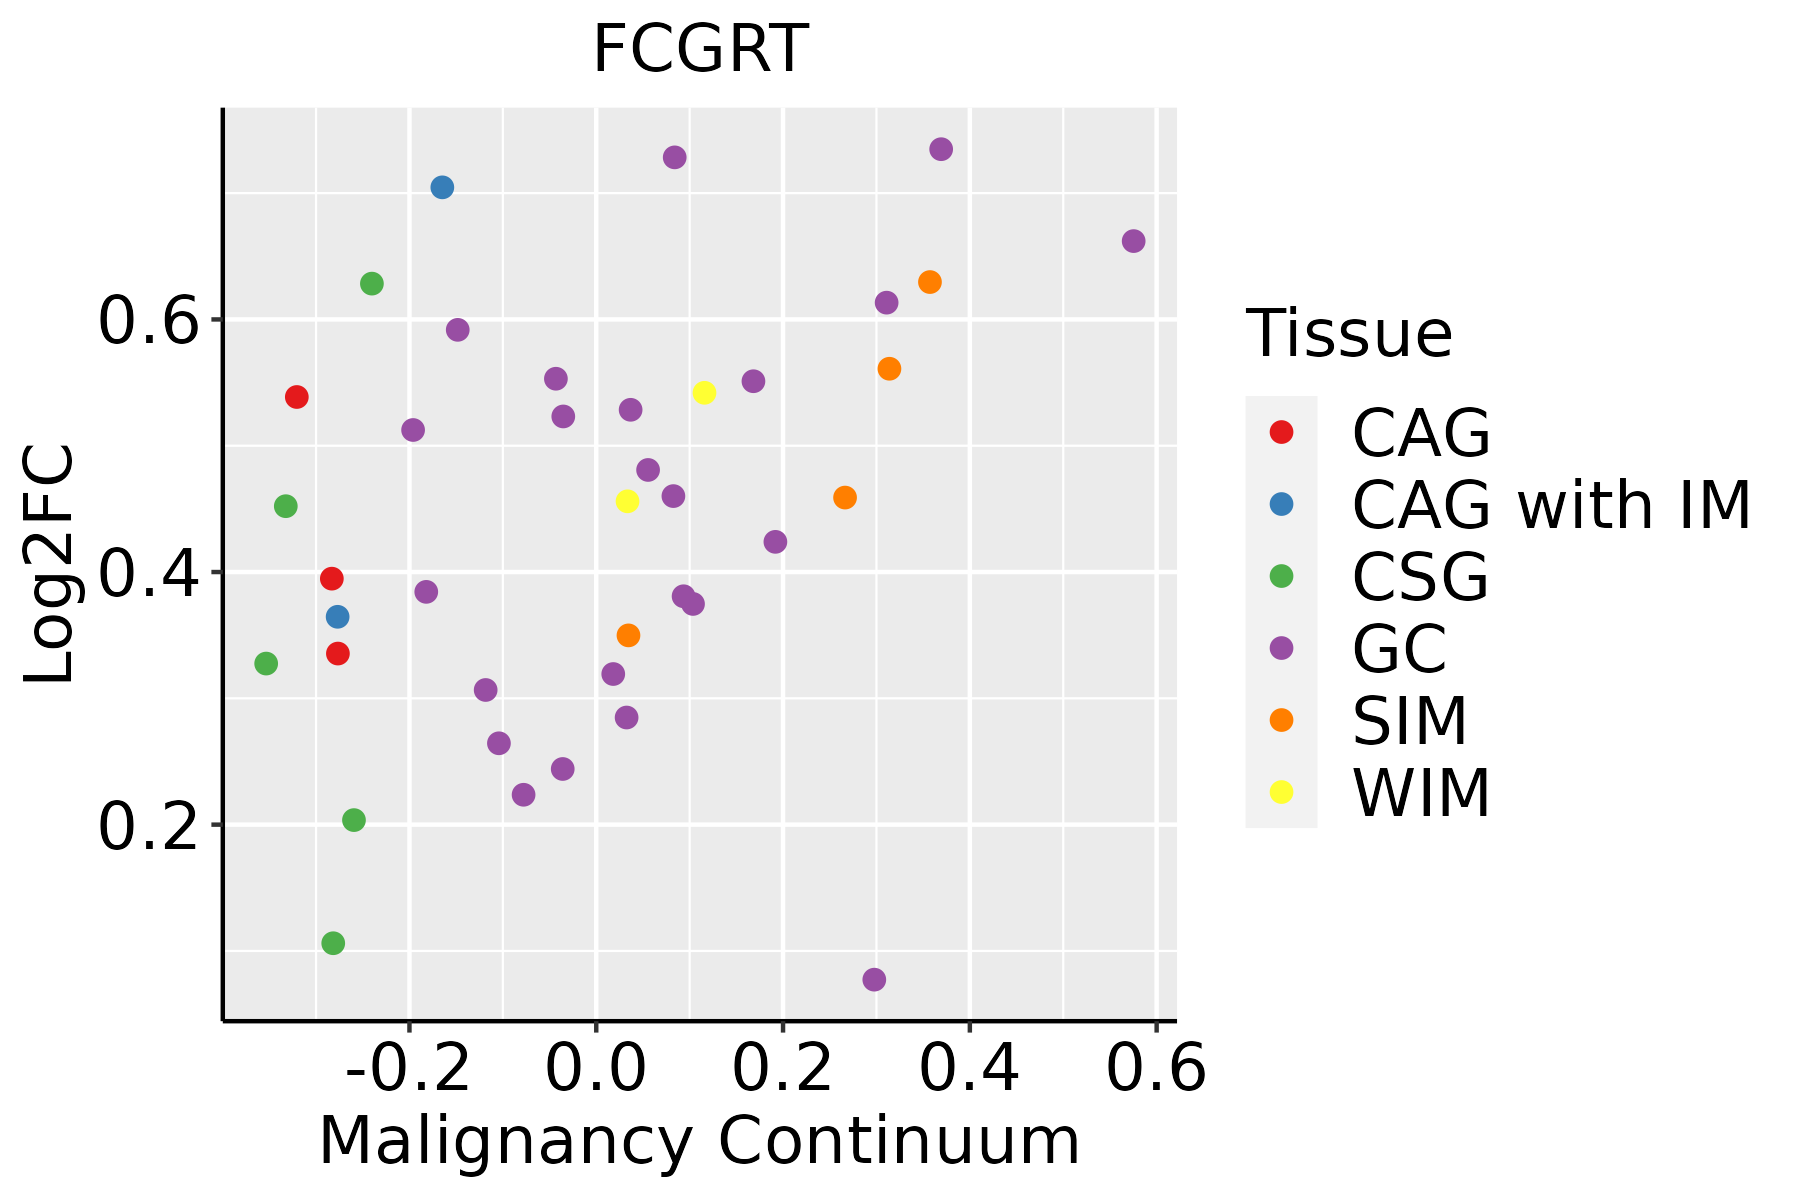 | CAG: Chronic atrophic gastritis |
| CAG with IM: Chronic atrophic gastritis with intestinal metaplasia | ||
| CSG: Chronic superficial gastritis | ||
| GC: Gastric cancer | ||
| SIM: Severe intestinal metaplasia | ||
| WIM: Wild intestinal metaplasia | ||
| Liver | 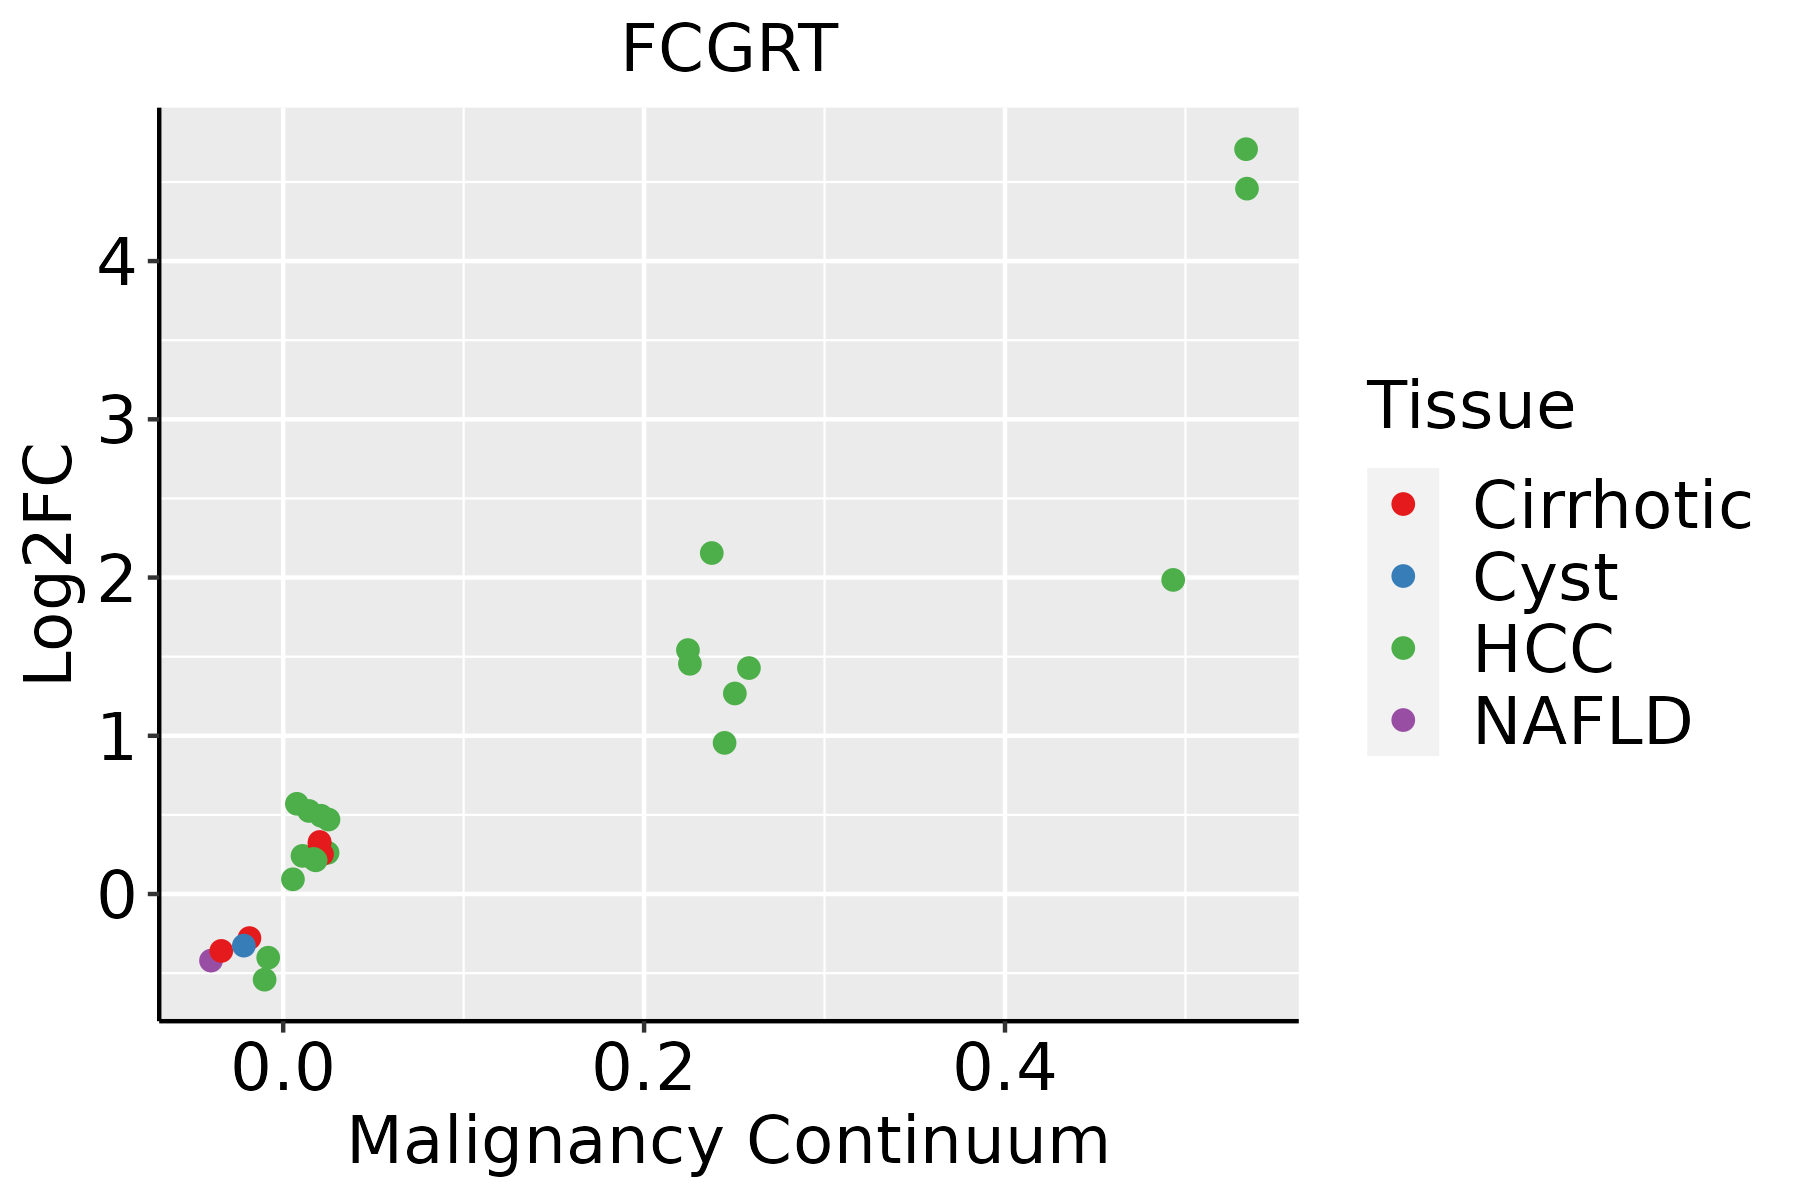 | HCC: Hepatocellular carcinoma |
| NAFLD: Non-alcoholic fatty liver disease | ||
| Oral Cavity | 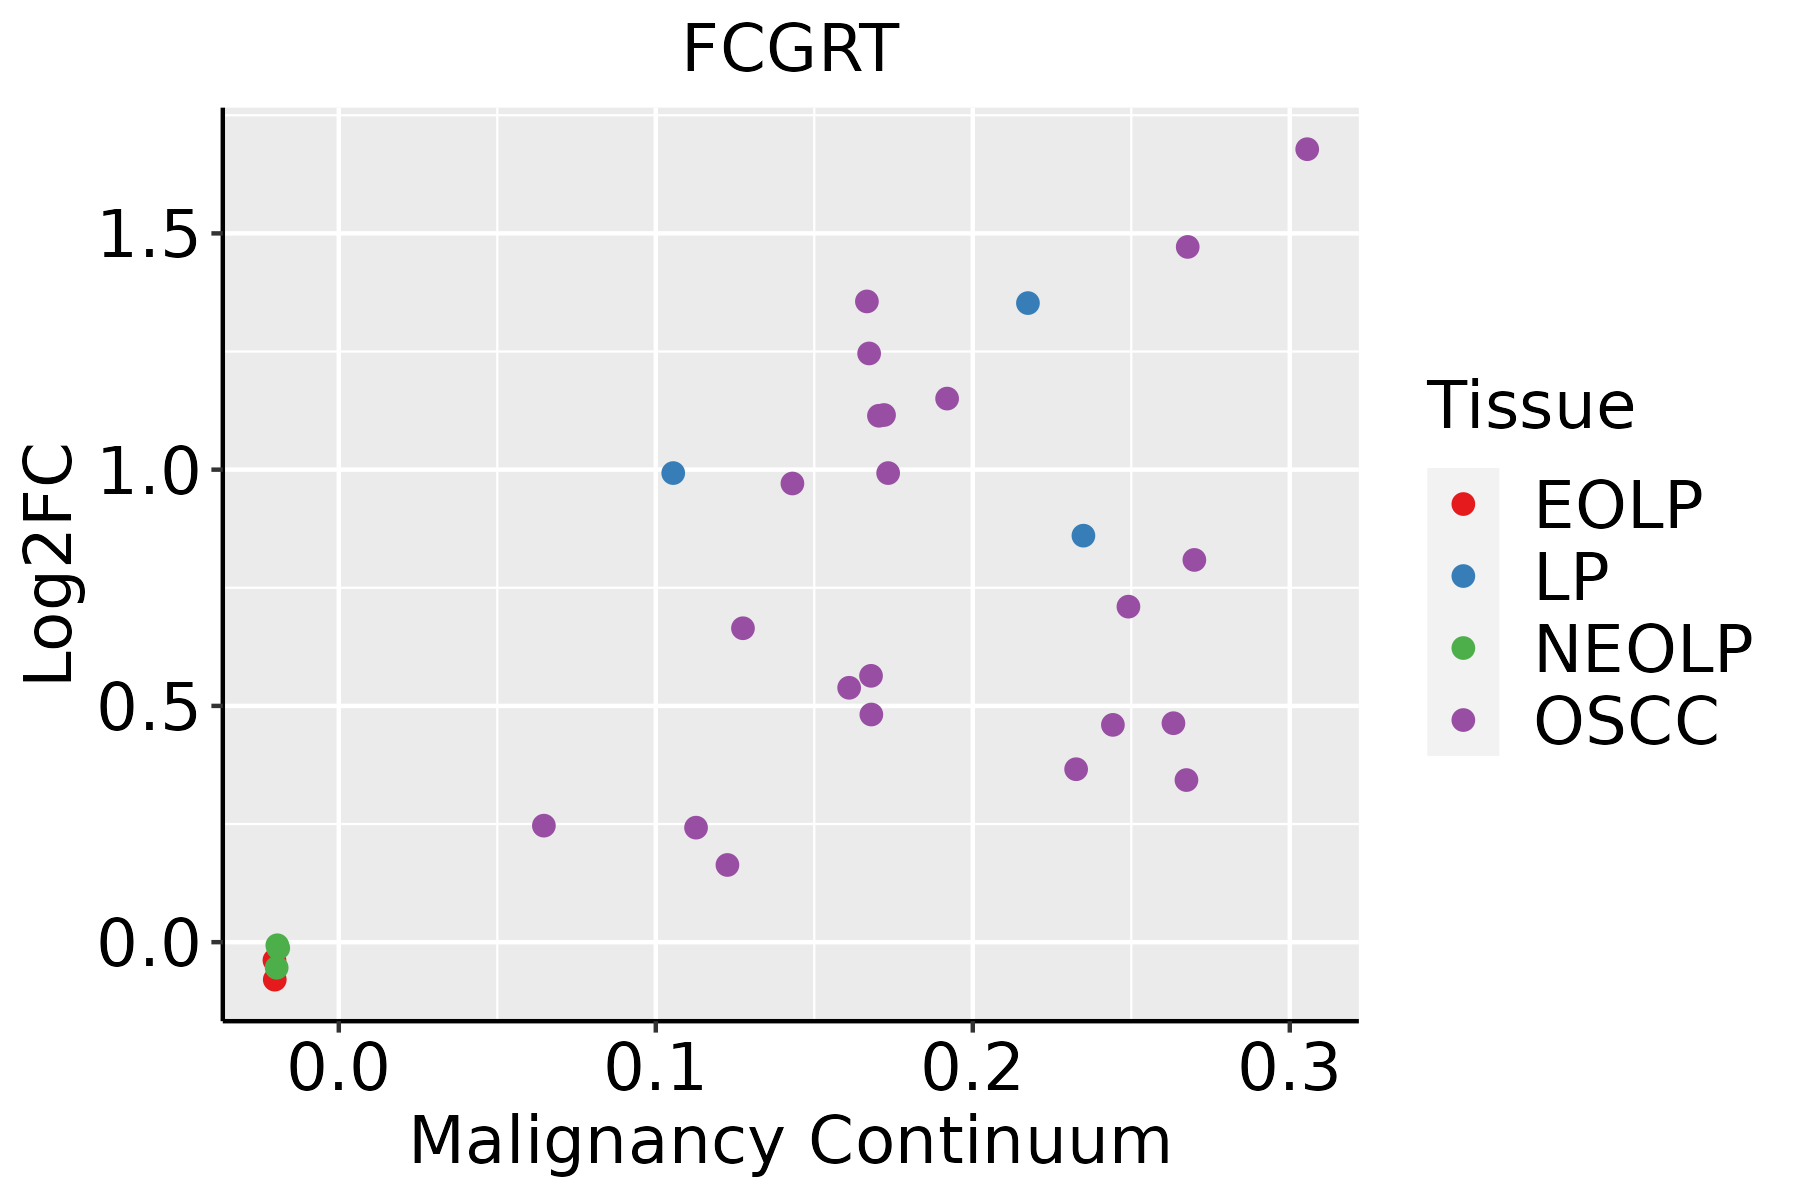 | EOLP: Erosive Oral lichen planus |
| LP: leukoplakia | ||
| NEOLP: Non-erosive oral lichen planus | ||
| OSCC: Oral squamous cell carcinoma | ||
| Prostate | 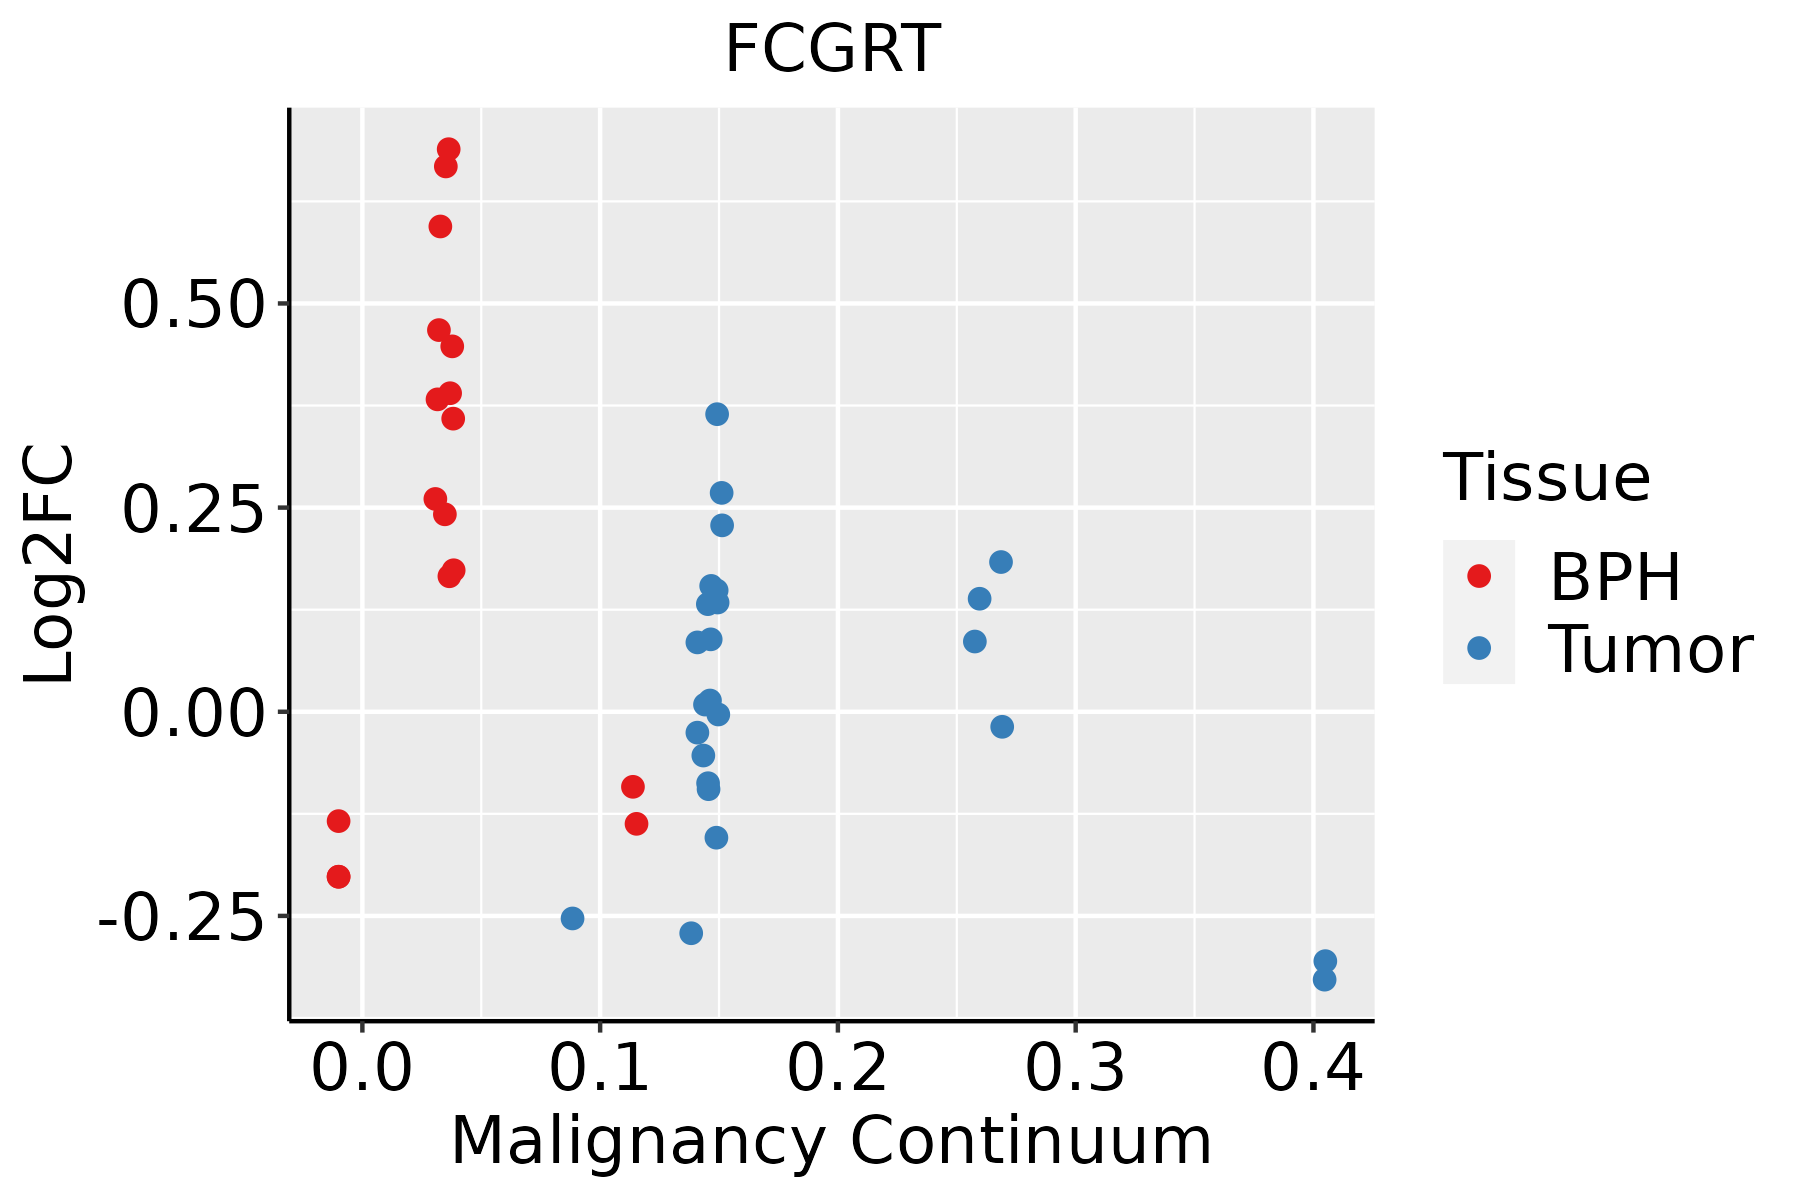 | BPH: Benign Prostatic Hyperplasia |
| Skin | 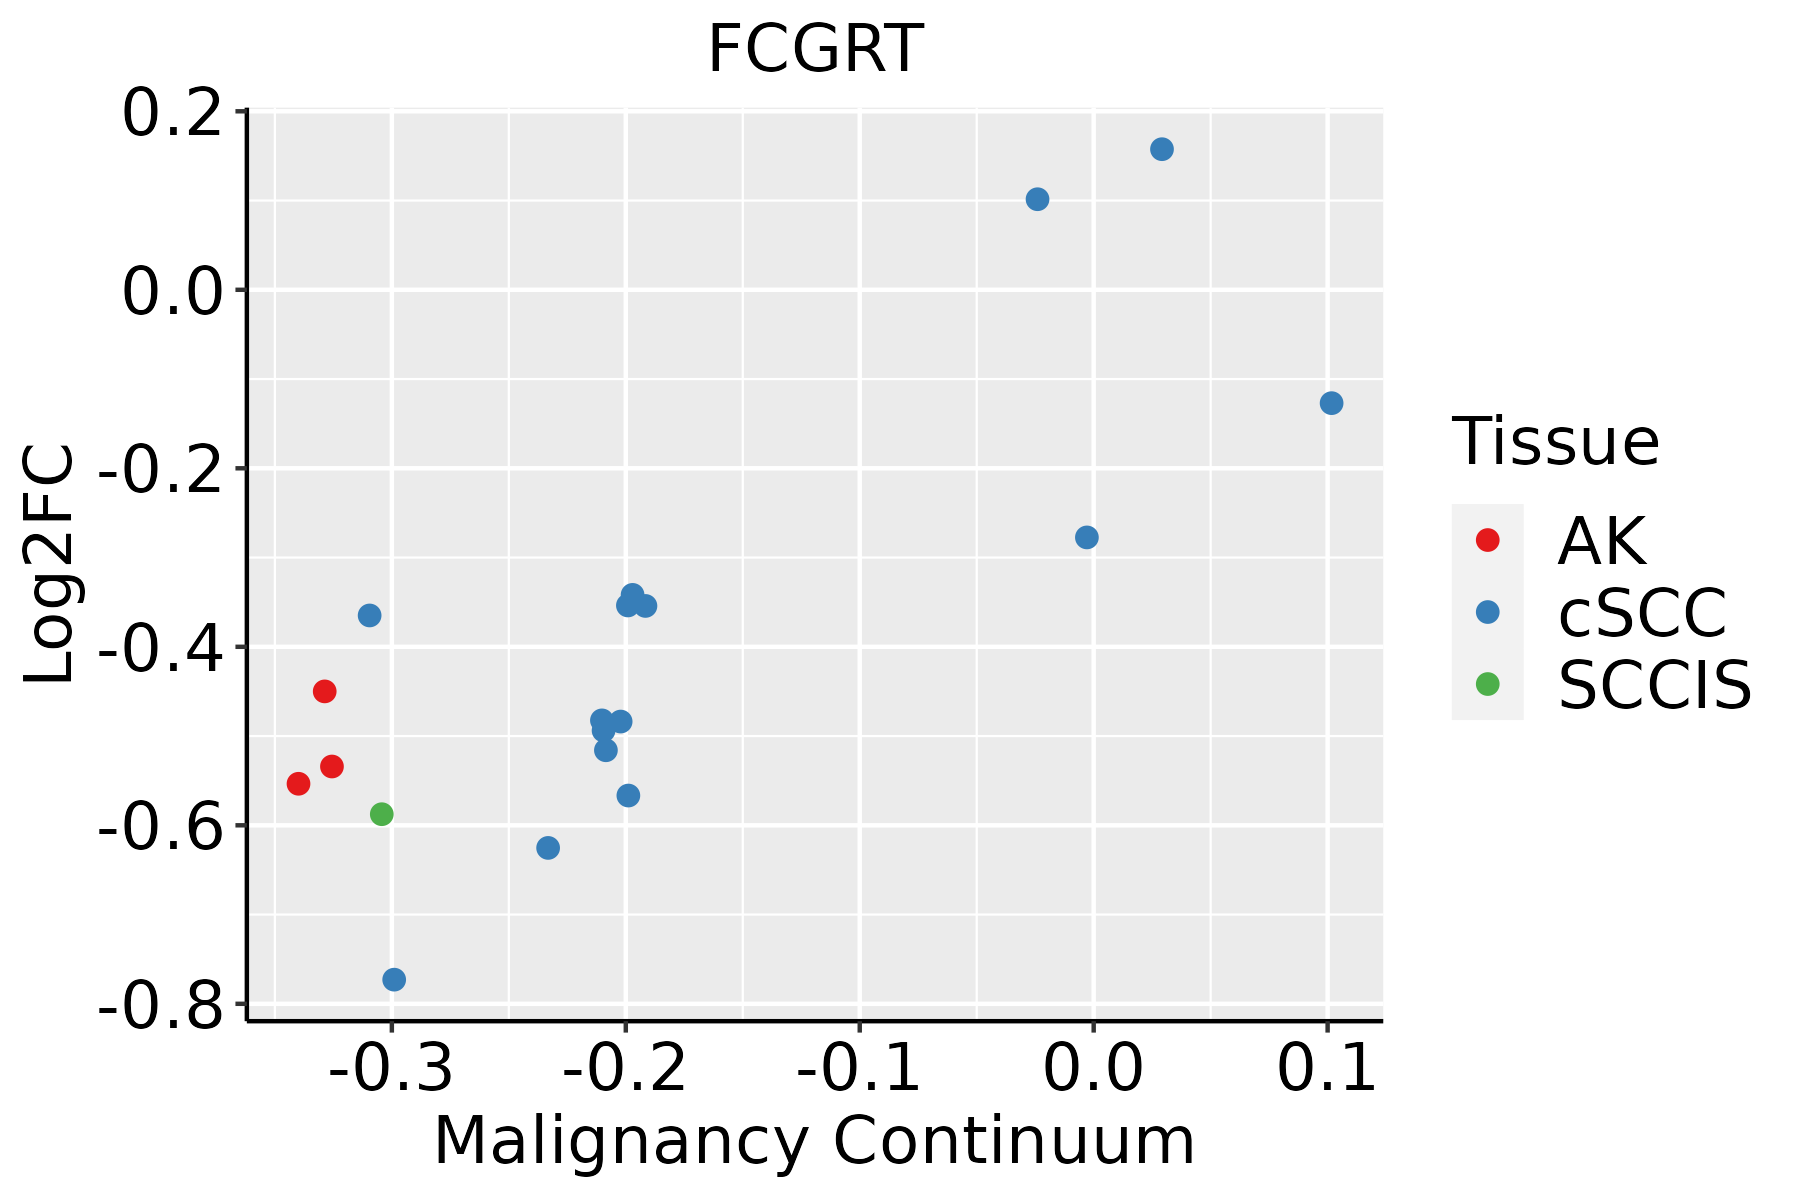 | AK: Actinic keratosis |
| cSCC: Cutaneous squamous cell carcinoma | ||
| SCCIS:squamous cell carcinoma in situ | ||
| Thyroid | 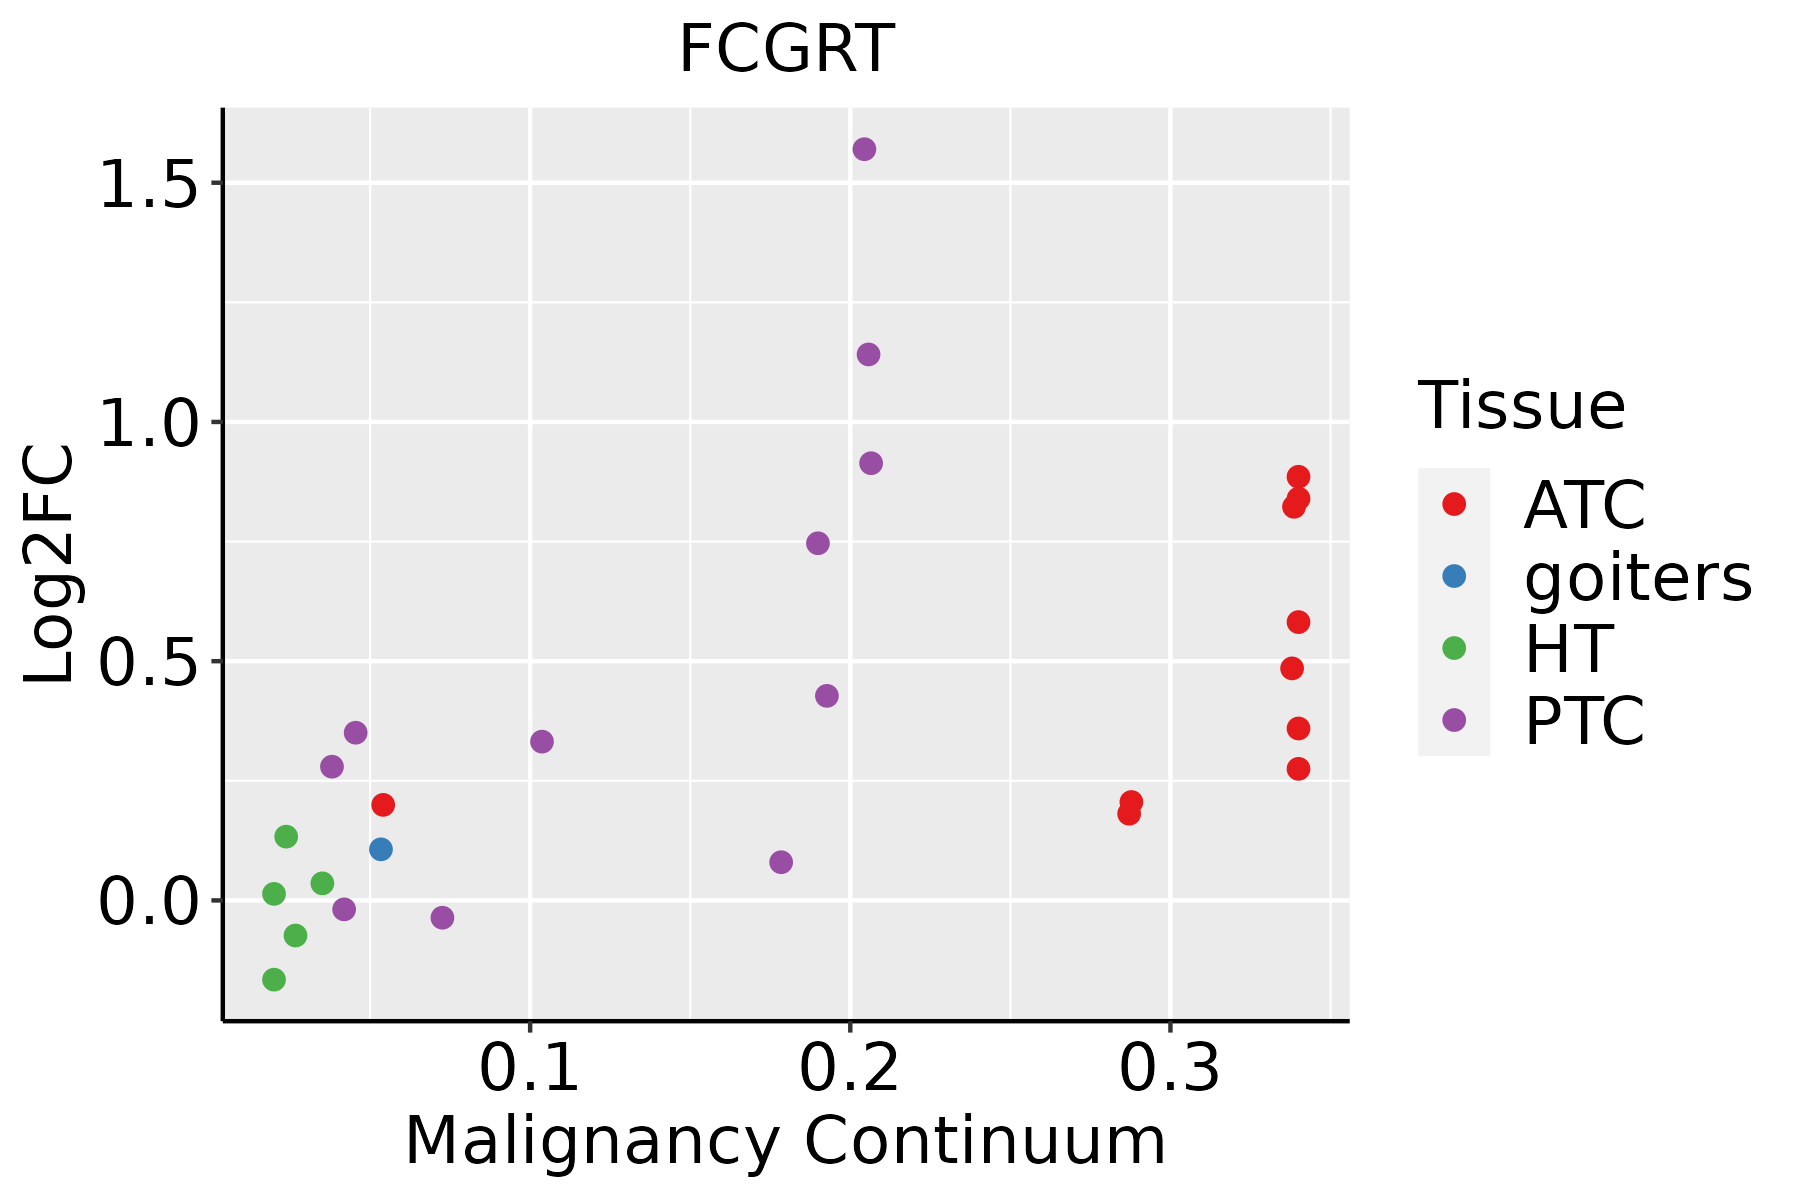 | ATC: Anaplastic thyroid cancer |
| HT: Hashimoto's thyroiditis | ||
| PTC: Papillary thyroid cancer |
| ∗log2FC in expression of this searched gene in stem-like cells from each diseased tissue sample relative to stem-like cells in normal samples in each tissue plotted against the malignancy continuum. Samples are colored based on if they are from different disease stage. |
Top |
Malignant transformation related pathway analysis |
| Find out the enriched GO biological processes and KEGG pathways involved in transition from healthy to precancer to cancer |
| Tissue | Disease Stage | Enriched GO biological Processes |
| Colorectum | AD |  |
| Colorectum | SER |  |
| Colorectum | MSS |  |
| Colorectum | MSI-H |  |
| Colorectum | FAP |  |
| ∗Top 15 enriched GO BP terms are showed in the bar plot of each disease state in each tissue. Each row represents a significant GO biological process which is colored according to the -log10(p.adjust). |
| Page: 1 2 3 4 5 6 7 8 9 |
| GO ID | Tissue | Disease Stage | Description | Gene Ratio | Bg Ratio | pvalue | p.adjust | Count |
| GO:00450565 | Cervix | CC | transcytosis | 7/2311 | 21/18723 | 1.04e-02 | 4.97e-02 | 7 |
| GO:0045056 | Colorectum | AD | transcytosis | 10/3918 | 21/18723 | 5.71e-03 | 3.64e-02 | 10 |
| GO:00450561 | Colorectum | SER | transcytosis | 9/2897 | 21/18723 | 2.50e-03 | 2.33e-02 | 9 |
| GO:00450562 | Colorectum | MSS | transcytosis | 10/3467 | 21/18723 | 2.23e-03 | 1.84e-02 | 10 |
| GO:00450563 | Colorectum | FAP | transcytosis | 8/2622 | 21/18723 | 5.43e-03 | 3.53e-02 | 8 |
| GO:00450568 | Esophagus | ESCC | transcytosis | 17/8552 | 21/18723 | 1.03e-03 | 5.19e-03 | 17 |
| GO:00450564 | Liver | Cirrhotic | transcytosis | 12/4634 | 21/18723 | 1.53e-03 | 9.98e-03 | 12 |
| GO:004505611 | Liver | HCC | transcytosis | 15/7958 | 21/18723 | 7.03e-03 | 2.80e-02 | 15 |
| GO:00450567 | Oral cavity | OSCC | transcytosis | 16/7305 | 21/18723 | 5.99e-04 | 3.39e-03 | 16 |
| GO:004505613 | Oral cavity | LP | transcytosis | 11/4623 | 21/18723 | 5.78e-03 | 3.44e-02 | 11 |
| GO:00450566 | Prostate | BPH | transcytosis | 10/3107 | 21/18723 | 9.32e-04 | 5.91e-03 | 10 |
| GO:004505612 | Prostate | Tumor | transcytosis | 10/3246 | 21/18723 | 1.33e-03 | 8.31e-03 | 10 |
| GO:00450569 | Skin | cSCC | transcytosis | 12/4864 | 21/18723 | 2.40e-03 | 1.38e-02 | 12 |
| GO:004505614 | Thyroid | PTC | transcytosis | 14/5968 | 21/18723 | 1.11e-03 | 6.51e-03 | 14 |
| GO:004505621 | Thyroid | ATC | transcytosis | 14/6293 | 21/18723 | 1.99e-03 | 9.54e-03 | 14 |
| Page: 1 |
| Pathway ID | Tissue | Disease Stage | Description | Gene Ratio | Bg Ratio | pvalue | p.adjust | qvalue | Count |
| Page: 1 |
Top |
Cell-cell communication analysis |
| Identification of potential cell-cell interactions between two cell types and their ligand-receptor pairs for different disease states |
| Ligand | Receptor | LRpair | Pathway | Tissue | Disease Stage |
| Page: 1 |
Top |
Single-cell gene regulatory network inference analysis |
| Find out the significant the regulons (TFs) and the target genes of each regulon across cell types for different disease states |
| TF | Cell Type | Tissue | Disease Stage | Target Gene | RSS | Regulon Activity |
| ∗The dot plots of a searched regulon are shown for all cell subpopulations in each disease state of each tissue based on the regulon specific score inferred using pySCENIC and by calculating the average expression. |
| Page: 1 |
Top |
Somatic mutation of malignant transformation related genes |
| Annotation of somatic variants for genes involved in malignant transformation |
| Hugo Symbol | Variant Class | Variant Classification | dbSNP RS | HGVSc | HGVSp | HGVSp Short | SWISSPROT | BIOTYPE | SIFT | PolyPhen | Tumor Sample Barcode | Tissue | Histology | Sex | Age | Stage | Therapy Types | Drugs | Outcome |
| FCGRT | SNV | Missense_Mutation | c.617G>A | p.Arg206His | p.R206H | P55899 | protein_coding | tolerated(0.68) | probably_damaging(0.968) | TCGA-AO-A128-01 | Breast | breast invasive carcinoma | Female | <65 | I/II | Chemotherapy | doxorubicin | SD | |
| FCGRT | deletion | Frame_Shift_Del | c.321delN | p.Gly109ValfsTer27 | p.G109Vfs*27 | P55899 | protein_coding | TCGA-BH-A18G-01 | Breast | breast invasive carcinoma | Female | >=65 | I/II | Unknown | Unknown | SD | |||
| FCGRT | SNV | Missense_Mutation | novel | c.974N>A | p.Arg325Lys | p.R325K | P55899 | protein_coding | tolerated(0.19) | benign(0.084) | TCGA-C5-A8YQ-01 | Cervix | cervical & endocervical cancer | Female | >=65 | I/II | Chemotherapy | cisplatin | PD |
| FCGRT | SNV | Missense_Mutation | rs767260789 | c.700N>T | p.Arg234Trp | p.R234W | P55899 | protein_coding | deleterious(0.03) | probably_damaging(0.984) | TCGA-FU-A3WB-01 | Cervix | cervical & endocervical cancer | Female | <65 | I/II | Chemotherapy | cisplatin | CR |
| FCGRT | SNV | Missense_Mutation | c.466N>A | p.Glu156Lys | p.E156K | P55899 | protein_coding | tolerated(0.11) | possibly_damaging(0.63) | TCGA-A6-5665-01 | Colorectum | colon adenocarcinoma | Female | >=65 | I/II | Unknown | Unknown | PD | |
| FCGRT | SNV | Missense_Mutation | rs373482955 | c.547N>T | p.Pro183Ser | p.P183S | P55899 | protein_coding | deleterious(0.04) | probably_damaging(0.979) | TCGA-CA-6716-01 | Colorectum | colon adenocarcinoma | Male | >=65 | I/II | Chemotherapy | oxaliplatin | CR |
| FCGRT | SNV | Missense_Mutation | rs144900355 | c.916N>A | p.Gly306Ser | p.G306S | P55899 | protein_coding | tolerated(0.07) | possibly_damaging(0.464) | TCGA-CK-5916-01 | Colorectum | colon adenocarcinoma | Female | >=65 | I/II | Unknown | Unknown | PD |
| FCGRT | SNV | Missense_Mutation | c.917G>T | p.Gly306Val | p.G306V | P55899 | protein_coding | deleterious(0.03) | benign(0.07) | TCGA-F4-6704-01 | Colorectum | colon adenocarcinoma | Male | <65 | III/IV | Unknown | Unknown | SD | |
| FCGRT | SNV | Missense_Mutation | c.356N>T | p.Cys119Phe | p.C119F | P55899 | protein_coding | deleterious(0) | probably_damaging(0.986) | TCGA-G4-6298-01 | Colorectum | colon adenocarcinoma | Male | >=65 | III/IV | Chemotherapy | irinotecan | PD | |
| FCGRT | SNV | Missense_Mutation | rs777748221 | c.839N>T | p.Ala280Val | p.A280V | P55899 | protein_coding | tolerated(0.17) | benign(0.003) | TCGA-QG-A5Z2-01 | Colorectum | colon adenocarcinoma | Male | <65 | I/II | Unknown | Unknown | SD |
| Page: 1 2 3 4 5 |
Top |
Related drugs of malignant transformation related genes |
| Identification of chemicals and drugs interact with genes involved in malignant transfromation |
| (DGIdb 4.0) |
| Entrez ID | Symbol | Category | Interaction Types | Drug Claim Name | Drug Name | PMIDs |
| 2217 | FCGRT | DRUGGABLE GENOME, EXTERNAL SIDE OF PLASMA MEMBRANE | antibody | 374883846 | ||
| 2217 | FCGRT | DRUGGABLE GENOME, EXTERNAL SIDE OF PLASMA MEMBRANE | antibody | 354702250 | ||
| 2217 | FCGRT | DRUGGABLE GENOME, EXTERNAL SIDE OF PLASMA MEMBRANE | antibody | 354702273 | ROZANOLIXIZUMAB |
| Page: 1 |

Copyright 2023-Present -The University of Texas Health Science Center at Houston |