
|
|||||
|
 | |
| |
| |
| |
| |
| |
|
Gene: FCGR3A |
Gene summary for FCGR3A |
| Gene information | Species | Human | Gene symbol | FCGR3A | Gene ID | 2214 |
| Gene name | Fc fragment of IgG receptor IIIa | |
| Gene Alias | CD16 | |
| Cytomap | 1q23.3 | |
| Gene Type | protein-coding | GO ID | GO:0002376 | UniProtAcc | M9MML0 |
Top |
Malignant transformation analysis |
| Identification of the aberrant gene expression in precancerous and cancerous lesions by comparing the gene expression of stem-like cells in diseased tissues with normal stem cells |
| Entrez ID | Symbol | Replicates | Species | Organ | Tissue | Adj P-value | Log2FC | Malignancy |
| 2214 | FCGR3A | HCC1_Meng | Human | Liver | HCC | 1.23e-06 | -5.55e-02 | 0.0246 |
| 2214 | FCGR3A | Pt13.a | Human | Liver | HCC | 6.34e-09 | 2.67e-01 | 0.021 |
| 2214 | FCGR3A | Pt13.c | Human | Liver | HCC | 7.87e-11 | 6.17e-01 | 0.0076 |
| 2214 | FCGR3A | Pt14.d | Human | Liver | HCC | 5.55e-20 | 6.08e-01 | 0.0143 |
| Page: 1 |
| Tissue | Expression Dynamics | Abbreviation |
| Liver | 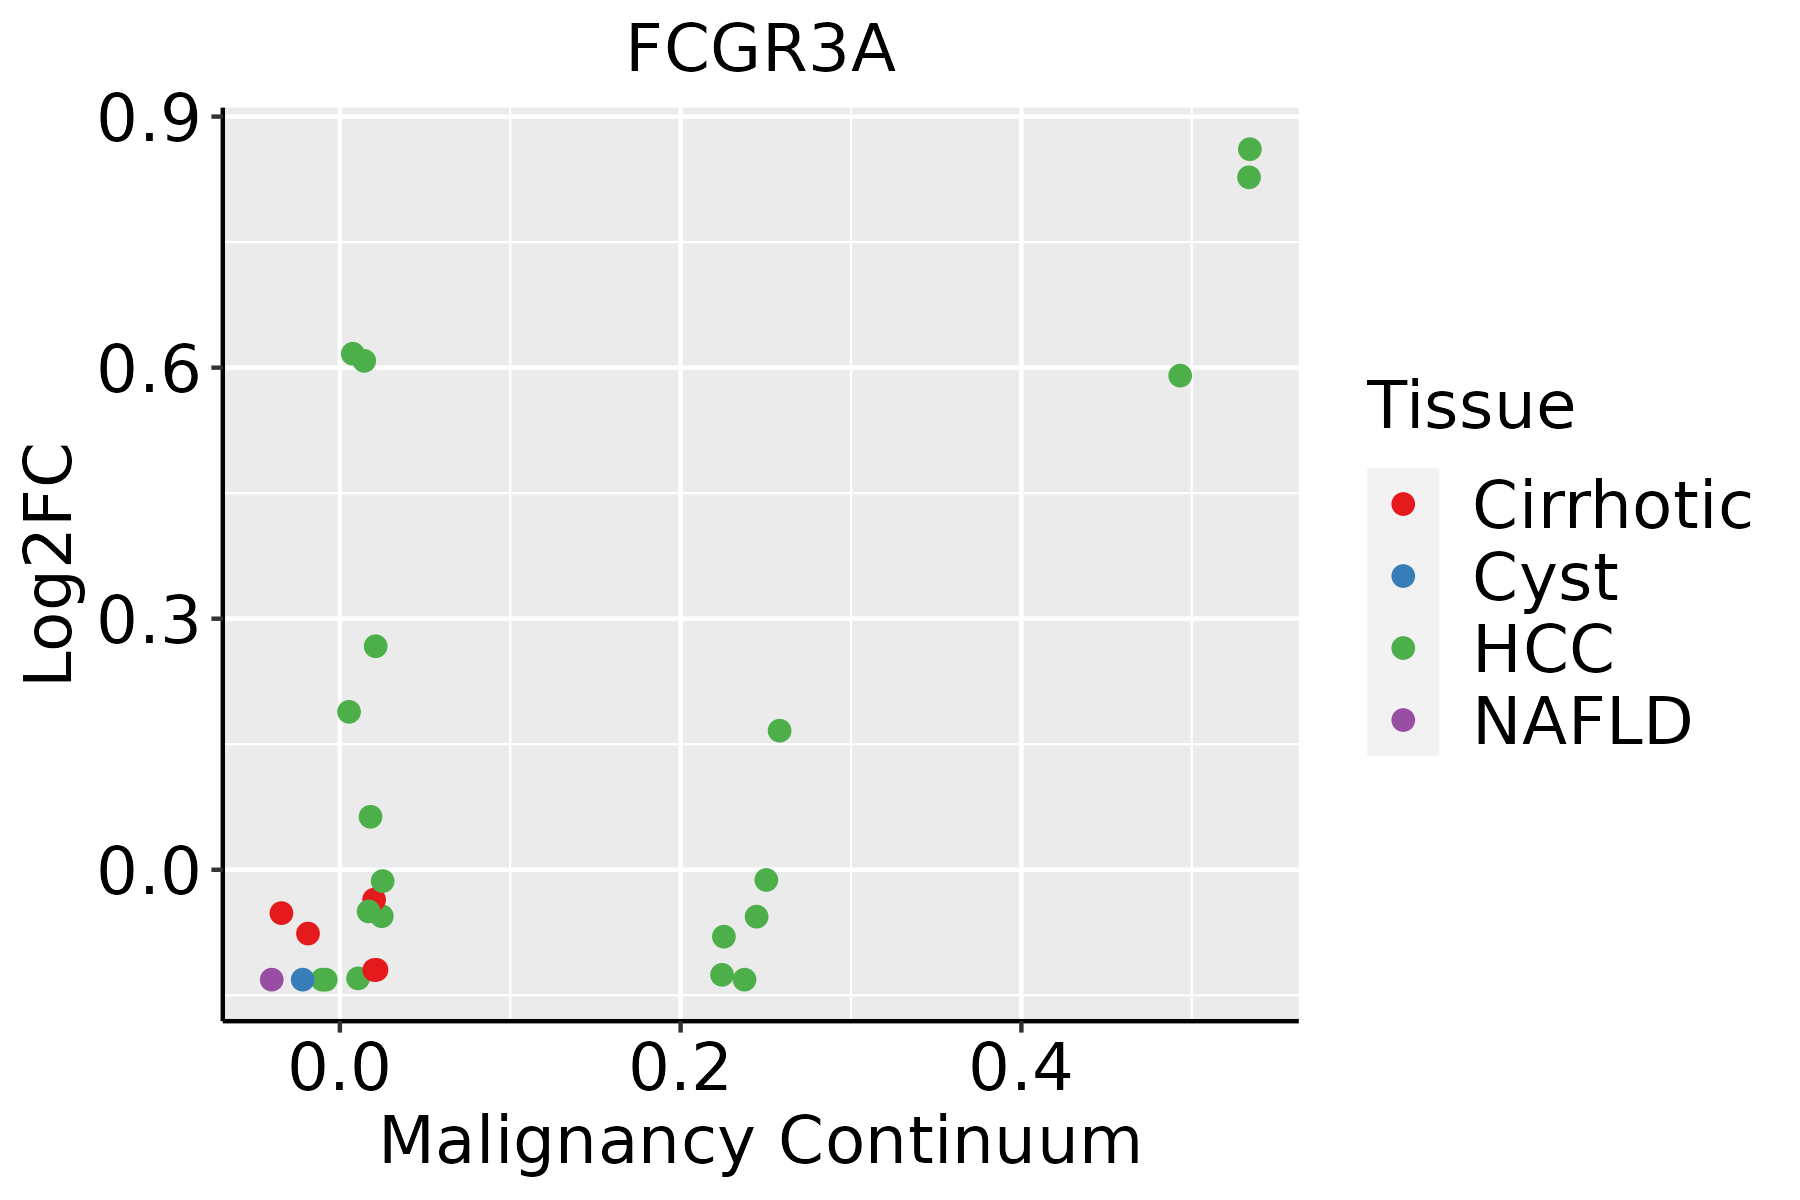 | HCC: Hepatocellular carcinoma |
| NAFLD: Non-alcoholic fatty liver disease |
| ∗log2FC in expression of this searched gene in stem-like cells from each diseased tissue sample relative to stem-like cells in normal samples in each tissue plotted against the malignancy continuum. Samples are colored based on if they are from different disease stage. |
Top |
Malignant transformation related pathway analysis |
| Find out the enriched GO biological processes and KEGG pathways involved in transition from healthy to precancer to cancer |
| Tissue | Disease Stage | Enriched GO biological Processes |
| Colorectum | AD |  |
| Colorectum | SER |  |
| Colorectum | MSS |  |
| Colorectum | MSI-H |  |
| Colorectum | FAP |  |
| ∗Top 15 enriched GO BP terms are showed in the bar plot of each disease state in each tissue. Each row represents a significant GO biological process which is colored according to the -log10(p.adjust). |
| Page: 1 2 3 4 5 6 7 8 9 |
| GO ID | Tissue | Disease Stage | Description | Gene Ratio | Bg Ratio | pvalue | p.adjust | Count |
| Page: 1 |
| Pathway ID | Tissue | Disease Stage | Description | Gene Ratio | Bg Ratio | pvalue | p.adjust | qvalue | Count |
| hsa0414521 | Liver | HCC | Phagosome | 93/4020 | 152/8465 | 4.27e-04 | 1.88e-03 | 1.05e-03 | 93 |
| hsa0466610 | Liver | HCC | Fc gamma R-mediated phagocytosis | 58/4020 | 97/8465 | 9.65e-03 | 2.52e-02 | 1.40e-02 | 58 |
| hsa0414531 | Liver | HCC | Phagosome | 93/4020 | 152/8465 | 4.27e-04 | 1.88e-03 | 1.05e-03 | 93 |
| hsa0466611 | Liver | HCC | Fc gamma R-mediated phagocytosis | 58/4020 | 97/8465 | 9.65e-03 | 2.52e-02 | 1.40e-02 | 58 |
| Page: 1 |
Top |
Cell-cell communication analysis |
| Identification of potential cell-cell interactions between two cell types and their ligand-receptor pairs for different disease states |
| Ligand | Receptor | LRpair | Pathway | Tissue | Disease Stage |
| Page: 1 |
Top |
Single-cell gene regulatory network inference analysis |
| Find out the significant the regulons (TFs) and the target genes of each regulon across cell types for different disease states |
| TF | Cell Type | Tissue | Disease Stage | Target Gene | RSS | Regulon Activity |
| ∗The dot plots of a searched regulon are shown for all cell subpopulations in each disease state of each tissue based on the regulon specific score inferred using pySCENIC and by calculating the average expression. |
| Page: 1 |
Top |
Somatic mutation of malignant transformation related genes |
| Annotation of somatic variants for genes involved in malignant transformation |
| Hugo Symbol | Variant Class | Variant Classification | dbSNP RS | HGVSc | HGVSp | HGVSp Short | SWISSPROT | BIOTYPE | SIFT | PolyPhen | Tumor Sample Barcode | Tissue | Histology | Sex | Age | Stage | Therapy Types | Drugs | Outcome |
| FCGR3A | SNV | Missense_Mutation | novel | c.548N>A | p.Gly183Asp | p.G183D | protein_coding | tolerated(0.05) | probably_damaging(0.978) | TCGA-AO-A128-01 | Breast | breast invasive carcinoma | Female | <65 | I/II | Chemotherapy | doxorubicin | SD | |
| FCGR3A | SNV | Missense_Mutation | novel | c.716N>C | p.Phe239Ser | p.F239S | protein_coding | tolerated(0.14) | benign(0.03) | TCGA-AA-3811-01 | Colorectum | colon adenocarcinoma | Female | >=65 | III/IV | Unknown | Unknown | PD | |
| FCGR3A | SNV | Missense_Mutation | rs370288605 | c.163N>T | p.Arg55Trp | p.R55W | protein_coding | deleterious(0.01) | possibly_damaging(0.655) | TCGA-AZ-4323-01 | Colorectum | colon adenocarcinoma | Male | <65 | III/IV | Chemotherapy | oxaliplatin | PD | |
| FCGR3A | SNV | Missense_Mutation | c.479N>G | p.Ile160Ser | p.I160S | protein_coding | deleterious(0) | probably_damaging(0.999) | TCGA-CA-6718-01 | Colorectum | colon adenocarcinoma | Male | <65 | I/II | Unknown | Unknown | PD | ||
| FCGR3A | SNV | Missense_Mutation | rs778260076 | c.451N>T | p.Arg151Trp | p.R151W | protein_coding | deleterious(0) | possibly_damaging(0.842) | TCGA-DM-A1D4-01 | Colorectum | colon adenocarcinoma | Male | >=65 | I/II | Unknown | Unknown | PD | |
| FCGR3A | SNV | Missense_Mutation | rs749283416 | c.401A>G | p.Asp134Gly | p.D134G | protein_coding | deleterious(0) | probably_damaging(1) | TCGA-AG-3892-01 | Colorectum | rectum adenocarcinoma | Female | <65 | I/II | Unknown | Unknown | SD | |
| FCGR3A | SNV | Missense_Mutation | rs778260076 | c.451N>T | p.Arg151Trp | p.R151W | protein_coding | deleterious(0) | possibly_damaging(0.842) | TCGA-A5-A0G2-01 | Endometrium | uterine corpus endometrioid carcinoma | Female | <65 | III/IV | Unknown | Unknown | SD | |
| FCGR3A | SNV | Missense_Mutation | rs142959418 | c.220N>T | p.Leu74Phe | p.L74F | protein_coding | tolerated(0.08) | probably_damaging(1) | TCGA-A5-A2K5-01 | Endometrium | uterine corpus endometrioid carcinoma | Female | >=65 | I/II | Unknown | Unknown | SD | |
| FCGR3A | SNV | Missense_Mutation | novel | c.444N>T | p.Gln148His | p.Q148H | protein_coding | deleterious(0) | probably_damaging(0.997) | TCGA-AP-A059-01 | Endometrium | uterine corpus endometrioid carcinoma | Female | >=65 | I/II | Unknown | Unknown | SD | |
| FCGR3A | SNV | Missense_Mutation | c.77N>A | p.Ser26Tyr | p.S26Y | protein_coding | deleterious(0.04) | possibly_damaging(0.804) | TCGA-AX-A05Z-01 | Endometrium | uterine corpus endometrioid carcinoma | Female | <65 | III/IV | Chemotherapy | adriamycin | SD |
| Page: 1 2 3 4 5 |
Top |
Related drugs of malignant transformation related genes |
| Identification of chemicals and drugs interact with genes involved in malignant transfromation |
| (DGIdb 4.0) |
| Entrez ID | Symbol | Category | Interaction Types | Drug Claim Name | Drug Name | PMIDs |
| 2214 | FCGR3A | EXTERNAL SIDE OF PLASMA MEMBRANE, DRUGGABLE GENOME, CLINICALLY ACTIONABLE | PROTEASE INHIBITORS | 16103765 | ||
| 2214 | FCGR3A | EXTERNAL SIDE OF PLASMA MEMBRANE, DRUGGABLE GENOME, CLINICALLY ACTIONABLE | LIF | 7686393 | ||
| 2214 | FCGR3A | EXTERNAL SIDE OF PLASMA MEMBRANE, DRUGGABLE GENOME, CLINICALLY ACTIONABLE | CYCLOSPORINE | CYCLOSPORINE | 17852453 | |
| 2214 | FCGR3A | EXTERNAL SIDE OF PLASMA MEMBRANE, DRUGGABLE GENOME, CLINICALLY ACTIONABLE | ANGIOGENESIS INHIBITOR | 15457133 | ||
| 2214 | FCGR3A | EXTERNAL SIDE OF PLASMA MEMBRANE, DRUGGABLE GENOME, CLINICALLY ACTIONABLE | H2O2 | 2138680 | ||
| 2214 | FCGR3A | EXTERNAL SIDE OF PLASMA MEMBRANE, DRUGGABLE GENOME, CLINICALLY ACTIONABLE | BRM | 1832500 | ||
| 2214 | FCGR3A | EXTERNAL SIDE OF PLASMA MEMBRANE, DRUGGABLE GENOME, CLINICALLY ACTIONABLE | INDOMETHACIN | INDOMETHACIN | 17329922 | |
| 2214 | FCGR3A | EXTERNAL SIDE OF PLASMA MEMBRANE, DRUGGABLE GENOME, CLINICALLY ACTIONABLE | IL-8 | 1827816 | ||
| 2214 | FCGR3A | EXTERNAL SIDE OF PLASMA MEMBRANE, DRUGGABLE GENOME, CLINICALLY ACTIONABLE | FLT3L | 15102482 | ||
| 2214 | FCGR3A | EXTERNAL SIDE OF PLASMA MEMBRANE, DRUGGABLE GENOME, CLINICALLY ACTIONABLE | RECOMBINANT STEM CELL FACTOR | 10432289 |
| Page: 1 2 3 4 5 6 |

Copyright 2023-Present -The University of Texas Health Science Center at Houston |