
|
|||||
|
 | |
| |
| |
| |
| |
| |
|
Gene: FCGBP |
Gene summary for FCGBP |
| Gene information | Species | Human | Gene symbol | FCGBP | Gene ID | 8857 |
| Gene name | Fc fragment of IgG binding protein | |
| Gene Alias | FC(GAMMA)BP | |
| Cytomap | 19q13.2 | |
| Gene Type | protein-coding | GO ID | GO:0005575 | UniProtAcc | Q9Y6R7 |
Top |
Malignant transformation analysis |
| Identification of the aberrant gene expression in precancerous and cancerous lesions by comparing the gene expression of stem-like cells in diseased tissues with normal stem cells |
| Entrez ID | Symbol | Replicates | Species | Organ | Tissue | Adj P-value | Log2FC | Malignancy |
| 8857 | FCGBP | CA_HPV_1 | Human | Cervix | CC | 1.45e-10 | -3.40e-01 | 0.0264 |
| 8857 | FCGBP | CA_HPV_3 | Human | Cervix | CC | 1.97e-03 | -2.60e-01 | 0.0414 |
| 8857 | FCGBP | CCII_1 | Human | Cervix | CC | 2.57e-02 | -3.24e-01 | 0.3249 |
| 8857 | FCGBP | Tumor | Human | Cervix | CC | 3.32e-13 | -3.47e-01 | 0.1241 |
| 8857 | FCGBP | sample1 | Human | Cervix | CC | 3.26e-04 | -3.47e-01 | 0.0959 |
| 8857 | FCGBP | sample3 | Human | Cervix | CC | 5.98e-15 | -3.47e-01 | 0.1387 |
| 8857 | FCGBP | H2 | Human | Cervix | HSIL_HPV | 4.45e-30 | 1.05e+00 | 0.0632 |
| 8857 | FCGBP | L1 | Human | Cervix | CC | 3.14e-06 | -3.47e-01 | 0.0802 |
| 8857 | FCGBP | T1 | Human | Cervix | CC | 9.73e-12 | -3.47e-01 | 0.0918 |
| 8857 | FCGBP | T2 | Human | Cervix | CC | 3.15e-03 | 6.82e-01 | 0.0709 |
| 8857 | FCGBP | T3 | Human | Cervix | CC | 3.60e-12 | -3.47e-01 | 0.1389 |
| 8857 | FCGBP | HTA11_3410_2000001011 | Human | Colorectum | AD | 5.45e-05 | 4.86e-01 | 0.0155 |
| 8857 | FCGBP | HTA11_2487_2000001011 | Human | Colorectum | SER | 3.71e-38 | 3.42e+00 | -0.1808 |
| 8857 | FCGBP | HTA11_1938_2000001011 | Human | Colorectum | AD | 8.75e-28 | 2.65e+00 | -0.0811 |
| 8857 | FCGBP | HTA11_78_2000001011 | Human | Colorectum | AD | 1.41e-50 | 3.77e+00 | -0.1088 |
| 8857 | FCGBP | HTA11_347_2000001011 | Human | Colorectum | AD | 5.27e-15 | 2.12e+00 | -0.1954 |
| 8857 | FCGBP | HTA11_411_2000001011 | Human | Colorectum | SER | 1.02e-04 | 3.27e+00 | -0.2602 |
| 8857 | FCGBP | HTA11_2112_2000001011 | Human | Colorectum | SER | 8.15e-18 | 4.87e+00 | -0.2196 |
| 8857 | FCGBP | HTA11_3361_2000001011 | Human | Colorectum | AD | 5.40e-35 | 3.96e+00 | -0.1207 |
| 8857 | FCGBP | HTA11_83_2000001011 | Human | Colorectum | SER | 2.96e-17 | 2.69e+00 | -0.1526 |
| Page: 1 2 3 4 5 |
| Tissue | Expression Dynamics | Abbreviation |
| Cervix |  | CC: Cervix cancer |
| HSIL_HPV: HPV-infected high-grade squamous intraepithelial lesions | ||
| N_HPV: HPV-infected normal cervix | ||
| Colorectum (GSE201348) |  | FAP: Familial adenomatous polyposis |
| CRC: Colorectal cancer | ||
| Colorectum (HTA11) |  | AD: Adenomas |
| SER: Sessile serrated lesions | ||
| MSI-H: Microsatellite-high colorectal cancer | ||
| MSS: Microsatellite stable colorectal cancer | ||
| Esophagus | 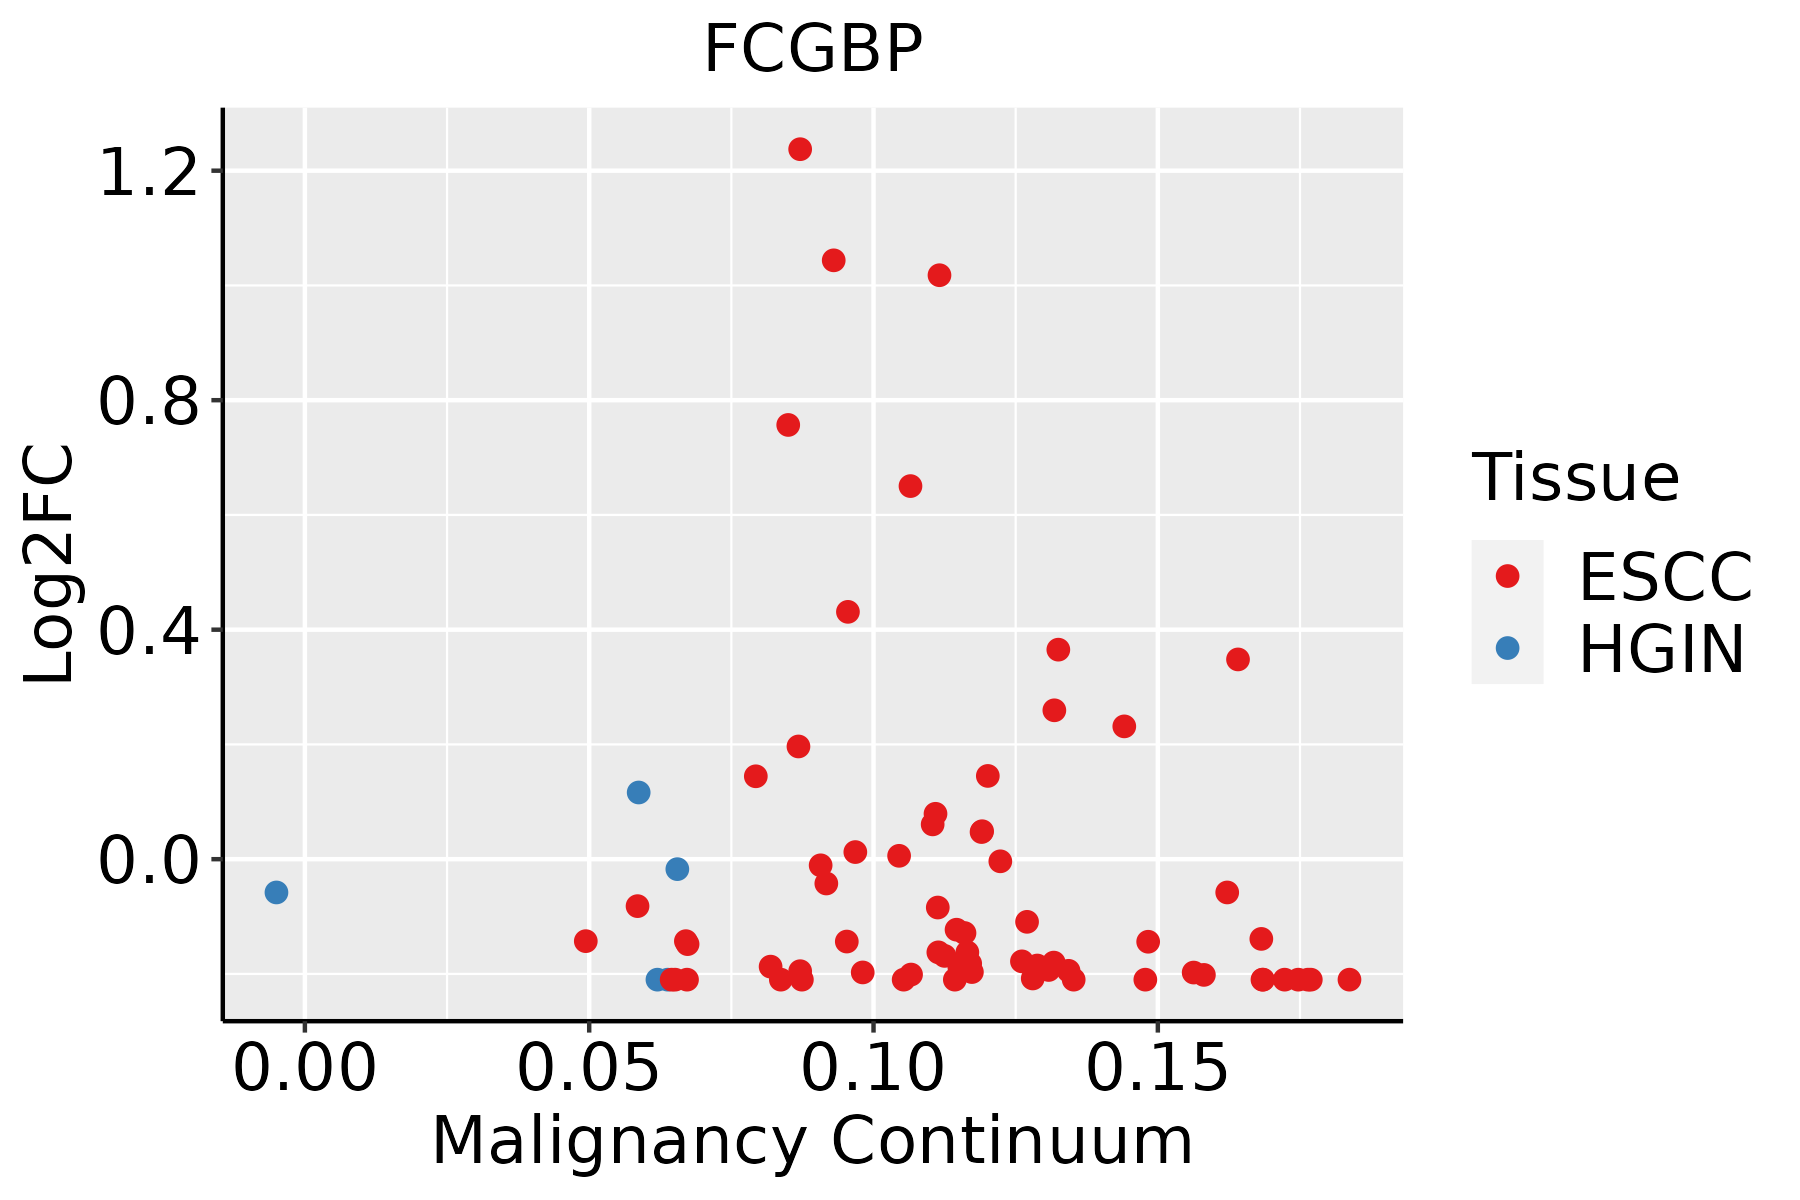 | ESCC: Esophageal squamous cell carcinoma |
| HGIN: High-grade intraepithelial neoplasias | ||
| LGIN: Low-grade intraepithelial neoplasias | ||
| GC | 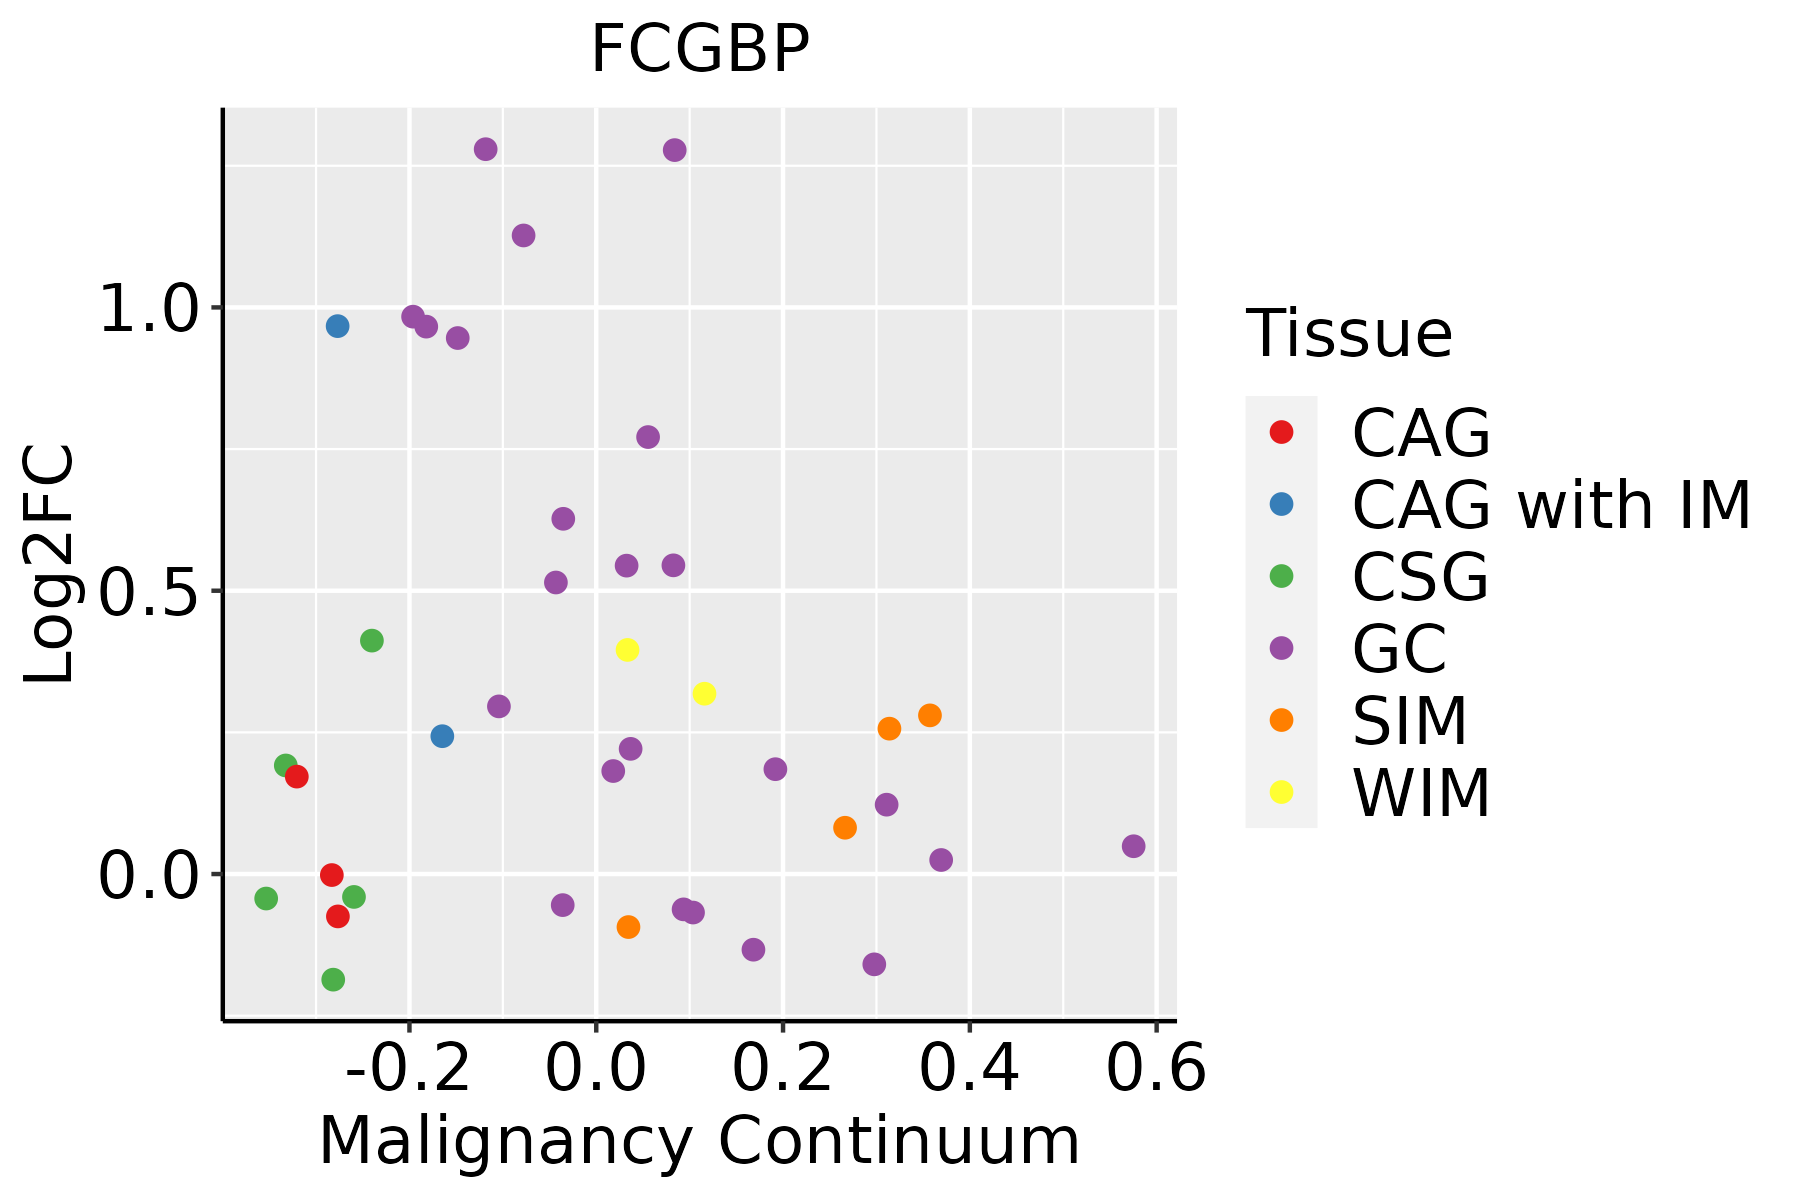 | CAG: Chronic atrophic gastritis |
| CAG with IM: Chronic atrophic gastritis with intestinal metaplasia | ||
| CSG: Chronic superficial gastritis | ||
| GC: Gastric cancer | ||
| SIM: Severe intestinal metaplasia | ||
| WIM: Wild intestinal metaplasia | ||
| Thyroid | 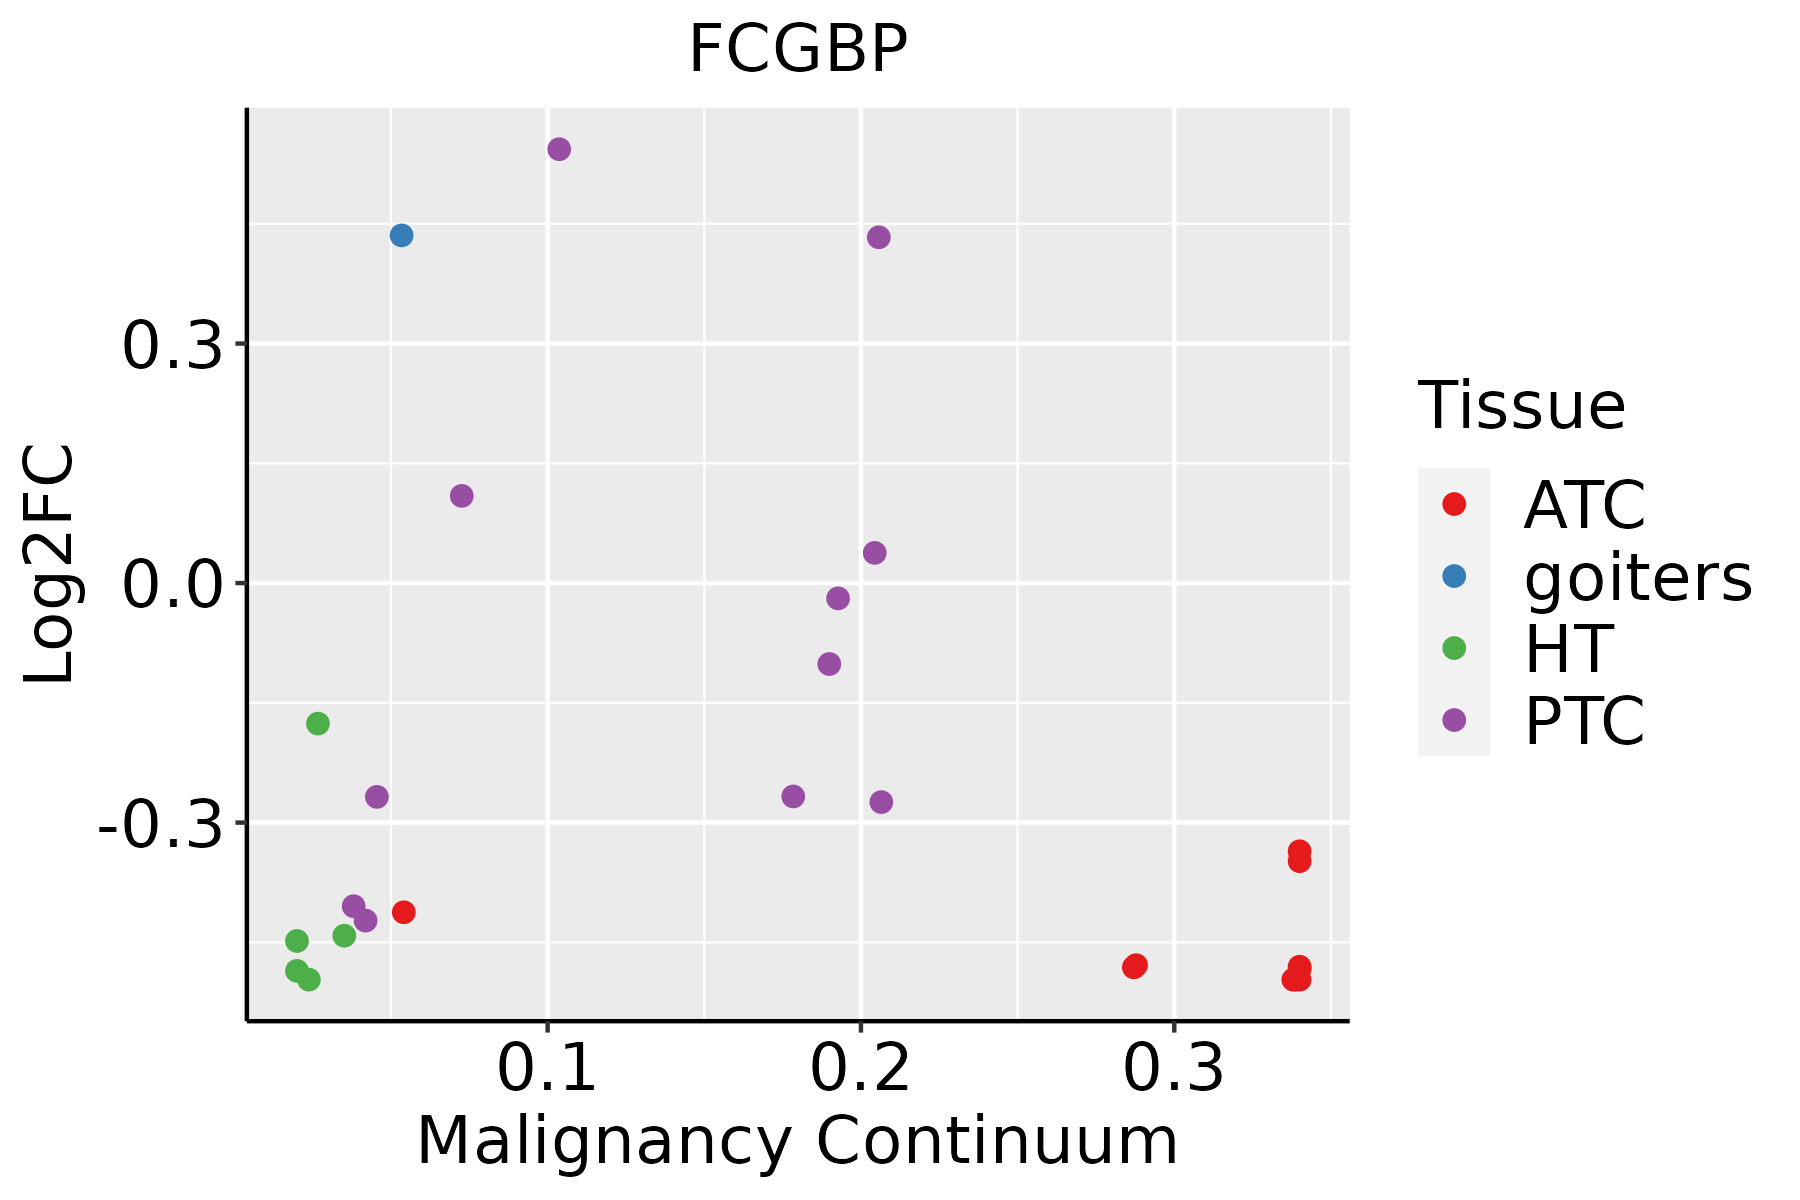 | ATC: Anaplastic thyroid cancer |
| HT: Hashimoto's thyroiditis | ||
| PTC: Papillary thyroid cancer |
| ∗log2FC in expression of this searched gene in stem-like cells from each diseased tissue sample relative to stem-like cells in normal samples in each tissue plotted against the malignancy continuum. Samples are colored based on if they are from different disease stage. |
Top |
Malignant transformation related pathway analysis |
| Find out the enriched GO biological processes and KEGG pathways involved in transition from healthy to precancer to cancer |
| Tissue | Disease Stage | Enriched GO biological Processes |
| Colorectum | AD |  |
| Colorectum | SER |  |
| Colorectum | MSS |  |
| Colorectum | MSI-H |  |
| Colorectum | FAP |  |
| ∗Top 15 enriched GO BP terms are showed in the bar plot of each disease state in each tissue. Each row represents a significant GO biological process which is colored according to the -log10(p.adjust). |
| Page: 1 2 3 4 5 6 7 8 9 |
| GO ID | Tissue | Disease Stage | Description | Gene Ratio | Bg Ratio | pvalue | p.adjust | Count |
| Page: 1 |
| Pathway ID | Tissue | Disease Stage | Description | Gene Ratio | Bg Ratio | pvalue | p.adjust | qvalue | Count |
| Page: 1 |
Top |
Cell-cell communication analysis |
| Identification of potential cell-cell interactions between two cell types and their ligand-receptor pairs for different disease states |
| Ligand | Receptor | LRpair | Pathway | Tissue | Disease Stage |
| Page: 1 |
Top |
Single-cell gene regulatory network inference analysis |
| Find out the significant the regulons (TFs) and the target genes of each regulon across cell types for different disease states |
| TF | Cell Type | Tissue | Disease Stage | Target Gene | RSS | Regulon Activity |
| ∗The dot plots of a searched regulon are shown for all cell subpopulations in each disease state of each tissue based on the regulon specific score inferred using pySCENIC and by calculating the average expression. |
| Page: 1 |
Top |
Somatic mutation of malignant transformation related genes |
| Annotation of somatic variants for genes involved in malignant transformation |
| Hugo Symbol | Variant Class | Variant Classification | dbSNP RS | HGVSc | HGVSp | HGVSp Short | SWISSPROT | BIOTYPE | SIFT | PolyPhen | Tumor Sample Barcode | Tissue | Histology | Sex | Age | Stage | Therapy Types | Drugs | Outcome |
| FCGBP | SNV | Missense_Mutation | novel | c.8945C>G | p.Ala2982Gly | p.A2982G | protein_coding | tolerated(0.1) | possibly_damaging(0.49) | TCGA-A2-A0D1-01 | Breast | breast invasive carcinoma | Female | >=65 | I/II | Chemotherapy | taxotere | SD | |
| FCGBP | SNV | Missense_Mutation | rs782437809 | c.4348N>A | p.Glu1450Lys | p.E1450K | protein_coding | tolerated(0.21) | probably_damaging(0.922) | TCGA-A7-A0CE-01 | Breast | breast invasive carcinoma | Female | <65 | I/II | Chemotherapy | adriamycin | SD | |
| FCGBP | SNV | Missense_Mutation | rs587653757 | c.4787C>T | p.Pro1596Leu | p.P1596L | protein_coding | tolerated(0.12) | benign(0.114) | TCGA-A8-A06Q-01 | Breast | breast invasive carcinoma | Female | <65 | III/IV | Unknown | Unknown | SD | |
| FCGBP | SNV | Missense_Mutation | novel | c.8924N>C | p.Val2975Ala | p.V2975A | protein_coding | deleterious(0) | benign(0.095) | TCGA-A8-A07R-01 | Breast | breast invasive carcinoma | Female | >=65 | III/IV | Ancillary | zoledronic | SD | |
| FCGBP | SNV | Missense_Mutation | novel | c.2009N>A | p.Gly670Asp | p.G670D | protein_coding | deleterious(0.03) | benign(0.169) | TCGA-A8-A095-01 | Breast | breast invasive carcinoma | Female | <65 | I/II | Chemotherapy | 5-fluorouracil | CR | |
| FCGBP | SNV | Missense_Mutation | rs371888217 | c.1732N>A | p.Val578Met | p.V578M | protein_coding | tolerated(0.07) | benign(0.28) | TCGA-A8-A09Z-01 | Breast | breast invasive carcinoma | Female | >=65 | I/II | Unknown | Unknown | SD | |
| FCGBP | SNV | Missense_Mutation | novel | c.6098N>T | p.Arg2033Leu | p.R2033L | protein_coding | tolerated(0.28) | possibly_damaging(0.668) | TCGA-A8-A0AD-01 | Breast | breast invasive carcinoma | Female | >=65 | I/II | Hormone Therapy | tamoxiphen | SD | |
| FCGBP | SNV | Missense_Mutation | novel | c.7611N>A | p.Met2537Ile | p.M2537I | protein_coding | tolerated(0.28) | benign(0.013) | TCGA-AC-A23H-01 | Breast | breast invasive carcinoma | Female | >=65 | I/II | Unknown | Unknown | PD | |
| FCGBP | SNV | Missense_Mutation | novel | c.2626G>C | p.Asp876His | p.D876H | protein_coding | deleterious(0) | probably_damaging(1) | TCGA-AC-A5XS-01 | Breast | breast invasive carcinoma | Female | >=65 | I/II | Hormone Therapy | femara | SD | |
| FCGBP | SNV | Missense_Mutation | novel | c.6017N>A | p.Gly2006Asp | p.G2006D | protein_coding | deleterious(0.01) | probably_damaging(0.925) | TCGA-AN-A0AK-01 | Breast | breast invasive carcinoma | Female | >=65 | I/II | Unknown | Unknown | SD |
| Page: 1 2 3 4 5 6 7 8 9 10 11 12 13 14 15 16 17 18 19 20 21 22 23 24 25 26 27 28 29 30 31 32 33 34 35 36 37 38 39 40 41 42 43 44 45 46 47 48 49 50 |
Top |
Related drugs of malignant transformation related genes |
| Identification of chemicals and drugs interact with genes involved in malignant transfromation |
| (DGIdb 4.0) |
| Entrez ID | Symbol | Category | Interaction Types | Drug Claim Name | Drug Name | PMIDs |
| Page: 1 |

Copyright 2023-Present -The University of Texas Health Science Center at Houston |