
|
|||||
|
 | |
| |
| |
| |
| |
| |
|
Gene: FCF1 |
Gene summary for FCF1 |
| Gene information | Species | Human | Gene symbol | FCF1 | Gene ID | 51077 |
| Gene name | FCF1 rRNA-processing protein | |
| Gene Alias | Bka | |
| Cytomap | 14q24.3 | |
| Gene Type | protein-coding | GO ID | GO:0006139 | UniProtAcc | G3V1S4 |
Top |
Malignant transformation analysis |
| Identification of the aberrant gene expression in precancerous and cancerous lesions by comparing the gene expression of stem-like cells in diseased tissues with normal stem cells |
| Entrez ID | Symbol | Replicates | Species | Organ | Tissue | Adj P-value | Log2FC | Malignancy |
| 51077 | FCF1 | LZE4T | Human | Esophagus | ESCC | 7.65e-09 | 1.43e-01 | 0.0811 |
| 51077 | FCF1 | LZE5T | Human | Esophagus | ESCC | 9.57e-06 | 3.00e-01 | 0.0514 |
| 51077 | FCF1 | LZE8T | Human | Esophagus | ESCC | 1.65e-03 | 3.22e-02 | 0.067 |
| 51077 | FCF1 | LZE20T | Human | Esophagus | ESCC | 2.22e-02 | 1.51e-01 | 0.0662 |
| 51077 | FCF1 | LZE22T | Human | Esophagus | ESCC | 1.05e-09 | 4.73e-01 | 0.068 |
| 51077 | FCF1 | LZE24T | Human | Esophagus | ESCC | 4.67e-08 | 1.63e-01 | 0.0596 |
| 51077 | FCF1 | LZE6T | Human | Esophagus | ESCC | 3.41e-04 | 1.15e-01 | 0.0845 |
| 51077 | FCF1 | P2T-E | Human | Esophagus | ESCC | 9.49e-14 | 1.64e-01 | 0.1177 |
| 51077 | FCF1 | P4T-E | Human | Esophagus | ESCC | 1.52e-16 | 3.26e-01 | 0.1323 |
| 51077 | FCF1 | P5T-E | Human | Esophagus | ESCC | 1.67e-14 | 2.19e-01 | 0.1327 |
| 51077 | FCF1 | P8T-E | Human | Esophagus | ESCC | 1.06e-20 | 3.14e-01 | 0.0889 |
| 51077 | FCF1 | P9T-E | Human | Esophagus | ESCC | 3.06e-08 | 5.31e-02 | 0.1131 |
| 51077 | FCF1 | P10T-E | Human | Esophagus | ESCC | 2.45e-20 | 3.13e-01 | 0.116 |
| 51077 | FCF1 | P11T-E | Human | Esophagus | ESCC | 1.18e-13 | 2.73e-01 | 0.1426 |
| 51077 | FCF1 | P12T-E | Human | Esophagus | ESCC | 2.15e-18 | 2.87e-01 | 0.1122 |
| 51077 | FCF1 | P15T-E | Human | Esophagus | ESCC | 1.20e-11 | 3.45e-01 | 0.1149 |
| 51077 | FCF1 | P16T-E | Human | Esophagus | ESCC | 4.10e-05 | 1.41e-01 | 0.1153 |
| 51077 | FCF1 | P17T-E | Human | Esophagus | ESCC | 3.49e-06 | 2.55e-01 | 0.1278 |
| 51077 | FCF1 | P19T-E | Human | Esophagus | ESCC | 1.04e-04 | 4.56e-01 | 0.1662 |
| 51077 | FCF1 | P20T-E | Human | Esophagus | ESCC | 1.84e-16 | 1.79e-01 | 0.1124 |
| Page: 1 2 3 4 5 |
| Tissue | Expression Dynamics | Abbreviation |
| Esophagus |  | ESCC: Esophageal squamous cell carcinoma |
| HGIN: High-grade intraepithelial neoplasias | ||
| LGIN: Low-grade intraepithelial neoplasias | ||
| Liver | 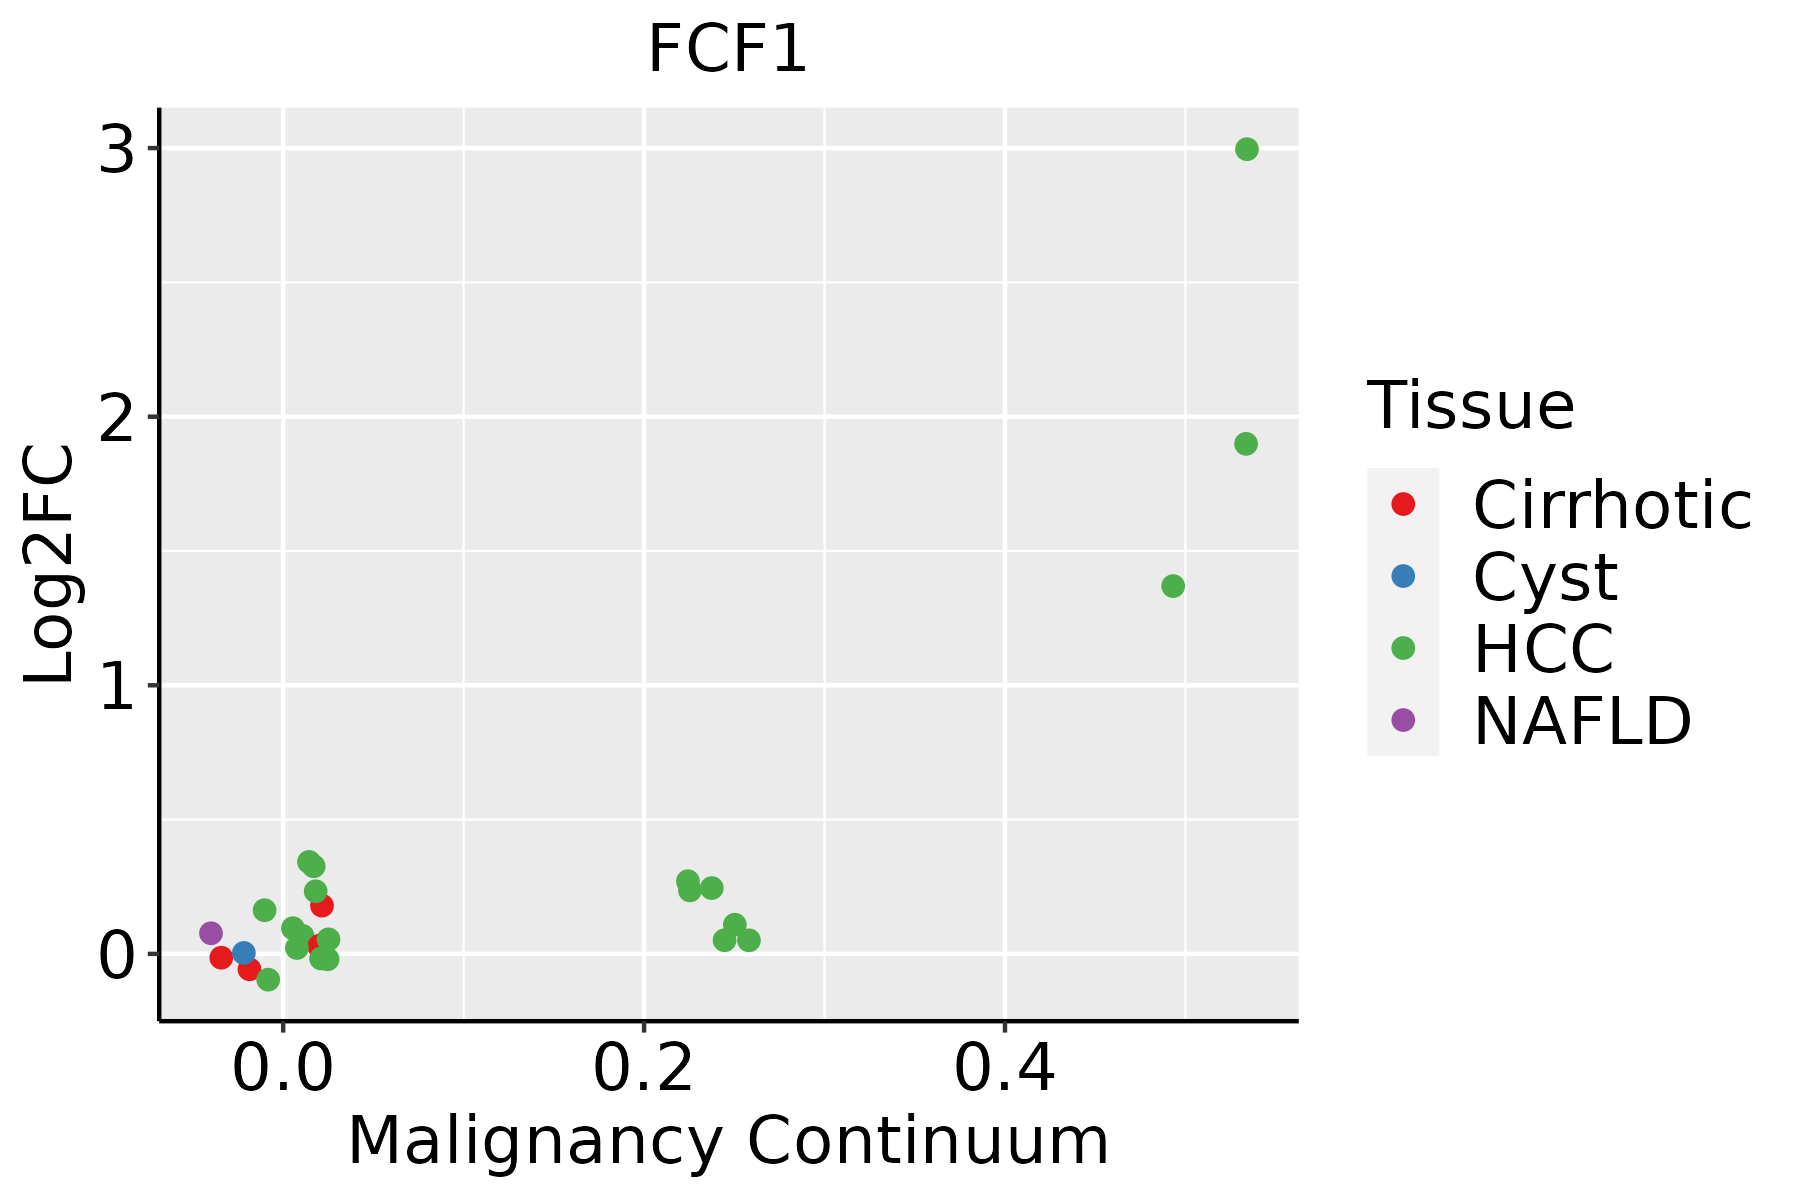 | HCC: Hepatocellular carcinoma |
| NAFLD: Non-alcoholic fatty liver disease | ||
| Skin | 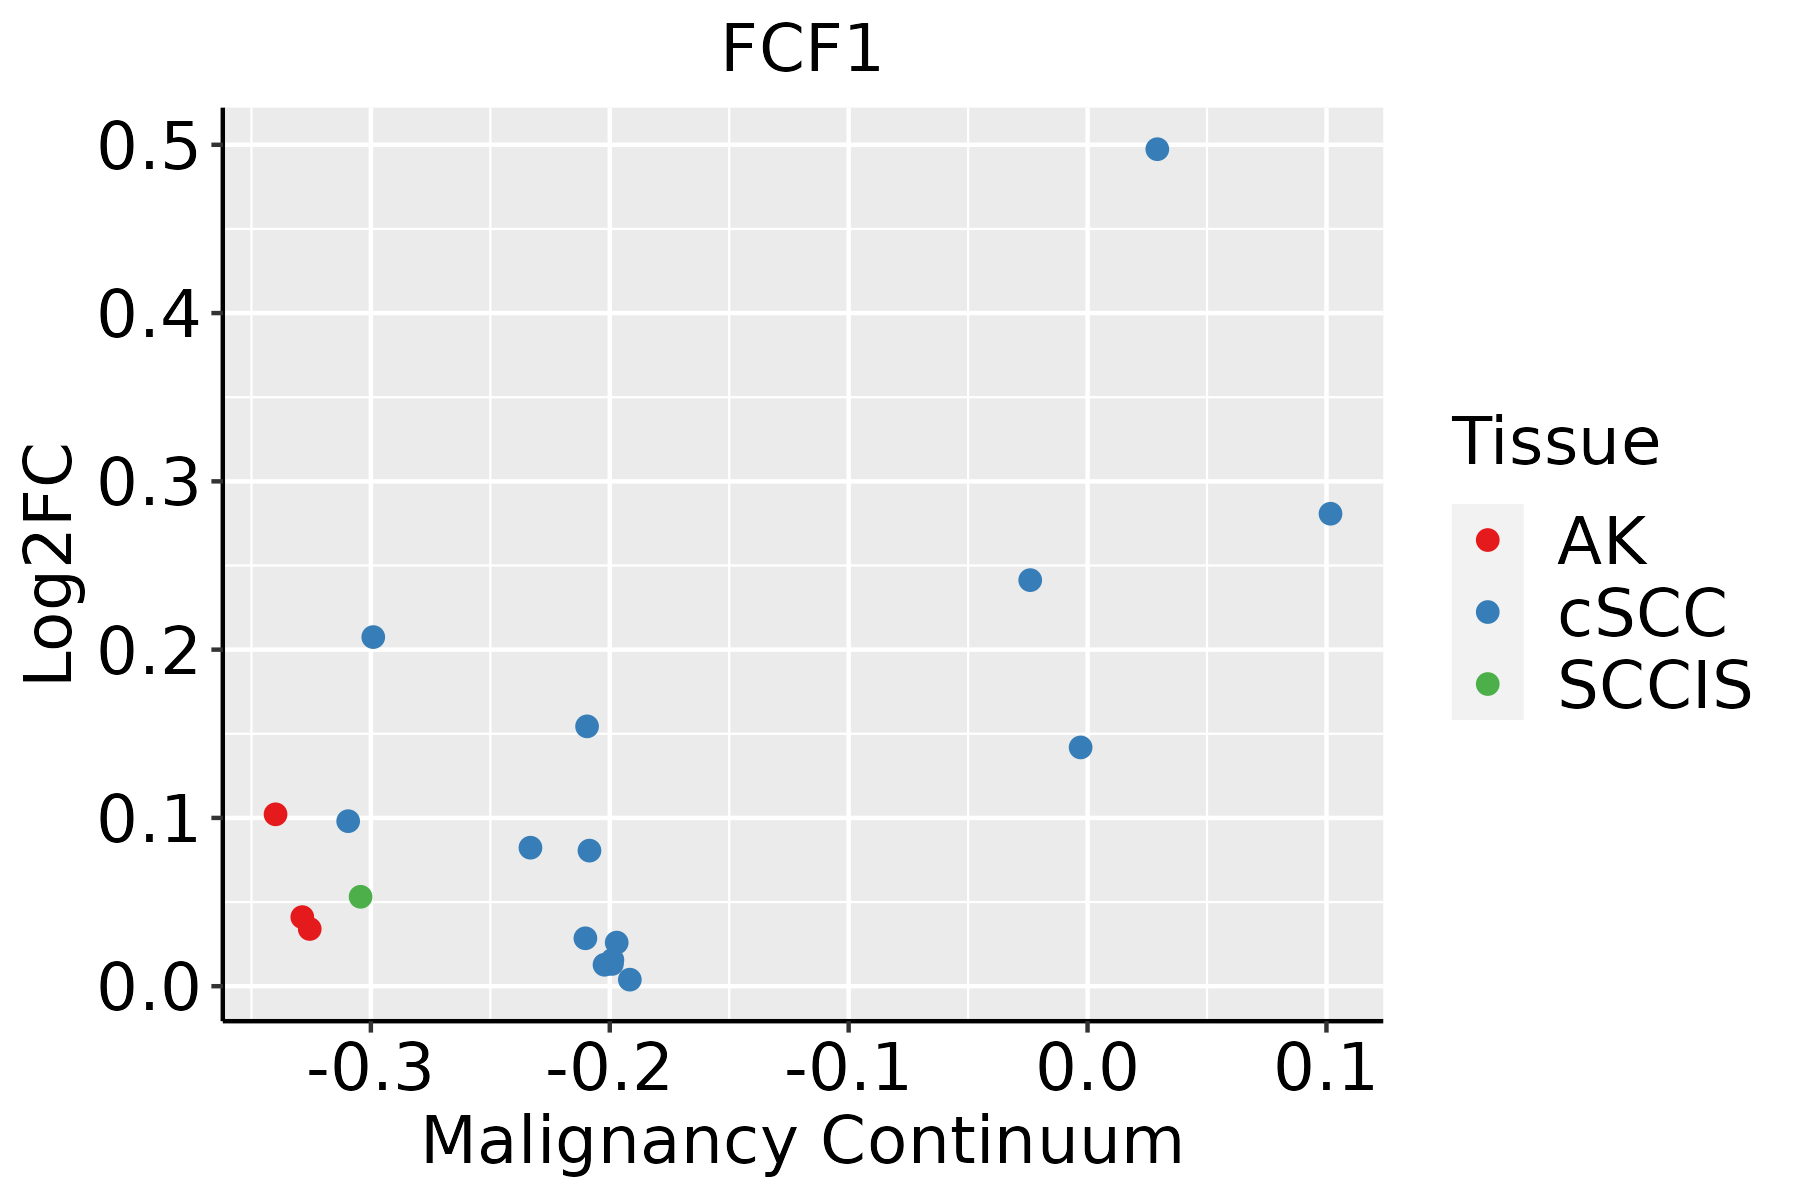 | AK: Actinic keratosis |
| cSCC: Cutaneous squamous cell carcinoma | ||
| SCCIS:squamous cell carcinoma in situ | ||
| Thyroid |  | ATC: Anaplastic thyroid cancer |
| HT: Hashimoto's thyroiditis | ||
| PTC: Papillary thyroid cancer |
| ∗log2FC in expression of this searched gene in stem-like cells from each diseased tissue sample relative to stem-like cells in normal samples in each tissue plotted against the malignancy continuum. Samples are colored based on if they are from different disease stage. |
Top |
Malignant transformation related pathway analysis |
| Find out the enriched GO biological processes and KEGG pathways involved in transition from healthy to precancer to cancer |
| Tissue | Disease Stage | Enriched GO biological Processes |
| Colorectum | AD |  |
| Colorectum | SER |  |
| Colorectum | MSS |  |
| Colorectum | MSI-H |  |
| Colorectum | FAP |  |
| ∗Top 15 enriched GO BP terms are showed in the bar plot of each disease state in each tissue. Each row represents a significant GO biological process which is colored according to the -log10(p.adjust). |
| Page: 1 2 3 4 5 6 7 8 9 |
| GO ID | Tissue | Disease Stage | Description | Gene Ratio | Bg Ratio | pvalue | p.adjust | Count |
| GO:0022613111 | Esophagus | ESCC | ribonucleoprotein complex biogenesis | 365/8552 | 463/18723 | 1.74e-49 | 1.11e-45 | 365 |
| GO:0042254111 | Esophagus | ESCC | ribosome biogenesis | 252/8552 | 299/18723 | 3.27e-44 | 1.04e-40 | 252 |
| GO:003447015 | Esophagus | ESCC | ncRNA processing | 300/8552 | 395/18723 | 3.09e-35 | 3.26e-32 | 300 |
| GO:0016072110 | Esophagus | ESCC | rRNA metabolic process | 197/8552 | 236/18723 | 1.31e-33 | 1.18e-30 | 197 |
| GO:0006364110 | Esophagus | ESCC | rRNA processing | 189/8552 | 225/18723 | 4.88e-33 | 3.87e-30 | 189 |
| GO:003466012 | Esophagus | ESCC | ncRNA metabolic process | 346/8552 | 485/18723 | 4.35e-31 | 2.51e-28 | 346 |
| GO:002261312 | Liver | Cirrhotic | ribonucleoprotein complex biogenesis | 231/4634 | 463/18723 | 3.28e-32 | 6.86e-29 | 231 |
| GO:004225412 | Liver | Cirrhotic | ribosome biogenesis | 154/4634 | 299/18723 | 1.18e-23 | 6.72e-21 | 154 |
| GO:000636412 | Liver | Cirrhotic | rRNA processing | 115/4634 | 225/18723 | 1.12e-17 | 1.64e-15 | 115 |
| GO:00160724 | Liver | Cirrhotic | rRNA metabolic process | 119/4634 | 236/18723 | 1.19e-17 | 1.70e-15 | 119 |
| GO:00344701 | Liver | Cirrhotic | ncRNA processing | 158/4634 | 395/18723 | 1.09e-11 | 6.96e-10 | 158 |
| GO:00346603 | Liver | Cirrhotic | ncRNA metabolic process | 173/4634 | 485/18723 | 3.64e-08 | 1.21e-06 | 173 |
| GO:002261322 | Liver | HCC | ribonucleoprotein complex biogenesis | 355/7958 | 463/18723 | 7.76e-52 | 4.92e-48 | 355 |
| GO:004225422 | Liver | HCC | ribosome biogenesis | 246/7958 | 299/18723 | 4.99e-46 | 1.58e-42 | 246 |
| GO:00344702 | Liver | HCC | ncRNA processing | 293/7958 | 395/18723 | 4.26e-38 | 6.76e-35 | 293 |
| GO:001607212 | Liver | HCC | rRNA metabolic process | 193/7958 | 236/18723 | 1.26e-35 | 1.14e-32 | 193 |
| GO:000636421 | Liver | HCC | rRNA processing | 185/7958 | 225/18723 | 8.14e-35 | 6.45e-32 | 185 |
| GO:00346601 | Liver | HCC | ncRNA metabolic process | 332/7958 | 485/18723 | 1.48e-31 | 7.80e-29 | 332 |
| GO:002261329 | Skin | cSCC | ribonucleoprotein complex biogenesis | 302/4864 | 463/18723 | 5.13e-72 | 3.22e-68 | 302 |
| GO:004225428 | Skin | cSCC | ribosome biogenesis | 206/4864 | 299/18723 | 3.33e-55 | 1.04e-51 | 206 |
| Page: 1 2 |
| Pathway ID | Tissue | Disease Stage | Description | Gene Ratio | Bg Ratio | pvalue | p.adjust | qvalue | Count |
| Page: 1 |
Top |
Cell-cell communication analysis |
| Identification of potential cell-cell interactions between two cell types and their ligand-receptor pairs for different disease states |
| Ligand | Receptor | LRpair | Pathway | Tissue | Disease Stage |
| Page: 1 |
Top |
Single-cell gene regulatory network inference analysis |
| Find out the significant the regulons (TFs) and the target genes of each regulon across cell types for different disease states |
| TF | Cell Type | Tissue | Disease Stage | Target Gene | RSS | Regulon Activity |
| ∗The dot plots of a searched regulon are shown for all cell subpopulations in each disease state of each tissue based on the regulon specific score inferred using pySCENIC and by calculating the average expression. |
| Page: 1 |
Top |
Somatic mutation of malignant transformation related genes |
| Annotation of somatic variants for genes involved in malignant transformation |
| Hugo Symbol | Variant Class | Variant Classification | dbSNP RS | HGVSc | HGVSp | HGVSp Short | SWISSPROT | BIOTYPE | SIFT | PolyPhen | Tumor Sample Barcode | Tissue | Histology | Sex | Age | Stage | Therapy Types | Drugs | Outcome |
| FCF1 | SNV | Missense_Mutation | c.455A>G | p.His152Arg | p.H152R | Q9Y324 | protein_coding | deleterious(0) | possibly_damaging(0.616) | TCGA-AR-A0TZ-01 | Breast | breast invasive carcinoma | Female | <65 | III/IV | Unspecific | Doxorubicin | PD | |
| FCF1 | SNV | Missense_Mutation | novel | c.115G>C | p.Asp39His | p.D39H | Q9Y324 | protein_coding | deleterious(0.01) | benign(0.009) | TCGA-GM-A2D9-01 | Breast | breast invasive carcinoma | Female | >=65 | I/II | Hormone Therapy | arimidex | SD |
| FCF1 | SNV | Missense_Mutation | rs771901257 | c.139N>A | p.Glu47Lys | p.E47K | Q9Y324 | protein_coding | tolerated(0.08) | benign(0.066) | TCGA-B5-A11R-01 | Endometrium | uterine corpus endometrioid carcinoma | Female | <65 | I/II | Chemotherapy | paclitaxel | SD |
| FCF1 | SNV | Missense_Mutation | c.15N>T | p.Lys5Asn | p.K5N | Q9Y324 | protein_coding | deleterious(0.04) | benign(0.125) | TCGA-BS-A0UV-01 | Endometrium | uterine corpus endometrioid carcinoma | Female | <65 | III/IV | Unknown | Unknown | SD | |
| FCF1 | SNV | Missense_Mutation | novel | c.378N>G | p.Asp126Glu | p.D126E | Q9Y324 | protein_coding | deleterious(0) | probably_damaging(0.995) | TCGA-DF-A2KN-01 | Endometrium | uterine corpus endometrioid carcinoma | Female | Unknown | I/II | Unknown | Unknown | SD |
| FCF1 | SNV | Missense_Mutation | novel | c.251N>C | p.Leu84Pro | p.L84P | Q9Y324 | protein_coding | deleterious(0) | probably_damaging(0.928) | TCGA-DI-A1BU-01 | Endometrium | uterine corpus endometrioid carcinoma | Female | <65 | I/II | Chemotherapy | paclitaxel | SD |
| FCF1 | SNV | Missense_Mutation | rs142533630 | c.485N>A | p.Arg162Gln | p.R162Q | Q9Y324 | protein_coding | tolerated(0.13) | benign(0.011) | TCGA-EC-A24G-01 | Endometrium | uterine corpus endometrioid carcinoma | Female | <65 | I/II | Chemotherapy | doxorubicin | SD |
| FCF1 | SNV | Missense_Mutation | novel | c.119N>T | p.Pro40Leu | p.P40L | Q9Y324 | protein_coding | tolerated(0.12) | benign(0) | TCGA-EO-A22U-01 | Endometrium | uterine corpus endometrioid carcinoma | Female | >=65 | I/II | Unknown | Unknown | SD |
| FCF1 | SNV | Missense_Mutation | novel | c.245N>T | p.Ala82Val | p.A82V | Q9Y324 | protein_coding | tolerated(0.11) | benign(0.04) | TCGA-FI-A2D0-01 | Endometrium | uterine corpus endometrioid carcinoma | Female | <65 | I/II | Unknown | Unknown | SD |
| FCF1 | SNV | Missense_Mutation | novel | c.111N>T | p.Lys37Asn | p.K37N | Q9Y324 | protein_coding | tolerated(0.1) | benign(0.018) | TCGA-44-2656-01 | Lung | lung adenocarcinoma | Male | <65 | I/II | Unknown | Unknown | PD |
| Page: 1 2 |
Top |
Related drugs of malignant transformation related genes |
| Identification of chemicals and drugs interact with genes involved in malignant transfromation |
| (DGIdb 4.0) |
| Entrez ID | Symbol | Category | Interaction Types | Drug Claim Name | Drug Name | PMIDs |
| Page: 1 |

Copyright 2023-Present -The University of Texas Health Science Center at Houston |