
|
|||||
|
 | |
| |
| |
| |
| |
| |
|
Gene: FBXW5 |
Gene summary for FBXW5 |
| Gene information | Species | Human | Gene symbol | FBXW5 | Gene ID | 54461 |
| Gene name | F-box and WD repeat domain containing 5 | |
| Gene Alias | Fbw5 | |
| Cytomap | 9q34.3 | |
| Gene Type | protein-coding | GO ID | GO:0000226 | UniProtAcc | A0A024R8H7 |
Top |
Malignant transformation analysis |
| Identification of the aberrant gene expression in precancerous and cancerous lesions by comparing the gene expression of stem-like cells in diseased tissues with normal stem cells |
| Entrez ID | Symbol | Replicates | Species | Organ | Tissue | Adj P-value | Log2FC | Malignancy |
| 54461 | FBXW5 | HTA11_2487_2000001011 | Human | Colorectum | SER | 8.22e-04 | 3.01e-01 | -0.1808 |
| 54461 | FBXW5 | HTA11_347_2000001011 | Human | Colorectum | AD | 2.78e-05 | 2.03e-01 | -0.1954 |
| 54461 | FBXW5 | HTA11_2112_2000001011 | Human | Colorectum | SER | 1.34e-05 | 6.56e-01 | -0.2196 |
| 54461 | FBXW5 | HTA11_83_2000001011 | Human | Colorectum | SER | 1.00e-03 | 2.03e-01 | -0.1526 |
| 54461 | FBXW5 | HTA11_696_2000001011 | Human | Colorectum | AD | 1.58e-03 | 1.87e-01 | -0.1464 |
| 54461 | FBXW5 | HTA11_1391_2000001011 | Human | Colorectum | AD | 1.98e-03 | 2.69e-01 | -0.059 |
| 54461 | FBXW5 | HTA11_10623_2000001011 | Human | Colorectum | AD | 6.70e-05 | 4.02e-01 | -0.0177 |
| 54461 | FBXW5 | HTA11_7696_3000711011 | Human | Colorectum | AD | 2.79e-03 | 1.01e-01 | 0.0674 |
| 54461 | FBXW5 | A015-C-203 | Human | Colorectum | FAP | 6.44e-04 | 2.67e-01 | -0.1294 |
| 54461 | FBXW5 | LZE3D | Human | Esophagus | HGIN | 4.79e-02 | 6.69e-01 | 0.0668 |
| 54461 | FBXW5 | LZE4T | Human | Esophagus | ESCC | 9.86e-06 | 1.45e-01 | 0.0811 |
| 54461 | FBXW5 | LZE5T | Human | Esophagus | ESCC | 1.53e-02 | 1.83e-01 | 0.0514 |
| 54461 | FBXW5 | LZE7T | Human | Esophagus | ESCC | 1.37e-03 | 2.04e-01 | 0.0667 |
| 54461 | FBXW5 | LZE8T | Human | Esophagus | ESCC | 2.42e-13 | 4.63e-01 | 0.067 |
| 54461 | FBXW5 | LZE20T | Human | Esophagus | ESCC | 6.53e-13 | 5.69e-01 | 0.0662 |
| 54461 | FBXW5 | LZE22T | Human | Esophagus | ESCC | 1.49e-06 | 3.44e-01 | 0.068 |
| 54461 | FBXW5 | LZE24T | Human | Esophagus | ESCC | 1.41e-20 | 6.11e-01 | 0.0596 |
| 54461 | FBXW5 | LZE21T | Human | Esophagus | ESCC | 1.90e-09 | 5.43e-01 | 0.0655 |
| 54461 | FBXW5 | LZE6T | Human | Esophagus | ESCC | 6.18e-05 | 3.54e-01 | 0.0845 |
| 54461 | FBXW5 | P1T-E | Human | Esophagus | ESCC | 5.04e-21 | 7.04e-01 | 0.0875 |
| Page: 1 2 3 4 5 6 7 8 |
| Tissue | Expression Dynamics | Abbreviation |
| Colorectum (GSE201348) |  | FAP: Familial adenomatous polyposis |
| CRC: Colorectal cancer | ||
| Colorectum (HTA11) |  | AD: Adenomas |
| SER: Sessile serrated lesions | ||
| MSI-H: Microsatellite-high colorectal cancer | ||
| MSS: Microsatellite stable colorectal cancer | ||
| Esophagus | 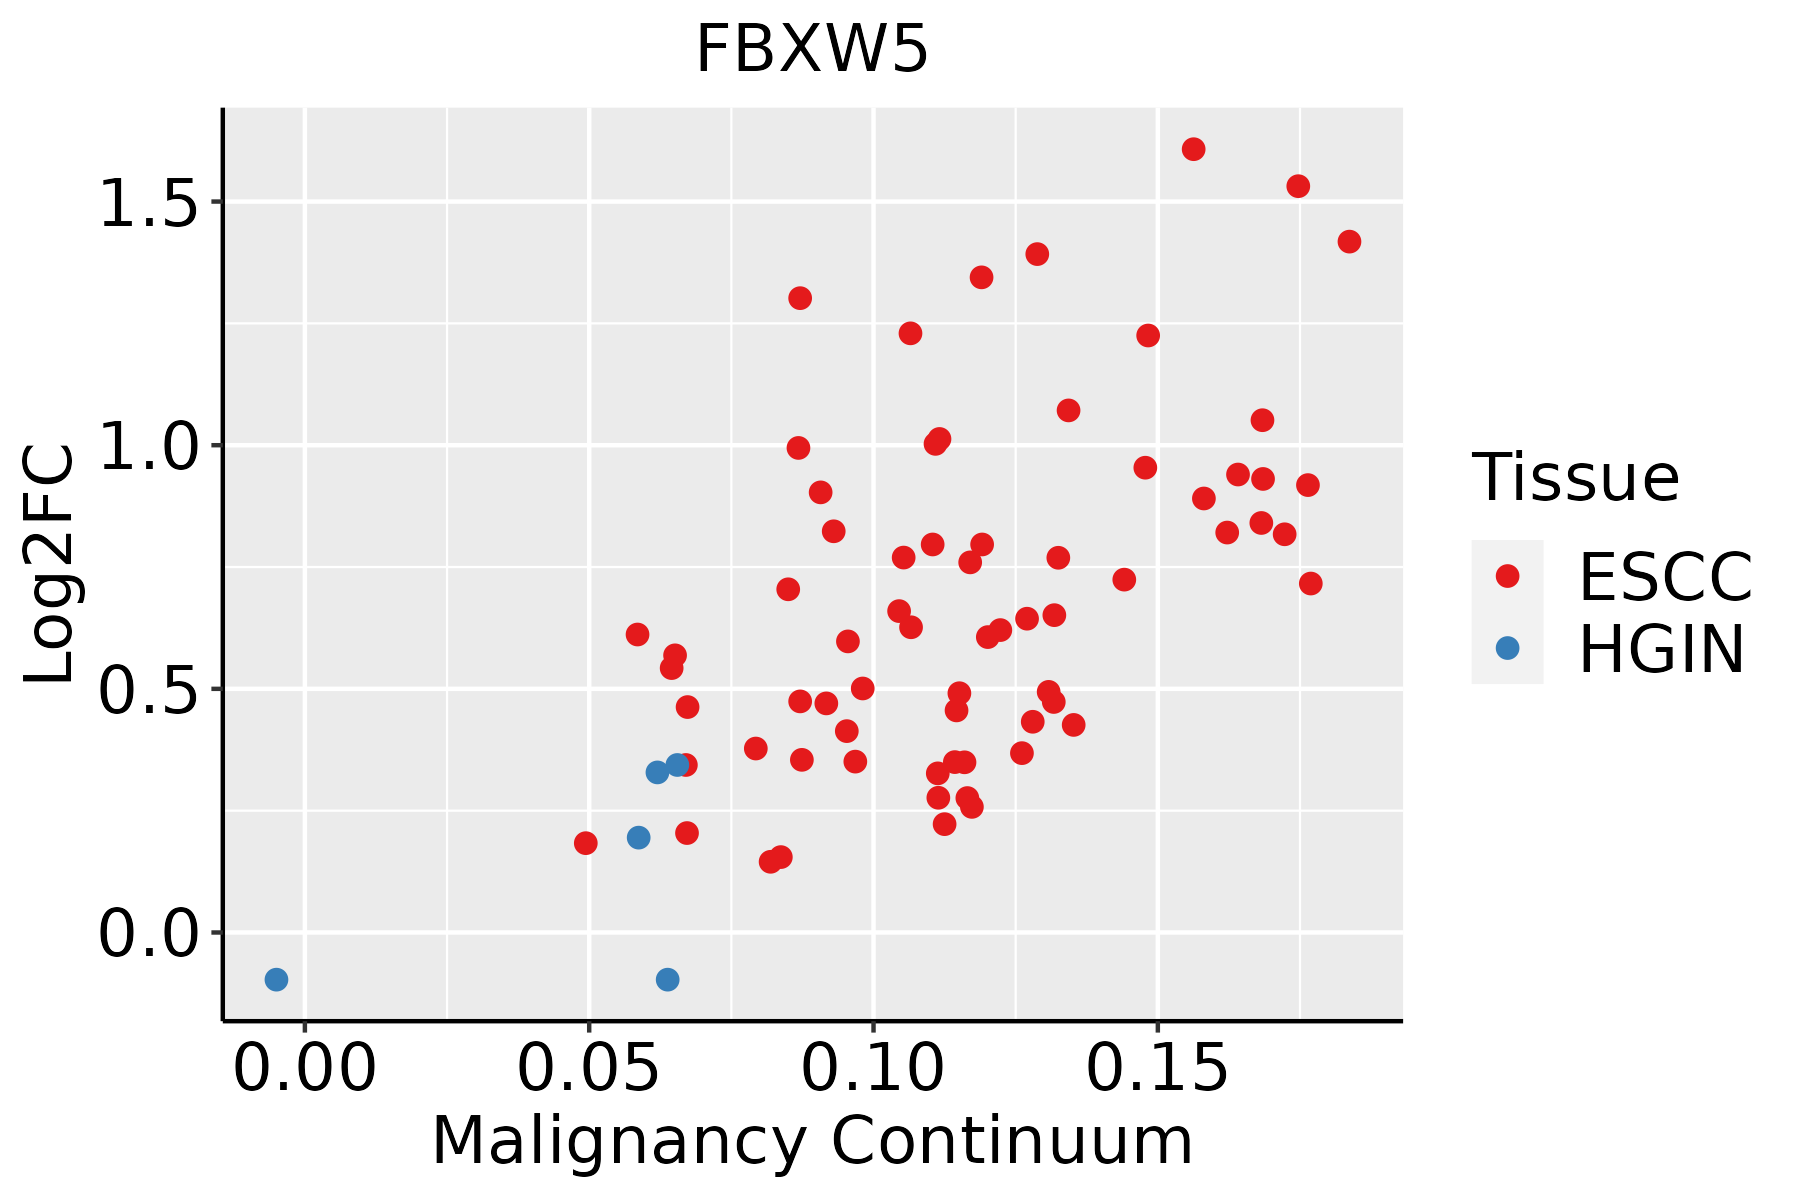 | ESCC: Esophageal squamous cell carcinoma |
| HGIN: High-grade intraepithelial neoplasias | ||
| LGIN: Low-grade intraepithelial neoplasias | ||
| GC |  | CAG: Chronic atrophic gastritis |
| CAG with IM: Chronic atrophic gastritis with intestinal metaplasia | ||
| CSG: Chronic superficial gastritis | ||
| GC: Gastric cancer | ||
| SIM: Severe intestinal metaplasia | ||
| WIM: Wild intestinal metaplasia | ||
| Liver | 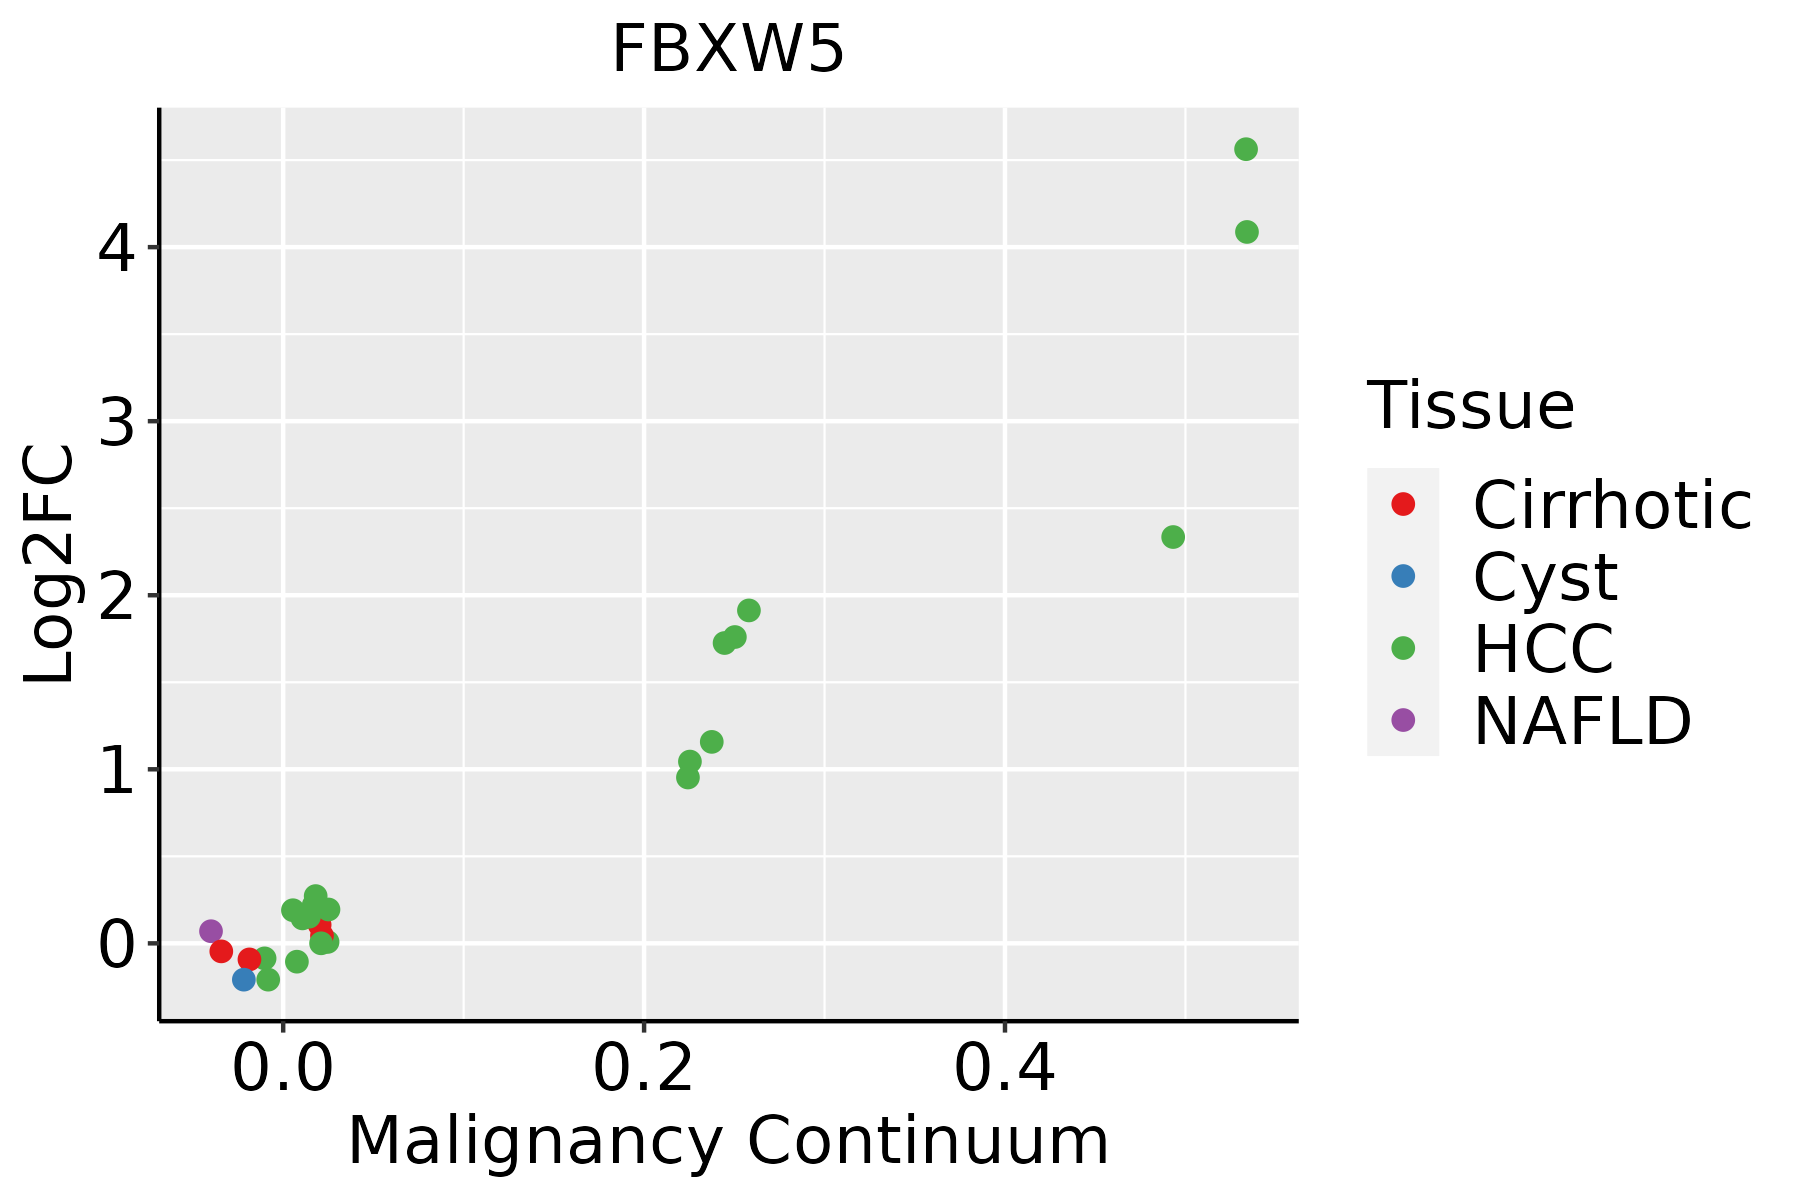 | HCC: Hepatocellular carcinoma |
| NAFLD: Non-alcoholic fatty liver disease | ||
| Oral Cavity | 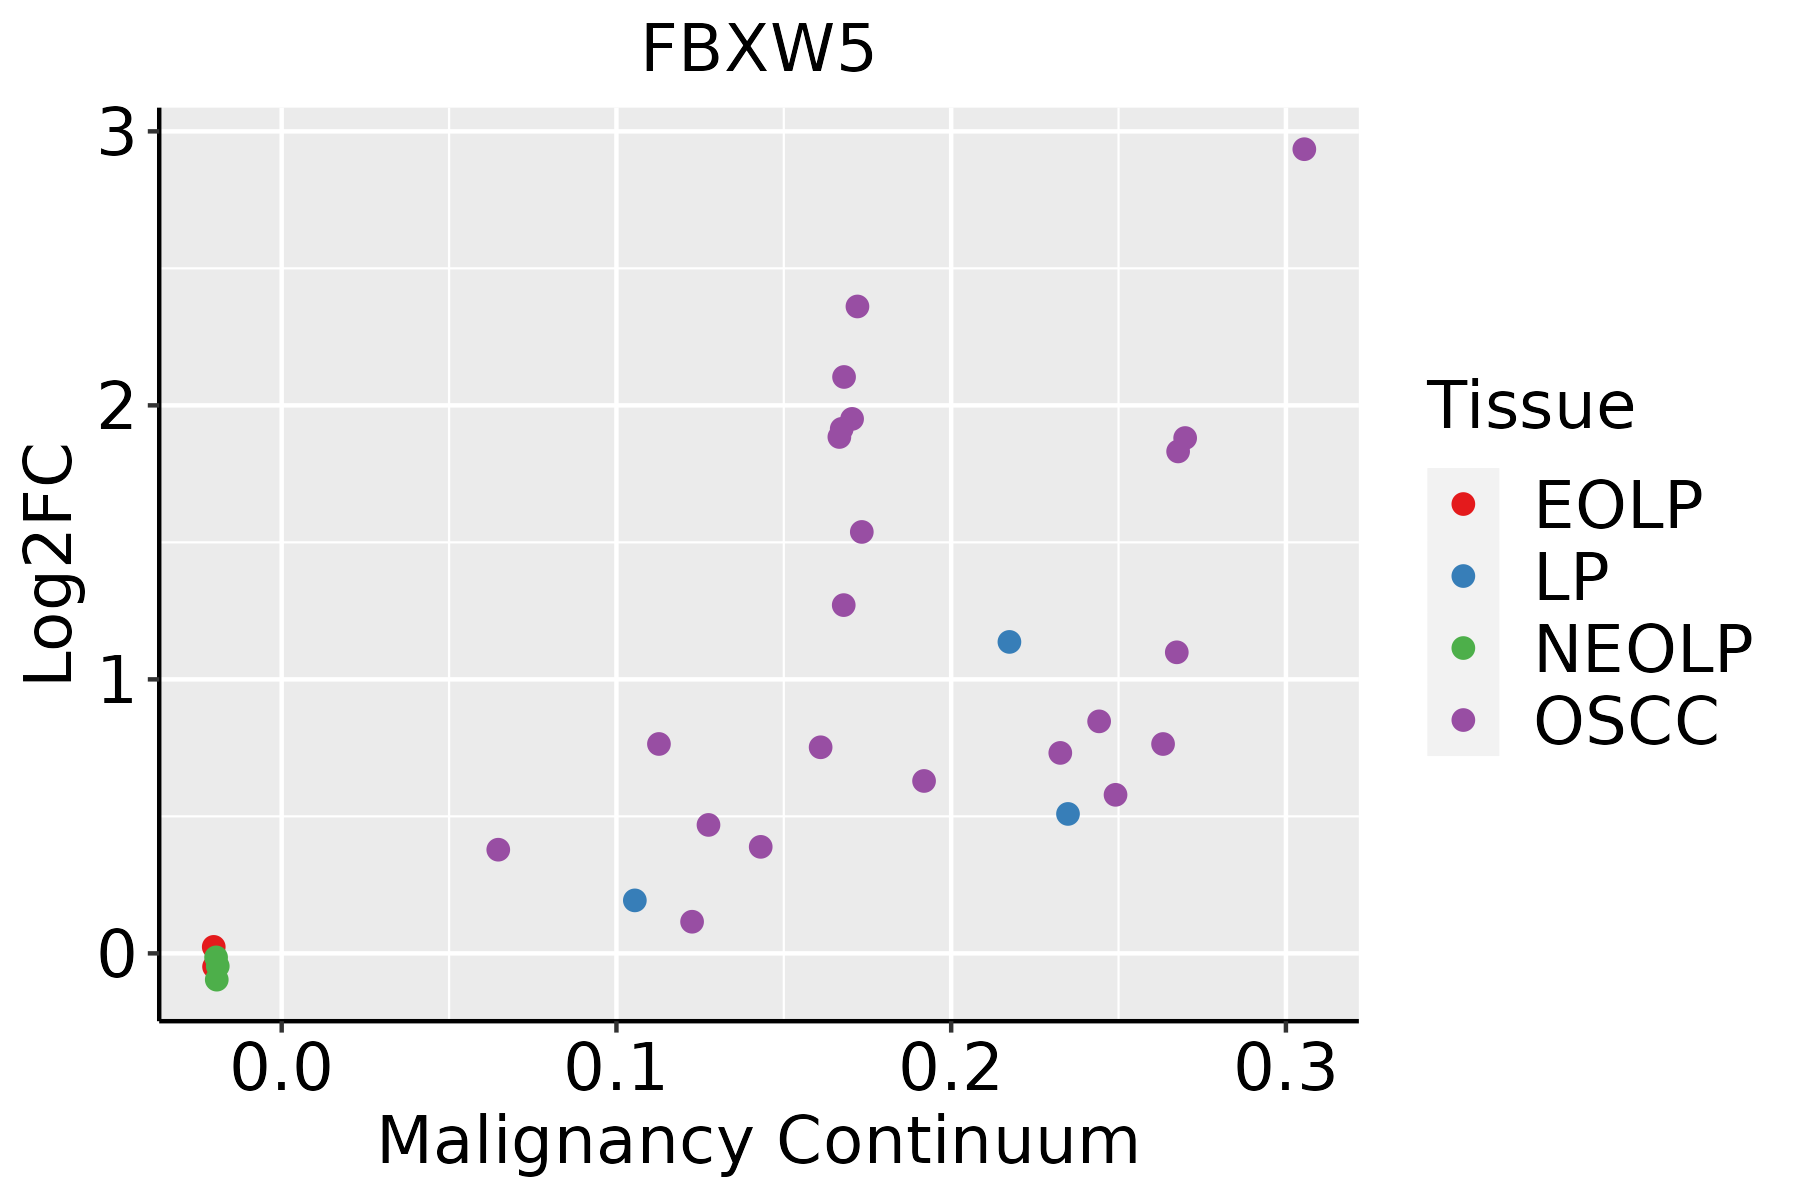 | EOLP: Erosive Oral lichen planus |
| LP: leukoplakia | ||
| NEOLP: Non-erosive oral lichen planus | ||
| OSCC: Oral squamous cell carcinoma | ||
| Prostate | 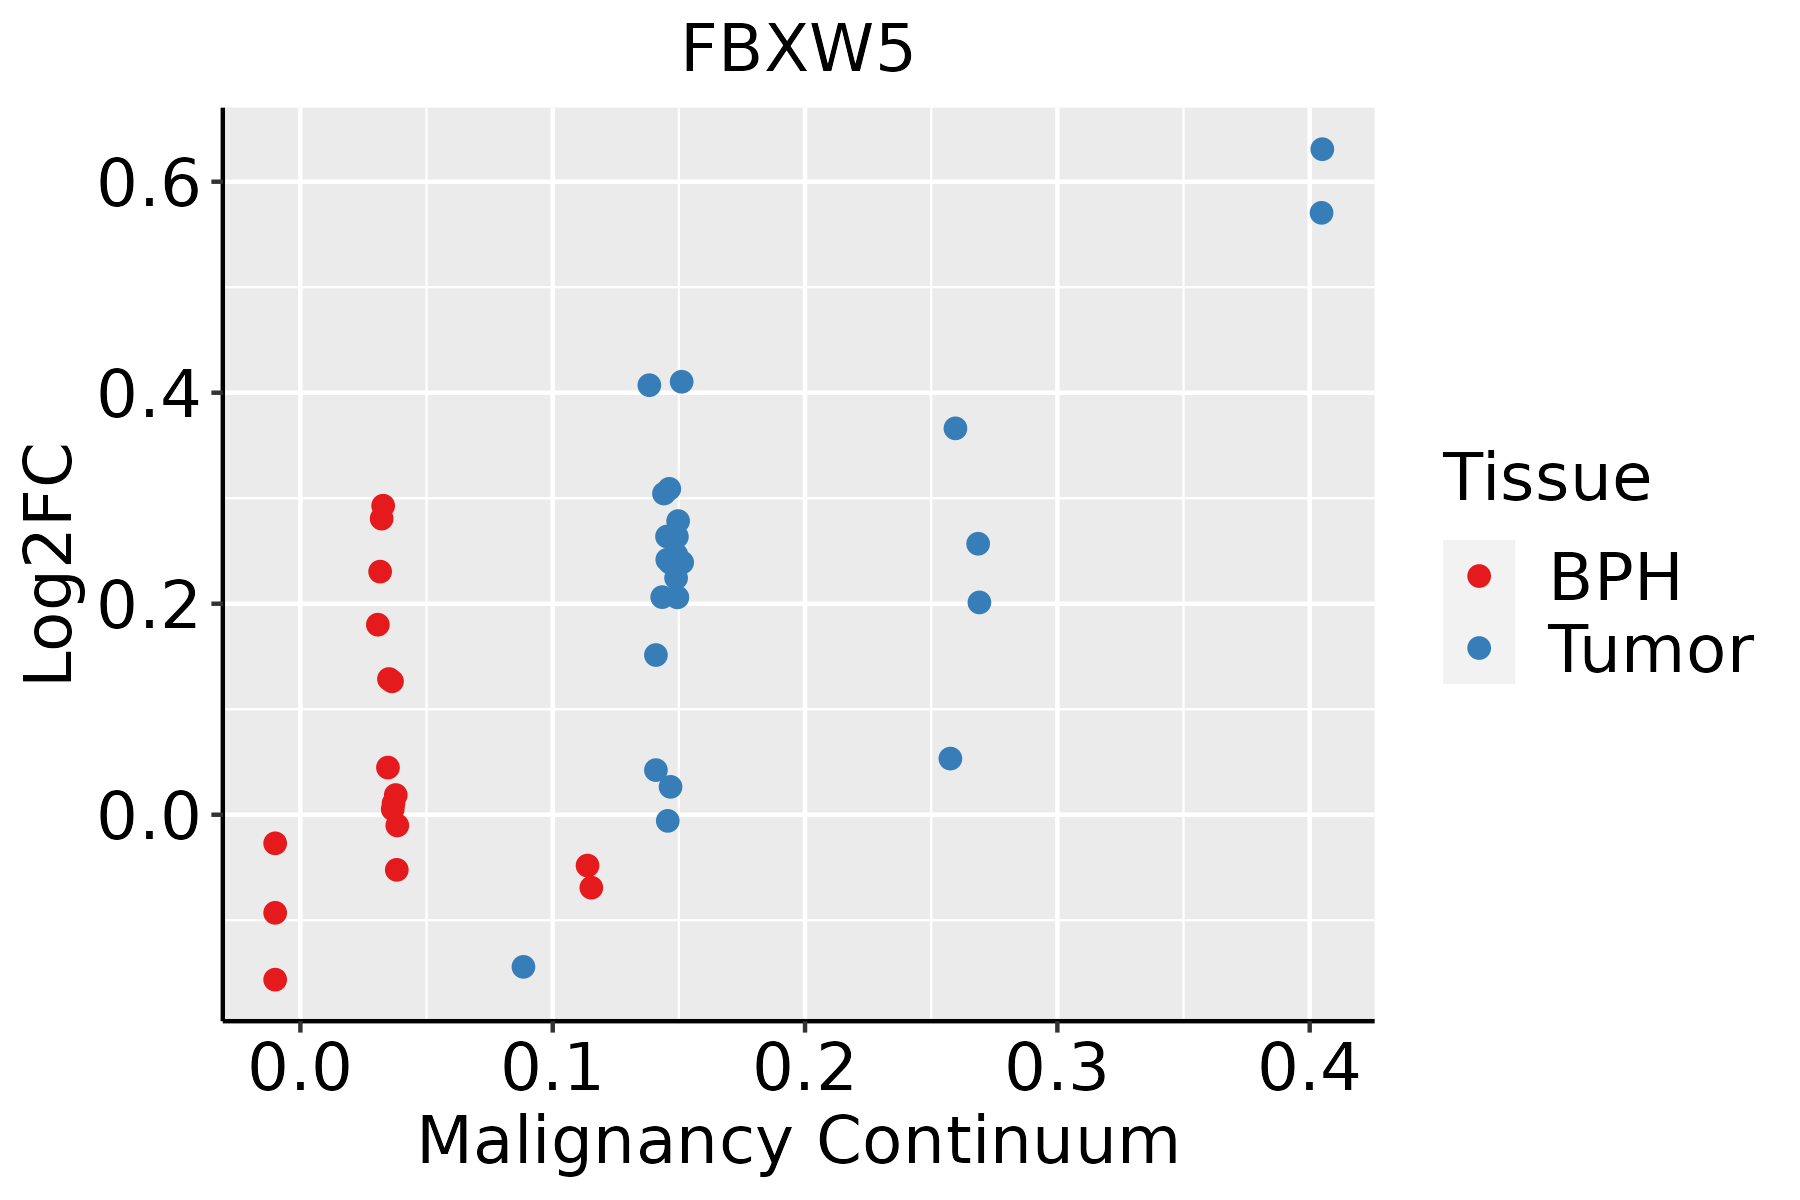 | BPH: Benign Prostatic Hyperplasia |
| Skin | 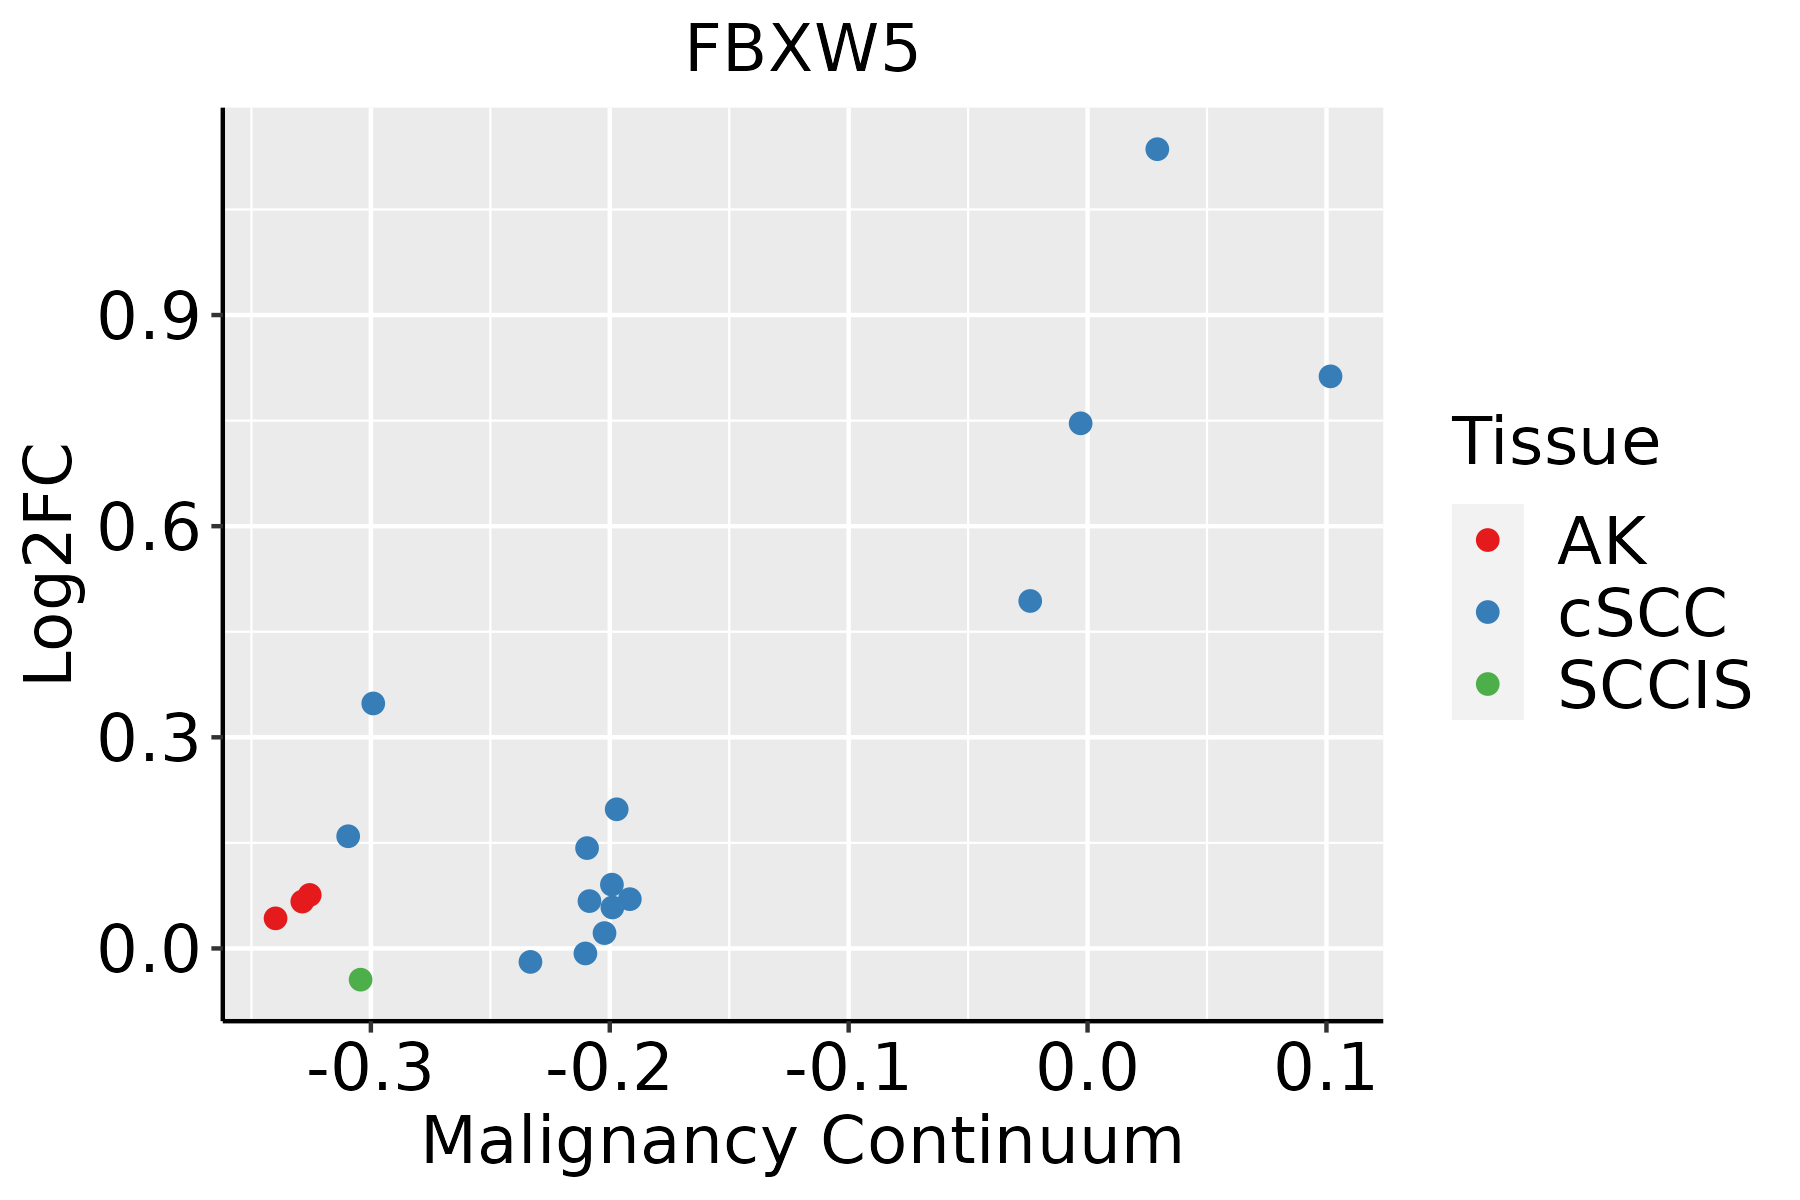 | AK: Actinic keratosis |
| cSCC: Cutaneous squamous cell carcinoma | ||
| SCCIS:squamous cell carcinoma in situ | ||
| Thyroid | 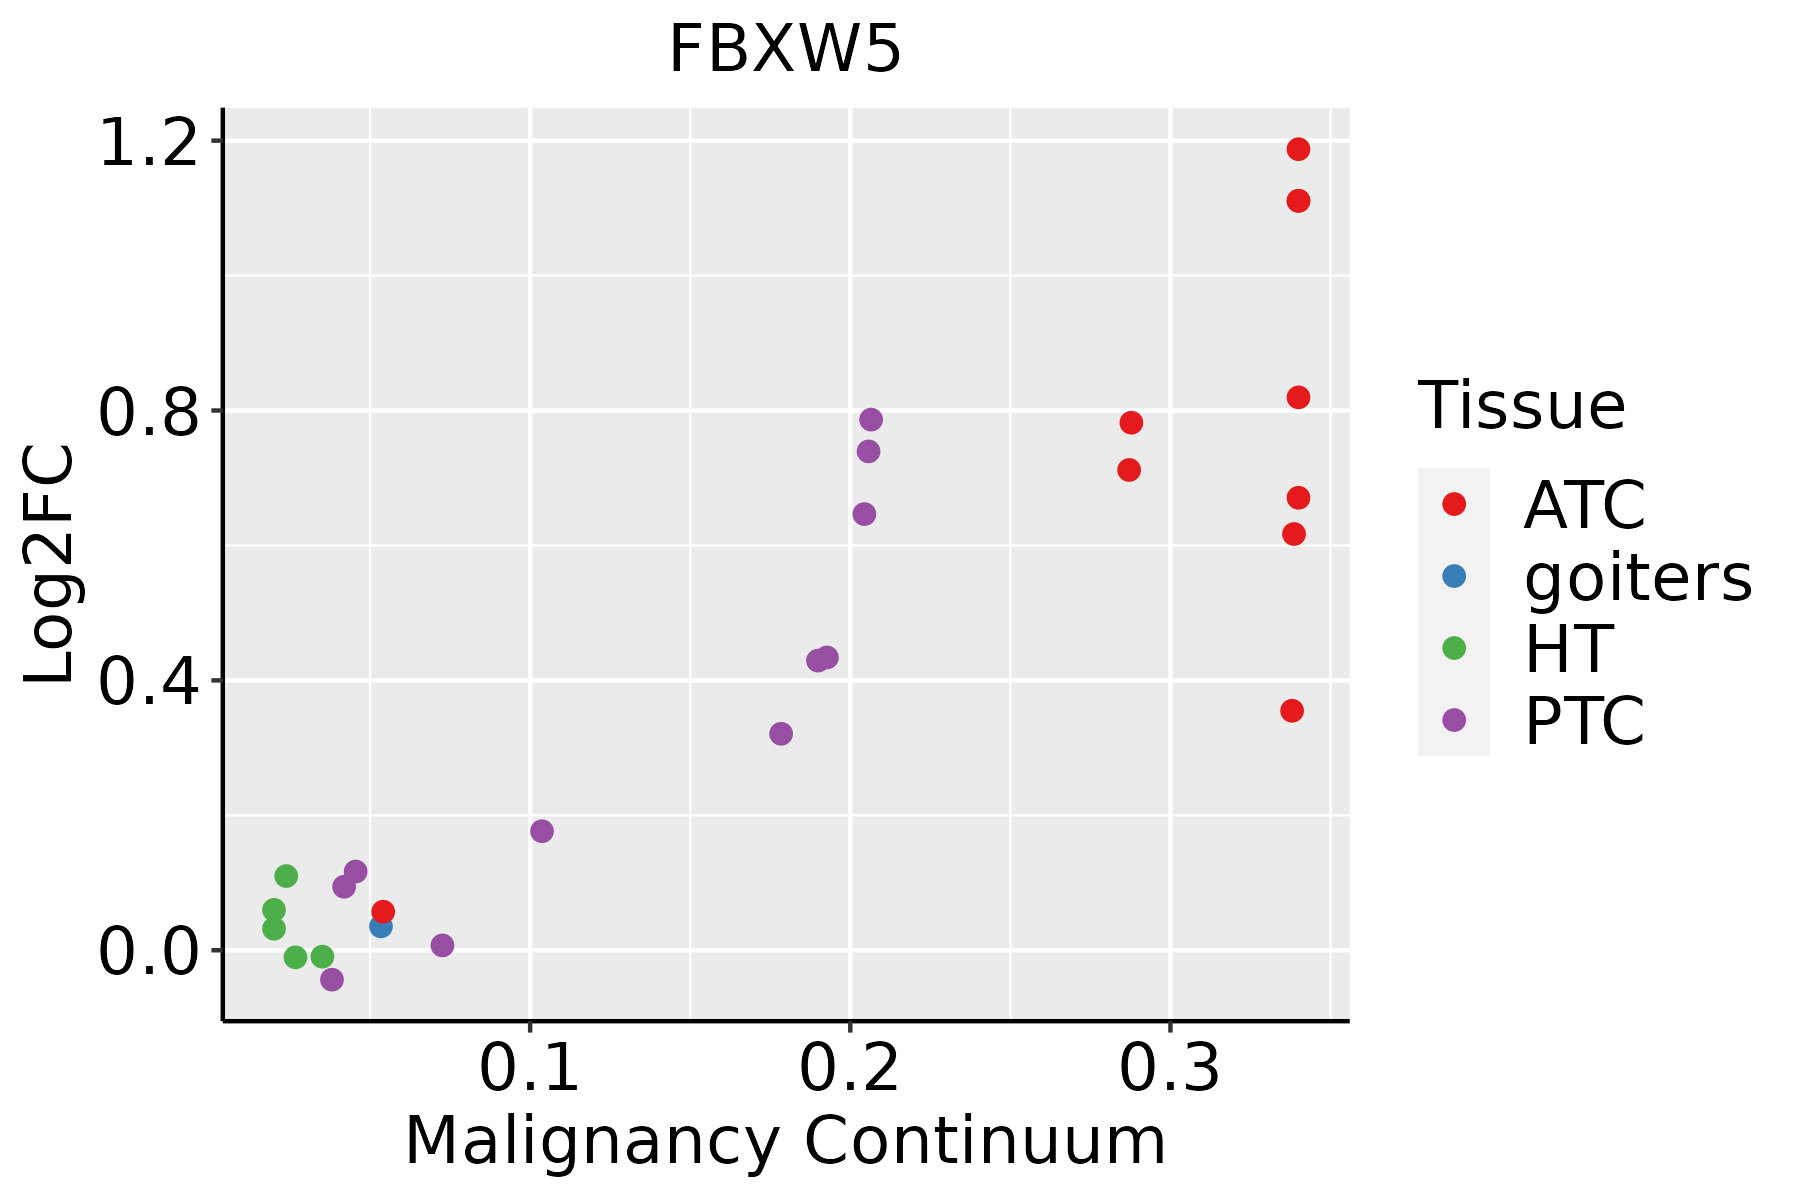 | ATC: Anaplastic thyroid cancer |
| HT: Hashimoto's thyroiditis | ||
| PTC: Papillary thyroid cancer |
| ∗log2FC in expression of this searched gene in stem-like cells from each diseased tissue sample relative to stem-like cells in normal samples in each tissue plotted against the malignancy continuum. Samples are colored based on if they are from different disease stage. |
Top |
Malignant transformation related pathway analysis |
| Find out the enriched GO biological processes and KEGG pathways involved in transition from healthy to precancer to cancer |
| Tissue | Disease Stage | Enriched GO biological Processes |
| Colorectum | AD |  |
| Colorectum | SER |  |
| Colorectum | MSS |  |
| Colorectum | MSI-H |  |
| Colorectum | FAP |  |
| ∗Top 15 enriched GO BP terms are showed in the bar plot of each disease state in each tissue. Each row represents a significant GO biological process which is colored according to the -log10(p.adjust). |
| Page: 1 2 3 4 5 6 7 8 9 |
| GO ID | Tissue | Disease Stage | Description | Gene Ratio | Bg Ratio | pvalue | p.adjust | Count |
| GO:0010498 | Colorectum | AD | proteasomal protein catabolic process | 174/3918 | 490/18723 | 3.18e-14 | 7.66e-12 | 174 |
| GO:0043161 | Colorectum | AD | proteasome-mediated ubiquitin-dependent protein catabolic process | 141/3918 | 412/18723 | 1.77e-10 | 1.68e-08 | 141 |
| GO:0007346 | Colorectum | AD | regulation of mitotic cell cycle | 119/3918 | 457/18723 | 4.60e-03 | 3.14e-02 | 119 |
| GO:0140014 | Colorectum | AD | mitotic nuclear division | 78/3918 | 287/18723 | 6.48e-03 | 4.05e-02 | 78 |
| GO:0046605 | Colorectum | AD | regulation of centrosome cycle | 18/3918 | 49/18723 | 7.93e-03 | 4.73e-02 | 18 |
| GO:00104981 | Colorectum | SER | proteasomal protein catabolic process | 132/2897 | 490/18723 | 3.08e-11 | 5.55e-09 | 132 |
| GO:00431611 | Colorectum | SER | proteasome-mediated ubiquitin-dependent protein catabolic process | 105/2897 | 412/18723 | 7.48e-08 | 4.70e-06 | 105 |
| GO:00466051 | Colorectum | SER | regulation of centrosome cycle | 17/2897 | 49/18723 | 7.17e-04 | 9.44e-03 | 17 |
| GO:0010824 | Colorectum | SER | regulation of centrosome duplication | 15/2897 | 45/18723 | 2.29e-03 | 2.19e-02 | 15 |
| GO:00431614 | Colorectum | FAP | proteasome-mediated ubiquitin-dependent protein catabolic process | 98/2622 | 412/18723 | 5.41e-08 | 4.20e-06 | 98 |
| GO:00104984 | Colorectum | FAP | proteasomal protein catabolic process | 110/2622 | 490/18723 | 2.12e-07 | 1.26e-05 | 110 |
| GO:00073462 | Colorectum | FAP | regulation of mitotic cell cycle | 85/2622 | 457/18723 | 3.41e-03 | 2.48e-02 | 85 |
| GO:0010498111 | Esophagus | ESCC | proteasomal protein catabolic process | 369/8552 | 490/18723 | 1.13e-41 | 1.80e-38 | 369 |
| GO:0043161111 | Esophagus | ESCC | proteasome-mediated ubiquitin-dependent protein catabolic process | 312/8552 | 412/18723 | 3.53e-36 | 4.48e-33 | 312 |
| GO:014001414 | Esophagus | ESCC | mitotic nuclear division | 218/8552 | 287/18723 | 6.17e-26 | 1.78e-23 | 218 |
| GO:000734615 | Esophagus | ESCC | regulation of mitotic cell cycle | 293/8552 | 457/18723 | 8.00e-16 | 5.64e-14 | 293 |
| GO:00482853 | Esophagus | ESCC | organelle fission | 301/8552 | 488/18723 | 4.64e-13 | 2.12e-11 | 301 |
| GO:00002802 | Esophagus | ESCC | nuclear division | 270/8552 | 439/18723 | 1.17e-11 | 4.24e-10 | 270 |
| GO:00070883 | Esophagus | ESCC | regulation of mitotic nuclear division | 78/8552 | 110/18723 | 6.96e-08 | 1.21e-06 | 78 |
| GO:00517831 | Esophagus | ESCC | regulation of nuclear division | 90/8552 | 139/18723 | 4.30e-06 | 4.60e-05 | 90 |
| Page: 1 2 3 4 5 6 |
| Pathway ID | Tissue | Disease Stage | Description | Gene Ratio | Bg Ratio | pvalue | p.adjust | qvalue | Count |
| Page: 1 |
Top |
Cell-cell communication analysis |
| Identification of potential cell-cell interactions between two cell types and their ligand-receptor pairs for different disease states |
| Ligand | Receptor | LRpair | Pathway | Tissue | Disease Stage |
| Page: 1 |
Top |
Single-cell gene regulatory network inference analysis |
| Find out the significant the regulons (TFs) and the target genes of each regulon across cell types for different disease states |
| TF | Cell Type | Tissue | Disease Stage | Target Gene | RSS | Regulon Activity |
| ∗The dot plots of a searched regulon are shown for all cell subpopulations in each disease state of each tissue based on the regulon specific score inferred using pySCENIC and by calculating the average expression. |
| Page: 1 |
Top |
Somatic mutation of malignant transformation related genes |
| Annotation of somatic variants for genes involved in malignant transformation |
| Hugo Symbol | Variant Class | Variant Classification | dbSNP RS | HGVSc | HGVSp | HGVSp Short | SWISSPROT | BIOTYPE | SIFT | PolyPhen | Tumor Sample Barcode | Tissue | Histology | Sex | Age | Stage | Therapy Types | Drugs | Outcome |
| FBXW5 | SNV | Missense_Mutation | novel | c.410A>C | p.Asn137Thr | p.N137T | Q969U6 | protein_coding | tolerated(0.07) | benign(0.34) | TCGA-BH-A0HO-01 | Breast | breast invasive carcinoma | Female | <65 | I/II | Chemotherapy | cyclophosphamide | SD |
| FBXW5 | insertion | Nonsense_Mutation | novel | c.976_977insTTGGACAGGGACCCTCACCGTAGCCCTCCCTGCAGGCATCAAG | p.Lys326IlefsTer8 | p.K326Ifs*8 | Q969U6 | protein_coding | TCGA-A8-A07G-01 | Breast | breast invasive carcinoma | Female | >=65 | I/II | Chemotherapy | 5-fluorouracil | CR | ||
| FBXW5 | insertion | In_Frame_Ins | novel | c.410_411insTGG | p.Asn137_Trp138insGly | p.N137_W138insG | Q969U6 | protein_coding | TCGA-BH-A0HO-01 | Breast | breast invasive carcinoma | Female | <65 | I/II | Chemotherapy | cyclophosphamide | SD | ||
| FBXW5 | SNV | Missense_Mutation | novel | c.768C>G | p.Asp256Glu | p.D256E | Q969U6 | protein_coding | tolerated(0.17) | benign(0.251) | TCGA-C5-A1MF-01 | Cervix | cervical & endocervical cancer | Female | <65 | I/II | Unknown | Unknown | SD |
| FBXW5 | SNV | Missense_Mutation | c.1378N>G | p.Leu460Val | p.L460V | Q969U6 | protein_coding | deleterious(0.01) | benign(0.306) | TCGA-EK-A3GJ-01 | Cervix | cervical & endocervical cancer | Female | <65 | I/II | Unknown | Unknown | SD | |
| FBXW5 | SNV | Missense_Mutation | c.1101N>G | p.Ile367Met | p.I367M | Q969U6 | protein_coding | deleterious(0.01) | possibly_damaging(0.812) | TCGA-EK-A3GJ-01 | Cervix | cervical & endocervical cancer | Female | <65 | I/II | Unknown | Unknown | SD | |
| FBXW5 | SNV | Missense_Mutation | novel | c.528C>G | p.Asp176Glu | p.D176E | Q969U6 | protein_coding | tolerated(0.69) | benign(0.005) | TCGA-VS-A8EB-01 | Cervix | cervical & endocervical cancer | Female | <65 | III/IV | Unknown | Unknown | PD |
| FBXW5 | SNV | Missense_Mutation | novel | c.80N>C | p.Leu27Pro | p.L27P | Q969U6 | protein_coding | deleterious(0.01) | probably_damaging(1) | TCGA-A6-6780-01 | Colorectum | colon adenocarcinoma | Male | >=65 | I/II | Unknown | Unknown | SD |
| FBXW5 | SNV | Missense_Mutation | rs771667923 | c.1636G>A | p.Val546Ile | p.V546I | Q969U6 | protein_coding | tolerated(0.51) | benign(0) | TCGA-AA-3521-01 | Colorectum | colon adenocarcinoma | Male | >=65 | I/II | Unknown | Unknown | SD |
| FBXW5 | SNV | Missense_Mutation | rs201344198 | c.937N>T | p.Arg313Trp | p.R313W | Q969U6 | protein_coding | tolerated(0.18) | benign(0.226) | TCGA-AA-3531-01 | Colorectum | colon adenocarcinoma | Female | >=65 | I/II | Unknown | Unknown | SD |
| Page: 1 2 3 4 5 |
Top |
Related drugs of malignant transformation related genes |
| Identification of chemicals and drugs interact with genes involved in malignant transfromation |
| (DGIdb 4.0) |
| Entrez ID | Symbol | Category | Interaction Types | Drug Claim Name | Drug Name | PMIDs |
| Page: 1 |

Copyright 2023-Present -The University of Texas Health Science Center at Houston |