
|
|||||
|
 | |
| |
| |
| |
| |
| |
|
Gene: FBXW11 |
Gene summary for FBXW11 |
| Gene information | Species | Human | Gene symbol | FBXW11 | Gene ID | 23291 |
| Gene name | F-box and WD repeat domain containing 11 | |
| Gene Alias | BTRC2 | |
| Cytomap | 5q35.1 | |
| Gene Type | protein-coding | GO ID | GO:0000003 | UniProtAcc | Q9UKB1 |
Top |
Malignant transformation analysis |
| Identification of the aberrant gene expression in precancerous and cancerous lesions by comparing the gene expression of stem-like cells in diseased tissues with normal stem cells |
| Entrez ID | Symbol | Replicates | Species | Organ | Tissue | Adj P-value | Log2FC | Malignancy |
| 23291 | FBXW11 | CCI_2 | Human | Cervix | CC | 4.29e-09 | 1.26e+00 | 0.5249 |
| 23291 | FBXW11 | CCI_3 | Human | Cervix | CC | 3.70e-06 | 5.27e-01 | 0.516 |
| 23291 | FBXW11 | HTA11_3410_2000001011 | Human | Colorectum | AD | 7.53e-17 | -6.42e-01 | 0.0155 |
| 23291 | FBXW11 | HTA11_2487_2000001011 | Human | Colorectum | SER | 6.18e-07 | -5.24e-01 | -0.1808 |
| 23291 | FBXW11 | HTA11_3361_2000001011 | Human | Colorectum | AD | 9.31e-05 | -5.59e-01 | -0.1207 |
| 23291 | FBXW11 | HTA11_696_2000001011 | Human | Colorectum | AD | 1.55e-05 | -3.65e-01 | -0.1464 |
| 23291 | FBXW11 | HTA11_866_2000001011 | Human | Colorectum | AD | 3.67e-10 | -3.77e-01 | -0.1001 |
| 23291 | FBXW11 | HTA11_866_3004761011 | Human | Colorectum | AD | 4.49e-07 | -4.91e-01 | 0.096 |
| 23291 | FBXW11 | HTA11_10711_2000001011 | Human | Colorectum | AD | 1.02e-05 | -4.87e-01 | 0.0338 |
| 23291 | FBXW11 | HTA11_7696_3000711011 | Human | Colorectum | AD | 6.28e-12 | -4.81e-01 | 0.0674 |
| 23291 | FBXW11 | HTA11_99999970781_79442 | Human | Colorectum | MSS | 9.82e-09 | -3.84e-01 | 0.294 |
| 23291 | FBXW11 | HTA11_99999974143_84620 | Human | Colorectum | MSS | 1.64e-15 | -5.01e-01 | 0.3005 |
| 23291 | FBXW11 | A001-C-207 | Human | Colorectum | FAP | 1.95e-04 | -2.91e-01 | 0.1278 |
| 23291 | FBXW11 | A015-C-203 | Human | Colorectum | FAP | 6.61e-32 | -4.60e-01 | -0.1294 |
| 23291 | FBXW11 | A015-C-204 | Human | Colorectum | FAP | 6.71e-07 | -3.51e-01 | -0.0228 |
| 23291 | FBXW11 | A014-C-040 | Human | Colorectum | FAP | 8.81e-05 | -5.07e-01 | -0.1184 |
| 23291 | FBXW11 | A002-C-201 | Human | Colorectum | FAP | 9.09e-18 | -4.34e-01 | 0.0324 |
| 23291 | FBXW11 | A002-C-203 | Human | Colorectum | FAP | 8.57e-04 | -2.65e-01 | 0.2786 |
| 23291 | FBXW11 | A001-C-119 | Human | Colorectum | FAP | 1.93e-06 | -4.33e-01 | -0.1557 |
| 23291 | FBXW11 | A001-C-108 | Human | Colorectum | FAP | 3.23e-18 | -3.49e-01 | -0.0272 |
| Page: 1 2 3 4 5 6 7 8 9 |
| Tissue | Expression Dynamics | Abbreviation |
| Cervix | 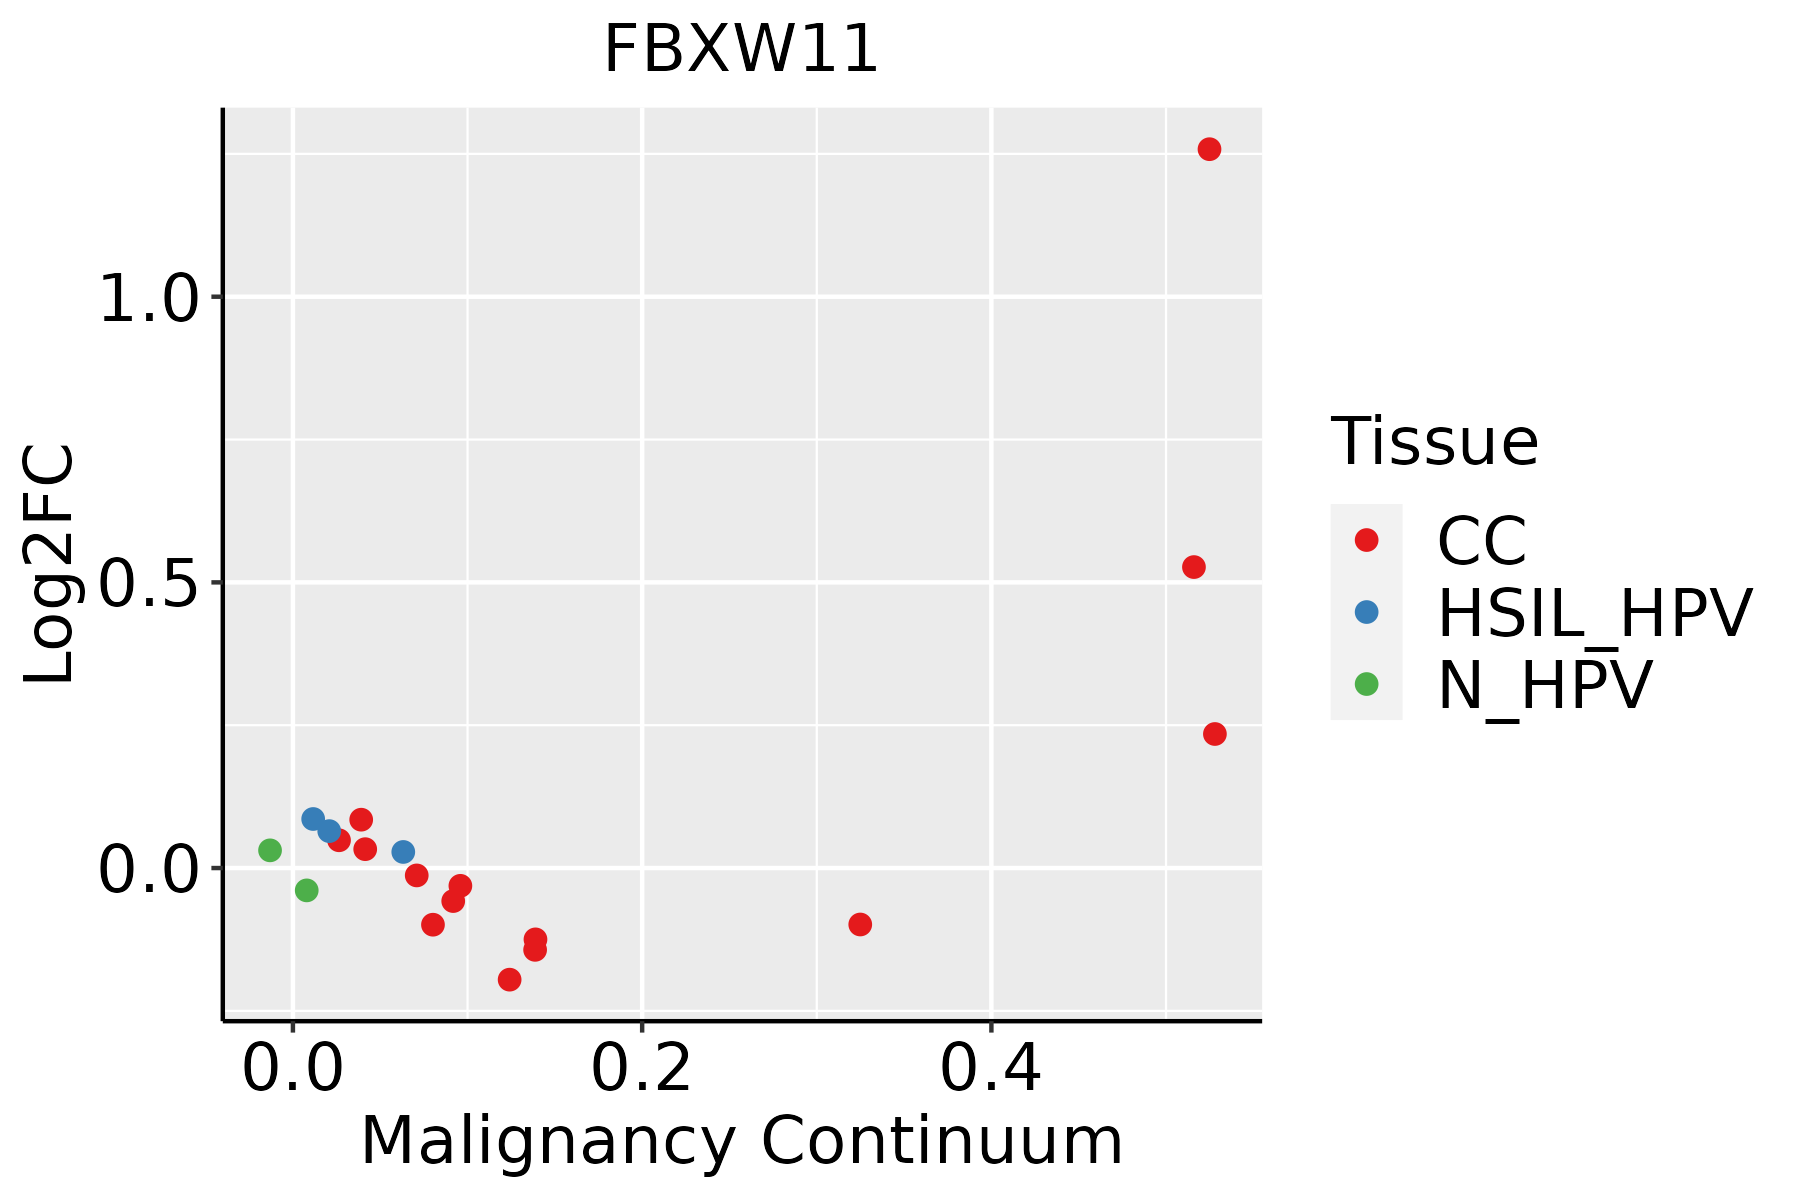 | CC: Cervix cancer |
| HSIL_HPV: HPV-infected high-grade squamous intraepithelial lesions | ||
| N_HPV: HPV-infected normal cervix | ||
| Colorectum (GSE201348) | 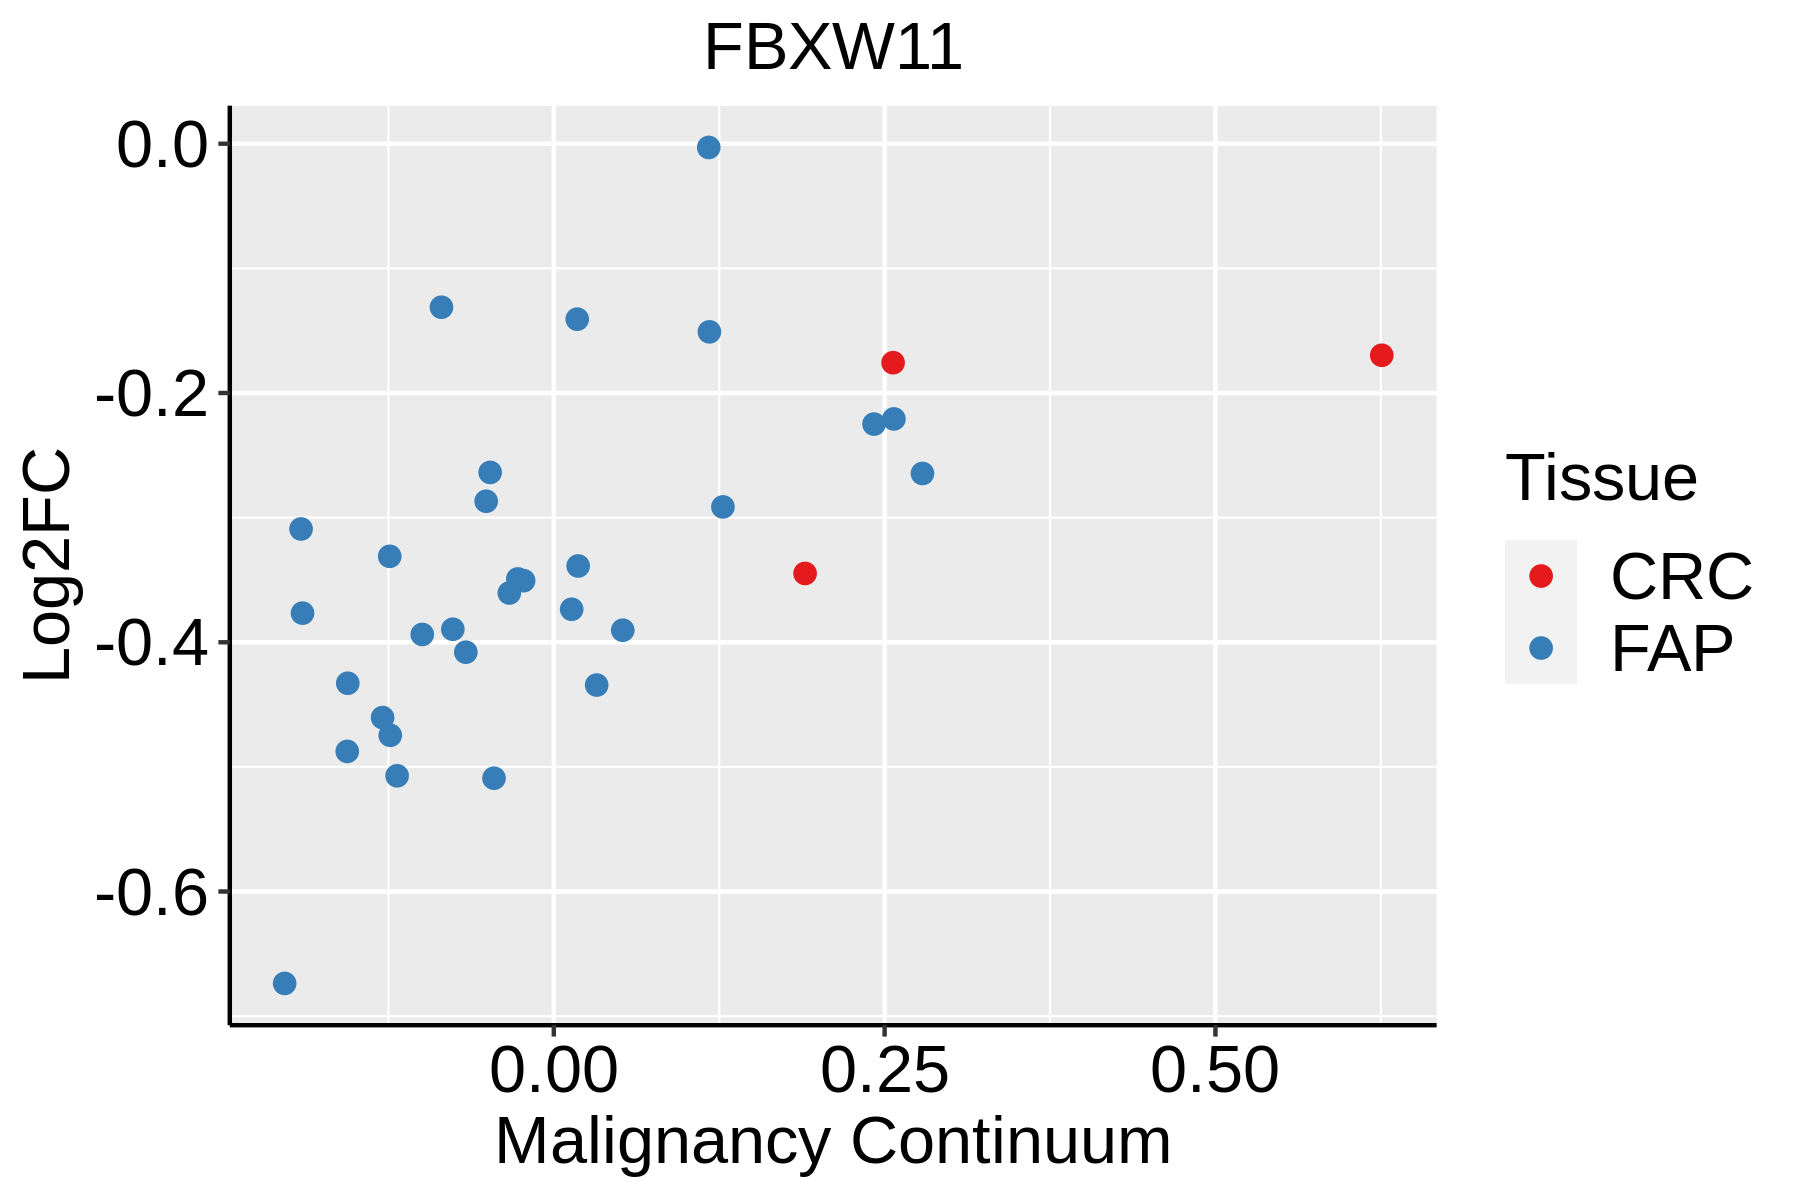 | FAP: Familial adenomatous polyposis |
| CRC: Colorectal cancer | ||
| Colorectum (HTA11) |  | AD: Adenomas |
| SER: Sessile serrated lesions | ||
| MSI-H: Microsatellite-high colorectal cancer | ||
| MSS: Microsatellite stable colorectal cancer | ||
| Endometrium | 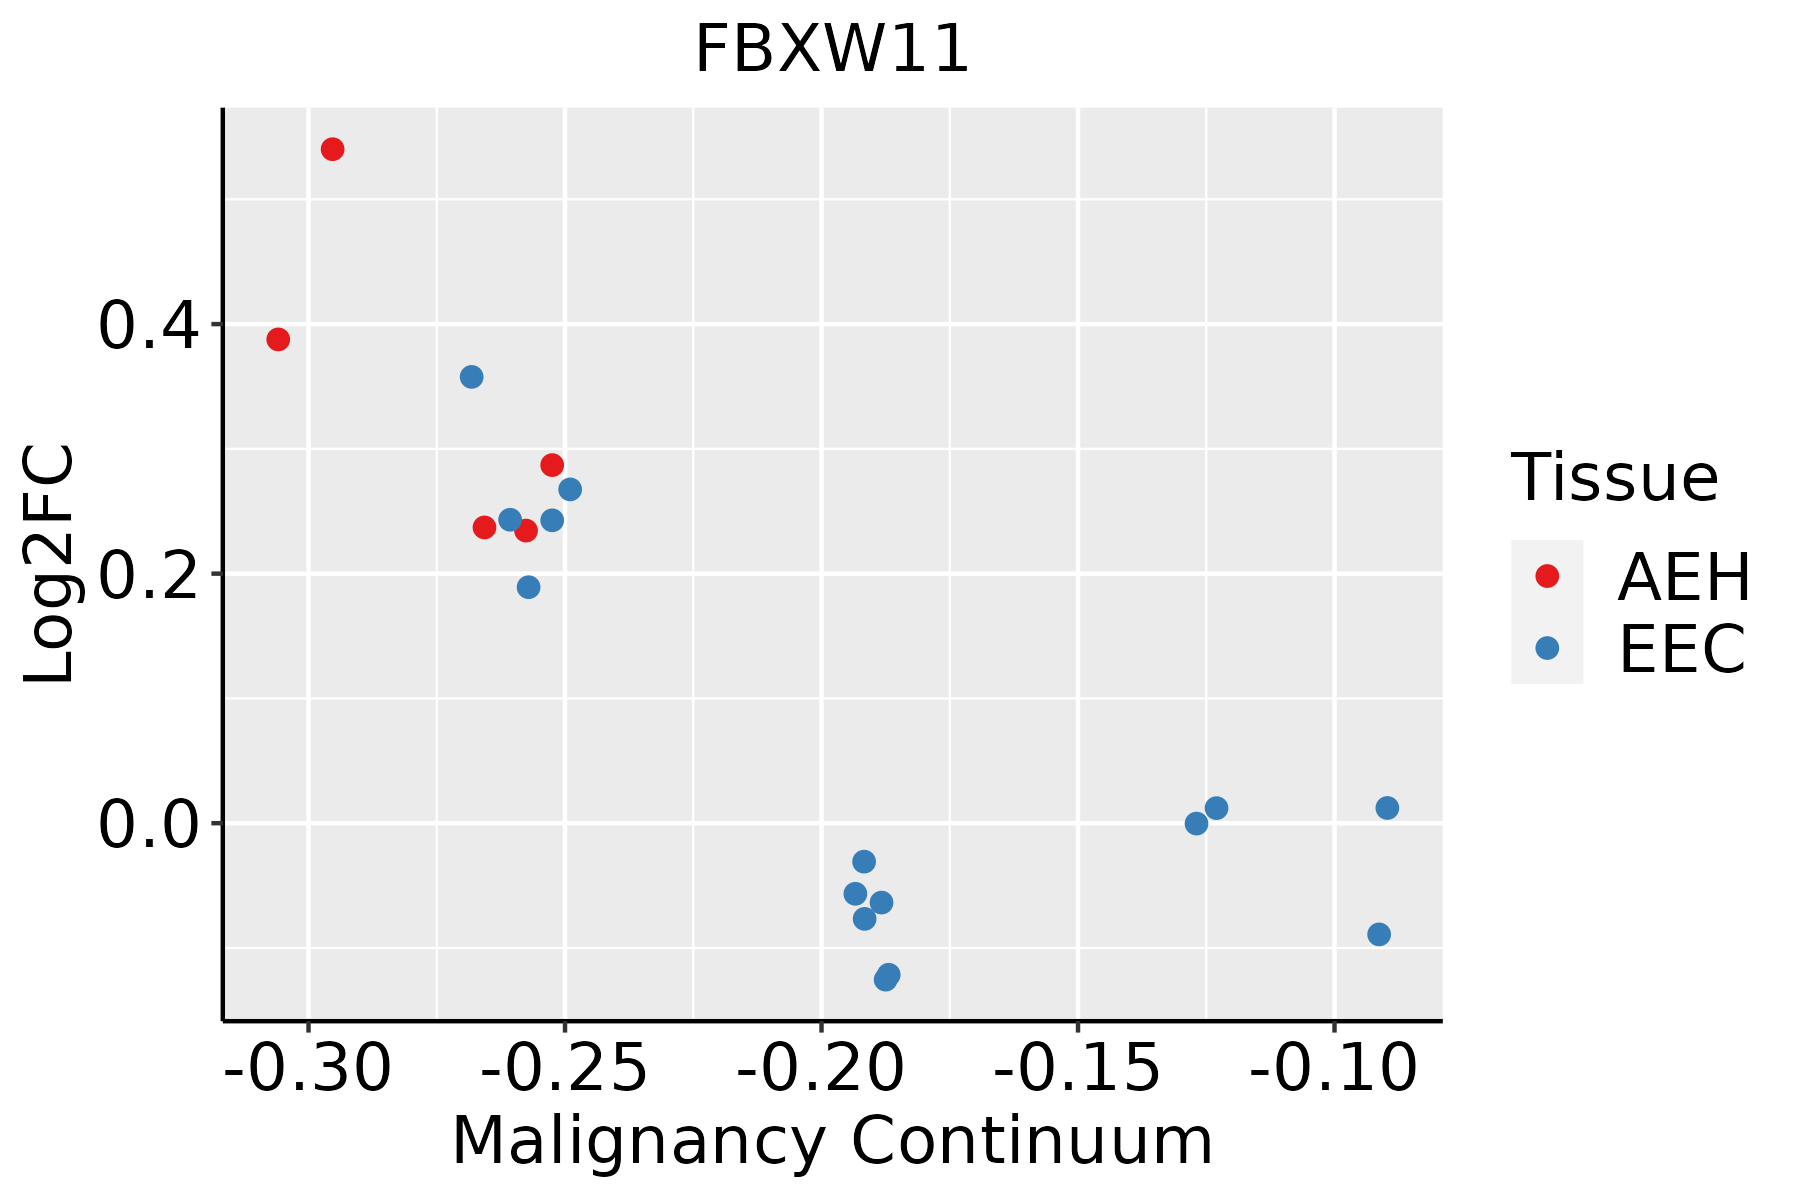 | AEH: Atypical endometrial hyperplasia |
| EEC: Endometrioid Cancer | ||
| Esophagus | 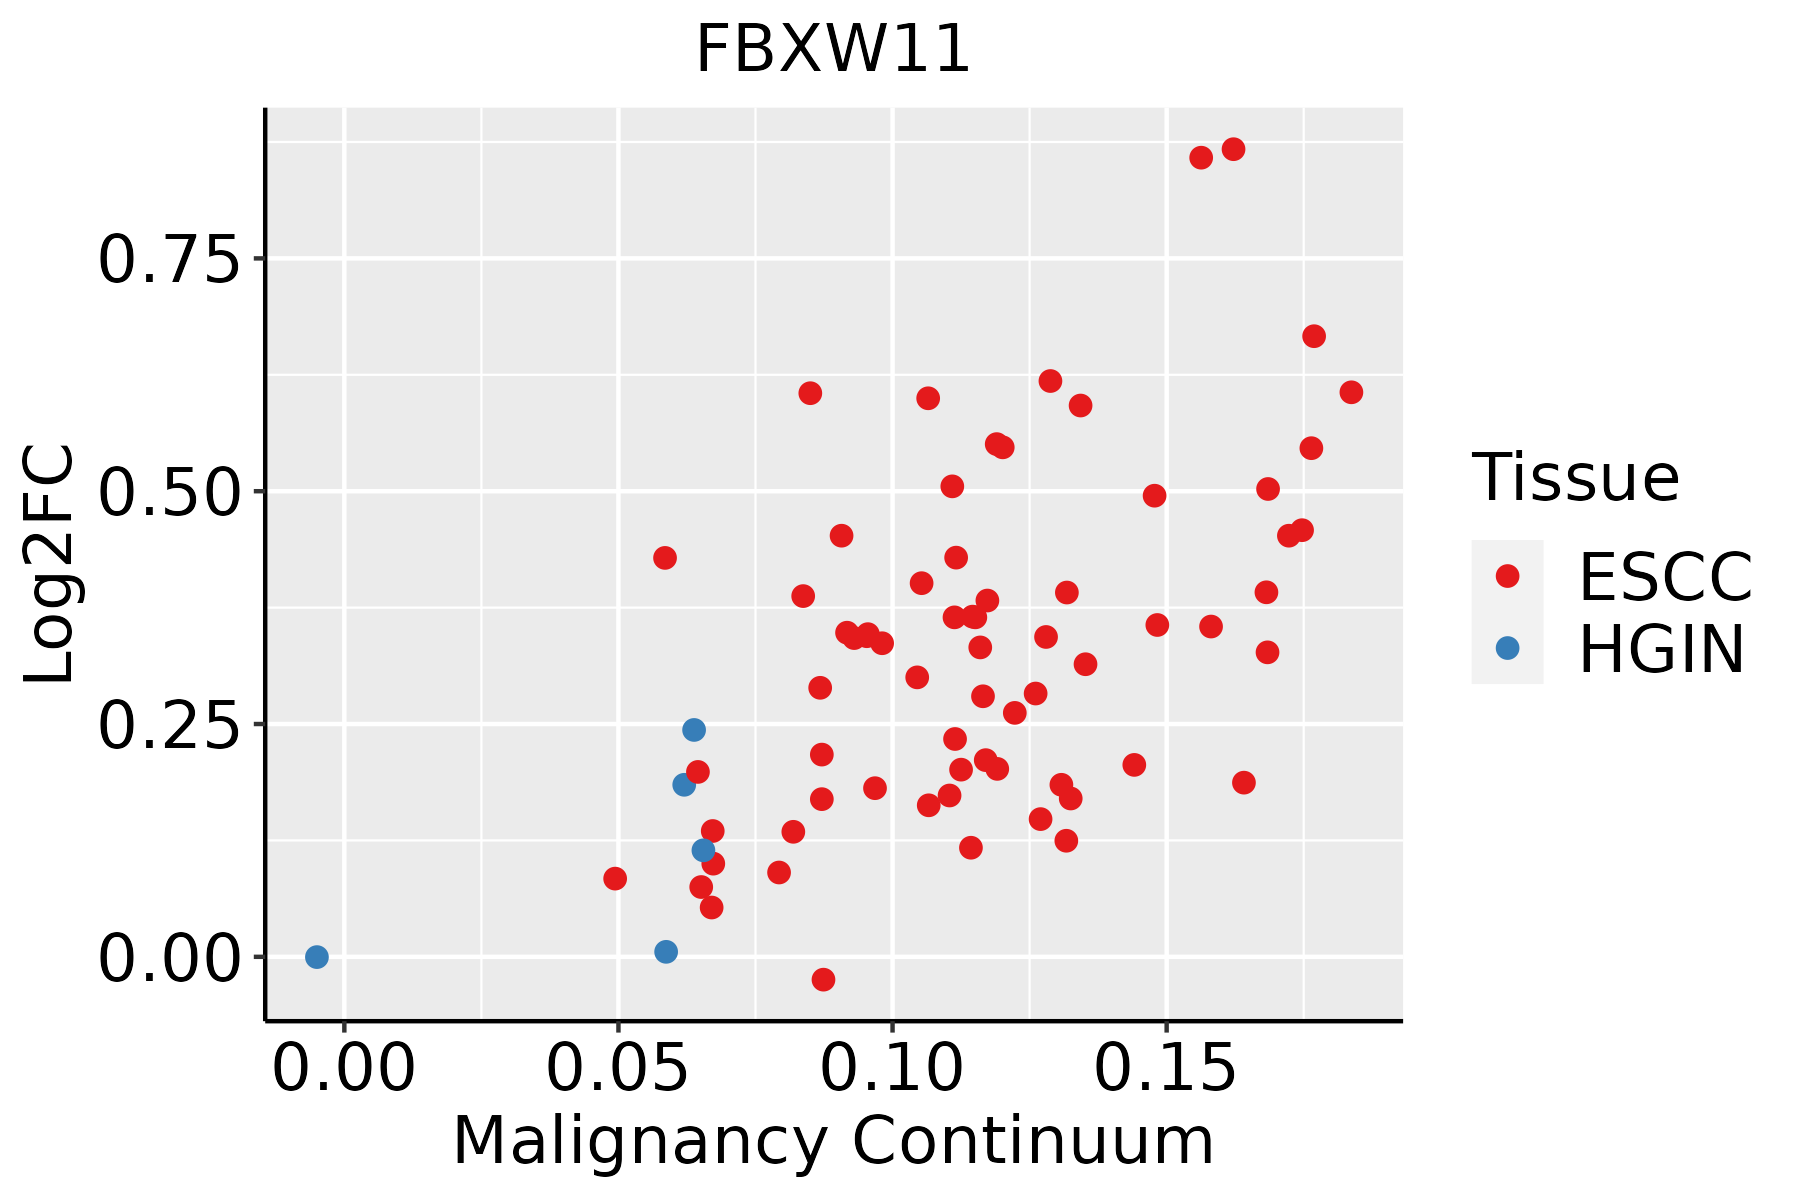 | ESCC: Esophageal squamous cell carcinoma |
| HGIN: High-grade intraepithelial neoplasias | ||
| LGIN: Low-grade intraepithelial neoplasias | ||
| Liver | 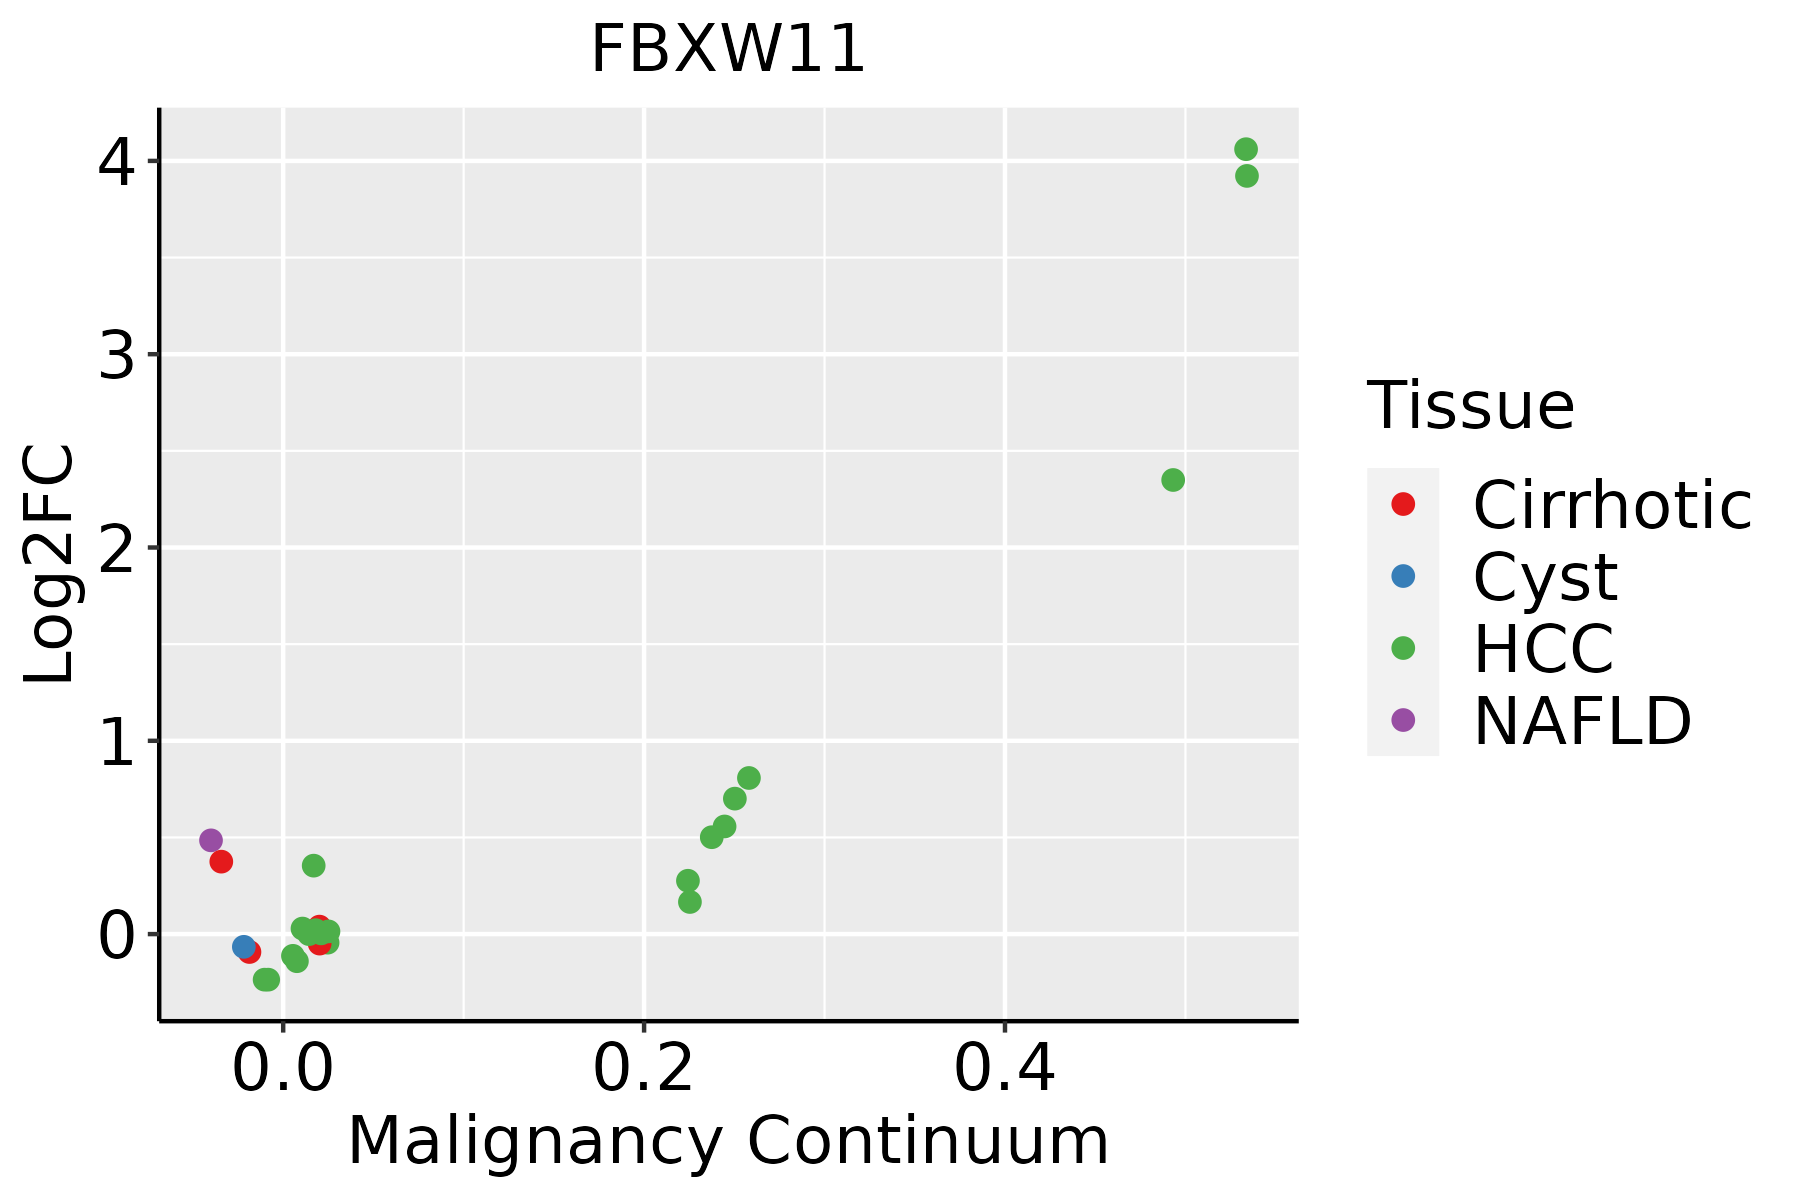 | HCC: Hepatocellular carcinoma |
| NAFLD: Non-alcoholic fatty liver disease | ||
| Lung | 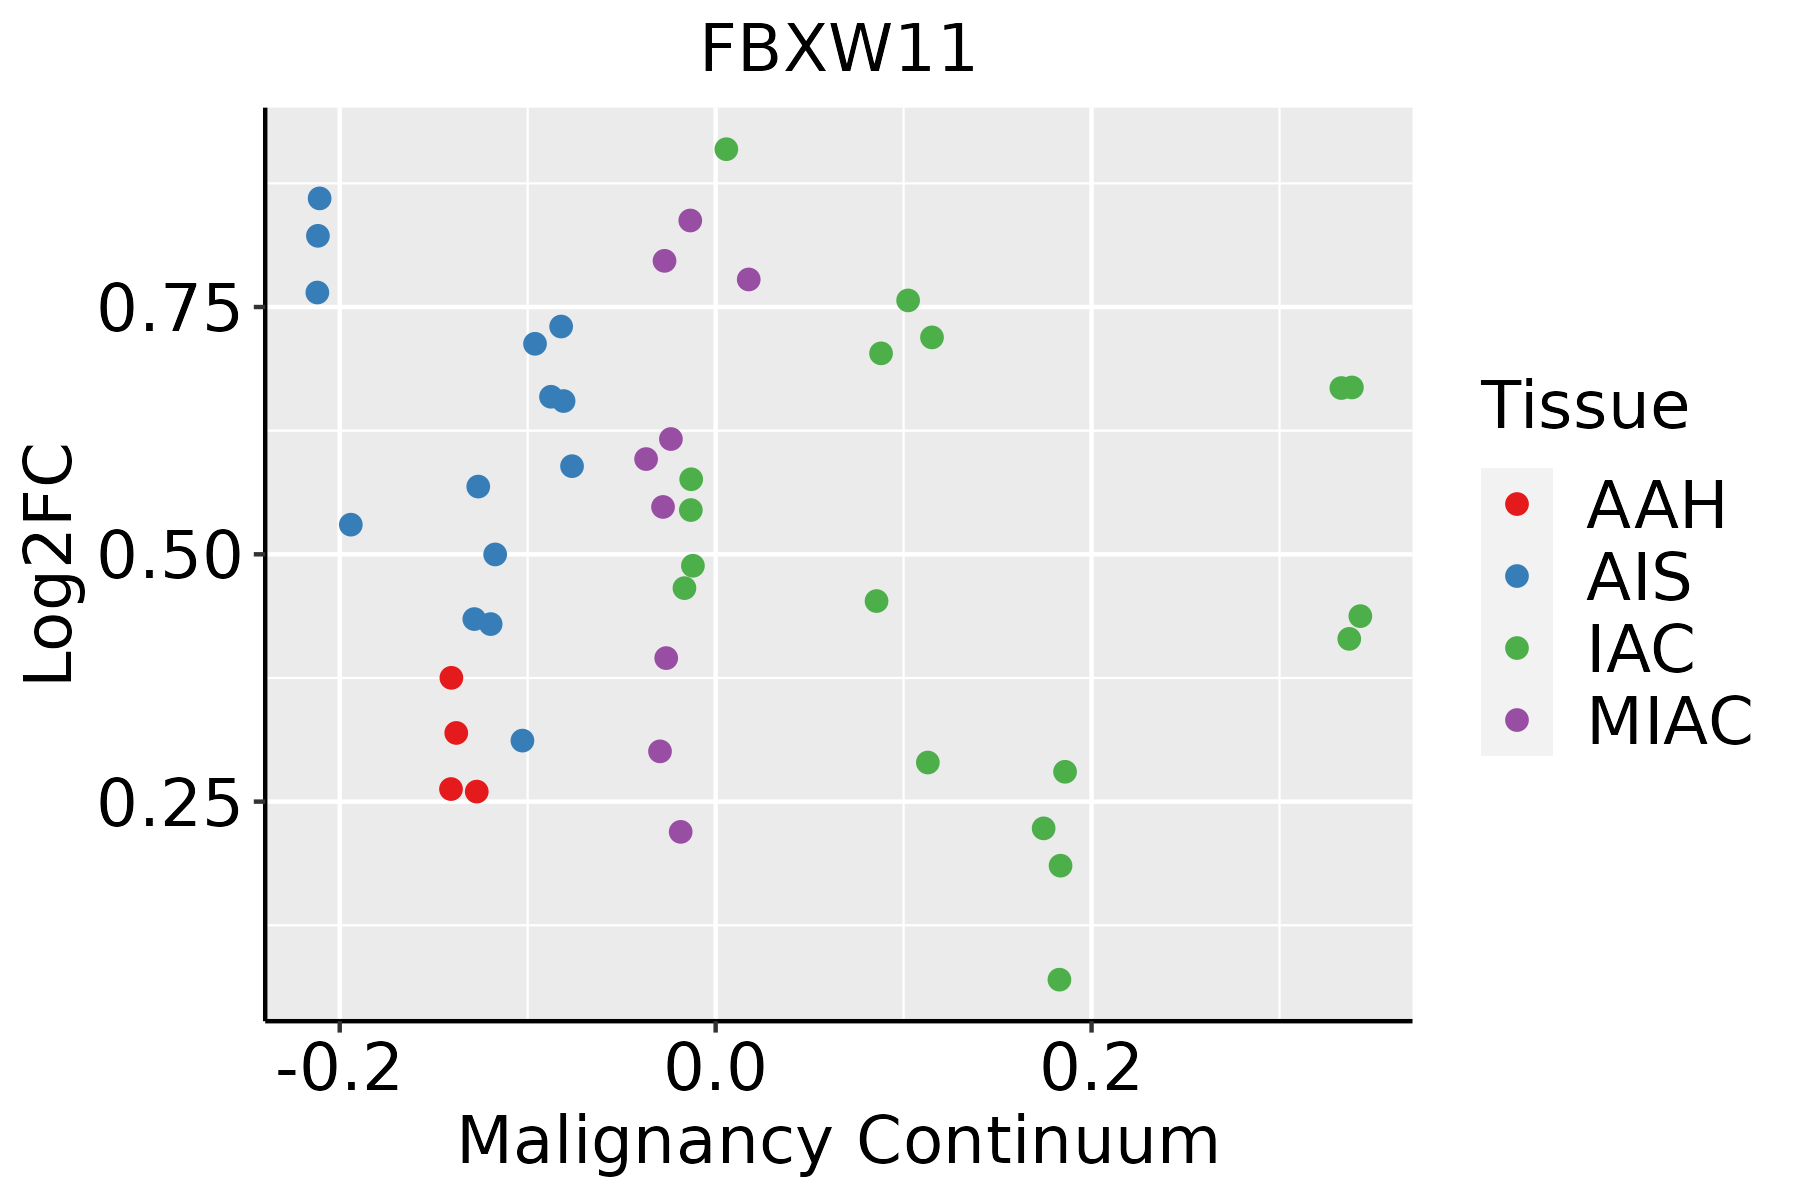 | AAH: Atypical adenomatous hyperplasia |
| AIS: Adenocarcinoma in situ | ||
| IAC: Invasive lung adenocarcinoma | ||
| MIA: Minimally invasive adenocarcinoma | ||
| Prostate |  | BPH: Benign Prostatic Hyperplasia |
| Thyroid | 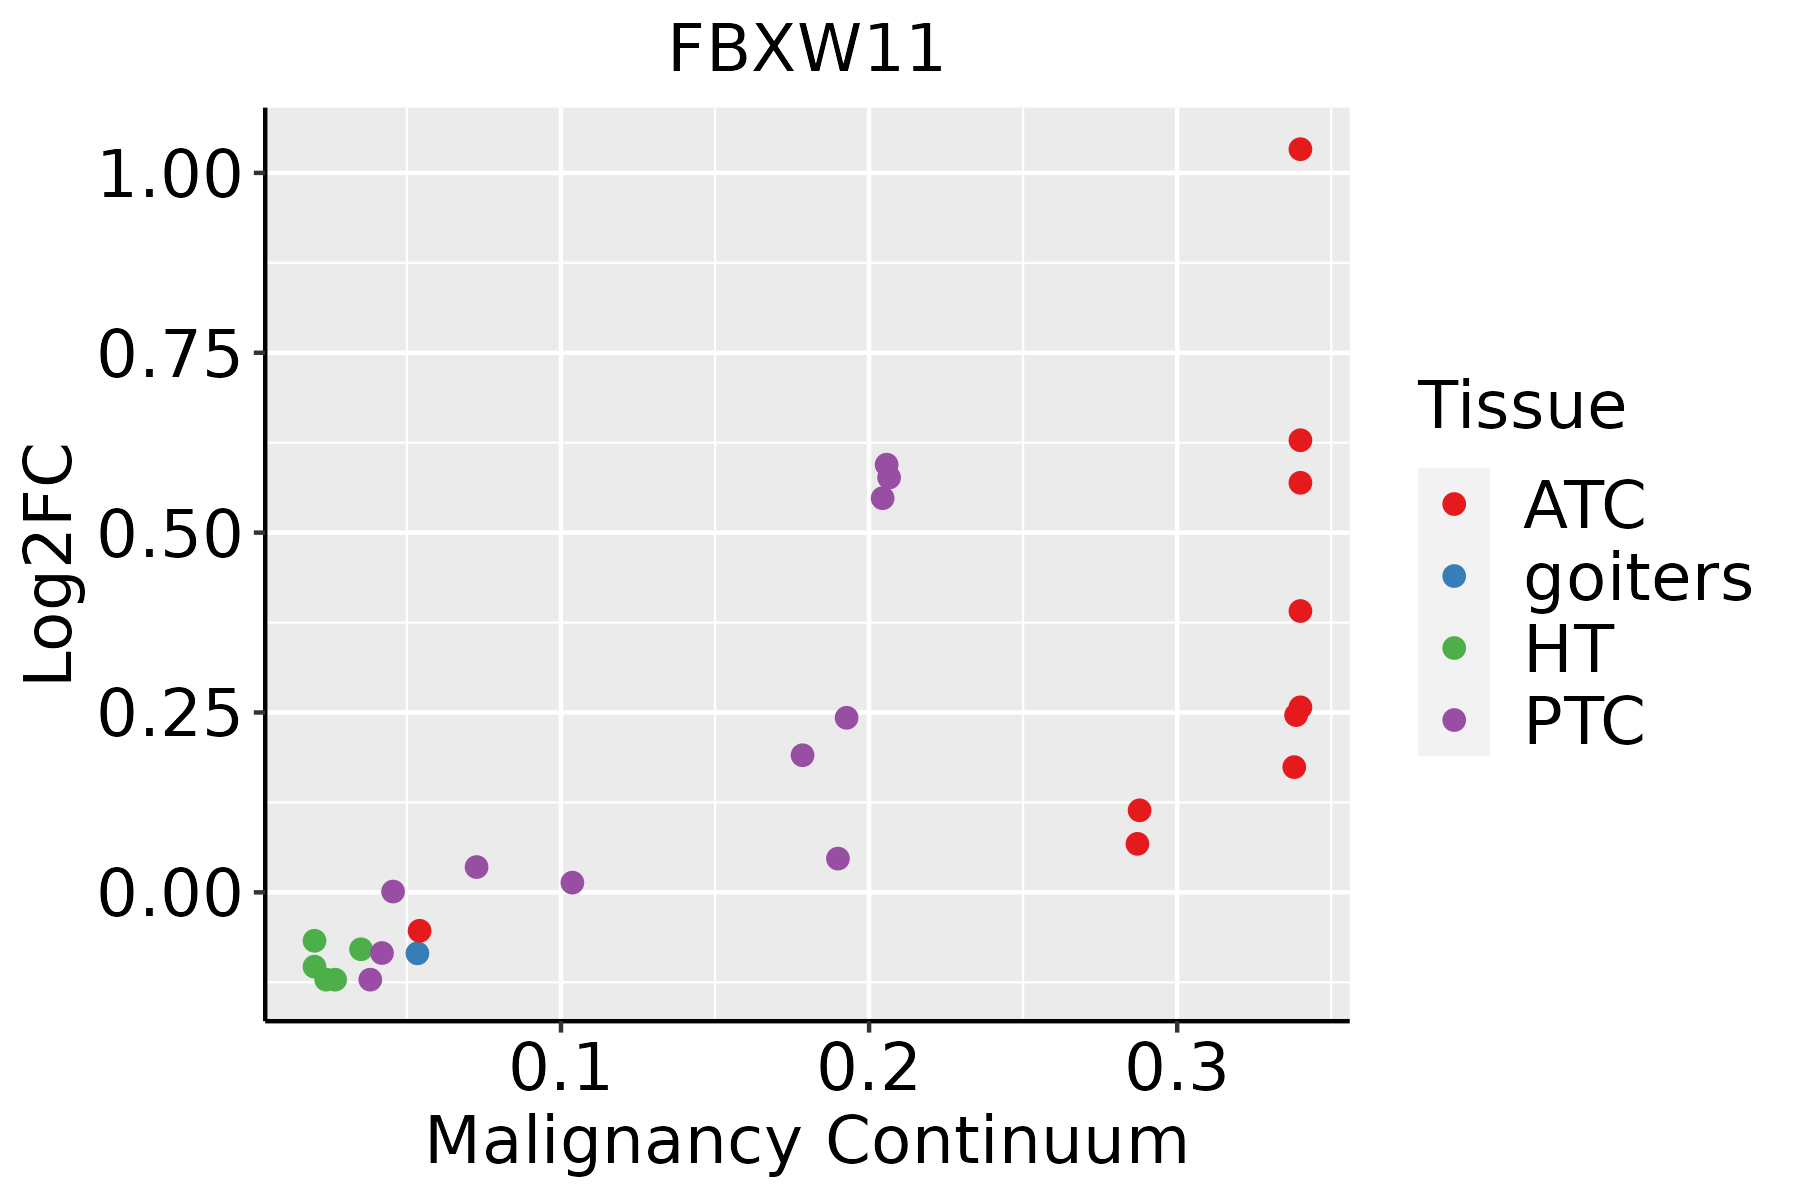 | ATC: Anaplastic thyroid cancer |
| HT: Hashimoto's thyroiditis | ||
| PTC: Papillary thyroid cancer |
| ∗log2FC in expression of this searched gene in stem-like cells from each diseased tissue sample relative to stem-like cells in normal samples in each tissue plotted against the malignancy continuum. Samples are colored based on if they are from different disease stage. |
Top |
Malignant transformation related pathway analysis |
| Find out the enriched GO biological processes and KEGG pathways involved in transition from healthy to precancer to cancer |
| Tissue | Disease Stage | Enriched GO biological Processes |
| Colorectum | AD |  |
| Colorectum | SER |  |
| Colorectum | MSS |  |
| Colorectum | MSI-H |  |
| Colorectum | FAP |  |
| ∗Top 15 enriched GO BP terms are showed in the bar plot of each disease state in each tissue. Each row represents a significant GO biological process which is colored according to the -log10(p.adjust). |
| Page: 1 2 3 4 5 6 7 8 9 |
| GO ID | Tissue | Disease Stage | Description | Gene Ratio | Bg Ratio | pvalue | p.adjust | Count |
| GO:004586210 | Cervix | CC | positive regulation of proteolysis | 95/2311 | 372/18723 | 1.84e-12 | 6.86e-10 | 95 |
| GO:00071639 | Cervix | CC | establishment or maintenance of cell polarity | 63/2311 | 218/18723 | 4.25e-11 | 8.76e-09 | 63 |
| GO:001049810 | Cervix | CC | proteasomal protein catabolic process | 111/2311 | 490/18723 | 8.98e-11 | 1.58e-08 | 111 |
| GO:00160557 | Cervix | CC | Wnt signaling pathway | 98/2311 | 444/18723 | 4.82e-09 | 4.65e-07 | 98 |
| GO:01987387 | Cervix | CC | cell-cell signaling by wnt | 98/2311 | 446/18723 | 6.16e-09 | 5.58e-07 | 98 |
| GO:004316110 | Cervix | CC | proteasome-mediated ubiquitin-dependent protein catabolic process | 91/2311 | 412/18723 | 1.65e-08 | 1.25e-06 | 91 |
| GO:00300108 | Cervix | CC | establishment of cell polarity | 42/2311 | 143/18723 | 4.30e-08 | 2.62e-06 | 42 |
| GO:00002097 | Cervix | CC | protein polyubiquitination | 58/2311 | 236/18723 | 1.57e-07 | 7.41e-06 | 58 |
| GO:00485118 | Cervix | CC | rhythmic process | 65/2311 | 298/18723 | 2.79e-06 | 8.04e-05 | 65 |
| GO:003164710 | Cervix | CC | regulation of protein stability | 63/2311 | 298/18723 | 1.14e-05 | 2.45e-04 | 63 |
| GO:00064708 | Cervix | CC | protein dephosphorylation | 60/2311 | 281/18723 | 1.33e-05 | 2.68e-04 | 60 |
| GO:00516567 | Cervix | CC | establishment of organelle localization | 76/2311 | 390/18723 | 3.17e-05 | 5.21e-04 | 76 |
| GO:00076238 | Cervix | CC | circadian rhythm | 46/2311 | 210/18723 | 6.76e-05 | 9.60e-04 | 46 |
| GO:00307057 | Cervix | CC | cytoskeleton-dependent intracellular transport | 40/2311 | 195/18723 | 7.92e-04 | 6.99e-03 | 40 |
| GO:00163117 | Cervix | CC | dephosphorylation | 73/2311 | 417/18723 | 1.23e-03 | 9.87e-03 | 73 |
| GO:00080886 | Cervix | CC | axo-dendritic transport | 17/2311 | 75/18723 | 8.87e-03 | 4.53e-02 | 17 |
| GO:0010498 | Colorectum | AD | proteasomal protein catabolic process | 174/3918 | 490/18723 | 3.18e-14 | 7.66e-12 | 174 |
| GO:0043161 | Colorectum | AD | proteasome-mediated ubiquitin-dependent protein catabolic process | 141/3918 | 412/18723 | 1.77e-10 | 1.68e-08 | 141 |
| GO:0045862 | Colorectum | AD | positive regulation of proteolysis | 129/3918 | 372/18723 | 4.04e-10 | 3.46e-08 | 129 |
| GO:0031647 | Colorectum | AD | regulation of protein stability | 108/3918 | 298/18723 | 6.33e-10 | 5.08e-08 | 108 |
| Page: 1 2 3 4 5 6 7 8 9 10 11 12 13 14 15 16 17 18 19 20 21 22 |
| Pathway ID | Tissue | Disease Stage | Description | Gene Ratio | Bg Ratio | pvalue | p.adjust | qvalue | Count |
| hsa0412014 | Cervix | CC | Ubiquitin mediated proteolysis | 49/1267 | 142/8465 | 4.26e-09 | 7.68e-08 | 4.54e-08 | 49 |
| hsa0513120 | Cervix | CC | Shigellosis | 69/1267 | 247/8465 | 7.64e-08 | 1.03e-06 | 6.10e-07 | 69 |
| hsa0421810 | Cervix | CC | Cellular senescence | 49/1267 | 156/8465 | 1.30e-07 | 1.63e-06 | 9.61e-07 | 49 |
| hsa0517016 | Cervix | CC | Human immunodeficiency virus 1 infection | 55/1267 | 212/8465 | 1.80e-05 | 1.42e-04 | 8.40e-05 | 55 |
| hsa043109 | Cervix | CC | Wnt signaling pathway | 43/1267 | 171/8465 | 3.03e-04 | 1.64e-03 | 9.68e-04 | 43 |
| hsa043908 | Cervix | CC | Hippo signaling pathway | 40/1267 | 157/8465 | 3.64e-04 | 1.82e-03 | 1.07e-03 | 40 |
| hsa0412015 | Cervix | CC | Ubiquitin mediated proteolysis | 49/1267 | 142/8465 | 4.26e-09 | 7.68e-08 | 4.54e-08 | 49 |
| hsa05131110 | Cervix | CC | Shigellosis | 69/1267 | 247/8465 | 7.64e-08 | 1.03e-06 | 6.10e-07 | 69 |
| hsa0421815 | Cervix | CC | Cellular senescence | 49/1267 | 156/8465 | 1.30e-07 | 1.63e-06 | 9.61e-07 | 49 |
| hsa0517017 | Cervix | CC | Human immunodeficiency virus 1 infection | 55/1267 | 212/8465 | 1.80e-05 | 1.42e-04 | 8.40e-05 | 55 |
| hsa0431012 | Cervix | CC | Wnt signaling pathway | 43/1267 | 171/8465 | 3.03e-04 | 1.64e-03 | 9.68e-04 | 43 |
| hsa0439013 | Cervix | CC | Hippo signaling pathway | 40/1267 | 157/8465 | 3.64e-04 | 1.82e-03 | 1.07e-03 | 40 |
| hsa05131 | Colorectum | AD | Shigellosis | 109/2092 | 247/8465 | 1.09e-11 | 2.44e-10 | 1.55e-10 | 109 |
| hsa04120 | Colorectum | AD | Ubiquitin mediated proteolysis | 58/2092 | 142/8465 | 1.46e-05 | 1.53e-04 | 9.76e-05 | 58 |
| hsa05170 | Colorectum | AD | Human immunodeficiency virus 1 infection | 72/2092 | 212/8465 | 1.40e-03 | 8.46e-03 | 5.39e-03 | 72 |
| hsa04218 | Colorectum | AD | Cellular senescence | 53/2092 | 156/8465 | 5.55e-03 | 2.48e-02 | 1.58e-02 | 53 |
| hsa04310 | Colorectum | AD | Wnt signaling pathway | 56/2092 | 171/8465 | 1.03e-02 | 3.93e-02 | 2.51e-02 | 56 |
| hsa051311 | Colorectum | AD | Shigellosis | 109/2092 | 247/8465 | 1.09e-11 | 2.44e-10 | 1.55e-10 | 109 |
| hsa041201 | Colorectum | AD | Ubiquitin mediated proteolysis | 58/2092 | 142/8465 | 1.46e-05 | 1.53e-04 | 9.76e-05 | 58 |
| hsa051701 | Colorectum | AD | Human immunodeficiency virus 1 infection | 72/2092 | 212/8465 | 1.40e-03 | 8.46e-03 | 5.39e-03 | 72 |
| Page: 1 2 3 4 5 6 7 8 9 |
Top |
Cell-cell communication analysis |
| Identification of potential cell-cell interactions between two cell types and their ligand-receptor pairs for different disease states |
| Ligand | Receptor | LRpair | Pathway | Tissue | Disease Stage |
| Page: 1 |
Top |
Single-cell gene regulatory network inference analysis |
| Find out the significant the regulons (TFs) and the target genes of each regulon across cell types for different disease states |
| TF | Cell Type | Tissue | Disease Stage | Target Gene | RSS | Regulon Activity |
| ∗The dot plots of a searched regulon are shown for all cell subpopulations in each disease state of each tissue based on the regulon specific score inferred using pySCENIC and by calculating the average expression. |
| Page: 1 |
Top |
Somatic mutation of malignant transformation related genes |
| Annotation of somatic variants for genes involved in malignant transformation |
| Hugo Symbol | Variant Class | Variant Classification | dbSNP RS | HGVSc | HGVSp | HGVSp Short | SWISSPROT | BIOTYPE | SIFT | PolyPhen | Tumor Sample Barcode | Tissue | Histology | Sex | Age | Stage | Therapy Types | Drugs | Outcome |
| FBXW11 | deletion | Frame_Shift_Del | novel | c.716delN | p.Asn239IlefsTer35 | p.N239Ifs*35 | Q9UKB1 | protein_coding | TCGA-EW-A2FV-01 | Breast | breast invasive carcinoma | Female | <65 | III/IV | Chemotherapy | docetaxel | SD | ||
| FBXW11 | SNV | Missense_Mutation | c.816N>G | p.Cys272Trp | p.C272W | Q9UKB1 | protein_coding | deleterious(0) | probably_damaging(0.994) | TCGA-FU-A3HZ-01 | Cervix | cervical & endocervical cancer | Female | <65 | I/II | Chemotherapy | cisplatin | CR | |
| FBXW11 | SNV | Missense_Mutation | c.1219N>A | p.Ala407Thr | p.A407T | Q9UKB1 | protein_coding | tolerated(0.06) | possibly_damaging(0.688) | TCGA-ZJ-AAXI-01 | Cervix | cervical & endocervical cancer | Female | >=65 | I/II | Unknown | Unknown | SD | |
| FBXW11 | SNV | Missense_Mutation | c.847N>A | p.Val283Ile | p.V283I | Q9UKB1 | protein_coding | deleterious(0.01) | probably_damaging(0.997) | TCGA-A6-6653-01 | Colorectum | colon adenocarcinoma | Male | >=65 | I/II | Unknown | Unknown | SD | |
| FBXW11 | SNV | Missense_Mutation | c.364G>A | p.Ala122Thr | p.A122T | Q9UKB1 | protein_coding | tolerated(0.48) | benign(0.123) | TCGA-AA-3864-01 | Colorectum | colon adenocarcinoma | Male | >=65 | I/II | Unknown | Unknown | SD | |
| FBXW11 | SNV | Missense_Mutation | c.509G>A | p.Arg170Gln | p.R170Q | Q9UKB1 | protein_coding | deleterious(0.02) | possibly_damaging(0.815) | TCGA-AA-3977-01 | Colorectum | colon adenocarcinoma | Male | >=65 | I/II | Unknown | Unknown | SD | |
| FBXW11 | SNV | Missense_Mutation | c.856N>A | p.Leu286Met | p.L286M | Q9UKB1 | protein_coding | deleterious(0) | probably_damaging(1) | TCGA-AA-A010-01 | Colorectum | colon adenocarcinoma | Female | <65 | I/II | Chemotherapy | folinic | CR | |
| FBXW11 | SNV | Missense_Mutation | c.8C>A | p.Pro3His | p.P3H | Q9UKB1 | protein_coding | deleterious_low_confidence(0.01) | benign(0.365) | TCGA-AD-5900-01 | Colorectum | colon adenocarcinoma | Male | >=65 | I/II | Unknown | Unknown | SD | |
| FBXW11 | SNV | Missense_Mutation | c.449N>C | p.Val150Ala | p.V150A | Q9UKB1 | protein_coding | deleterious(0.03) | probably_damaging(1) | TCGA-AM-5821-01 | Colorectum | colon adenocarcinoma | Female | >=65 | I/II | Unknown | Unknown | SD | |
| FBXW11 | SNV | Missense_Mutation | rs778006732 | c.293N>A | p.Arg98Gln | p.R98Q | Q9UKB1 | protein_coding | tolerated(0.15) | benign(0.055) | TCGA-CA-6717-01 | Colorectum | colon adenocarcinoma | Male | <65 | I/II | Chemotherapy | oxaliplatin | CR |
| Page: 1 2 3 4 5 6 7 |
Top |
Related drugs of malignant transformation related genes |
| Identification of chemicals and drugs interact with genes involved in malignant transfromation |
| (DGIdb 4.0) |
| Entrez ID | Symbol | Category | Interaction Types | Drug Claim Name | Drug Name | PMIDs |
| Page: 1 |

Copyright 2023-Present -The University of Texas Health Science Center at Houston |